Download to read offline


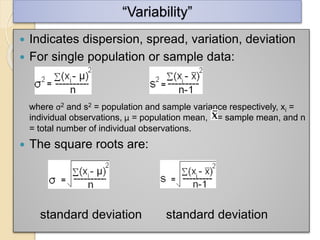
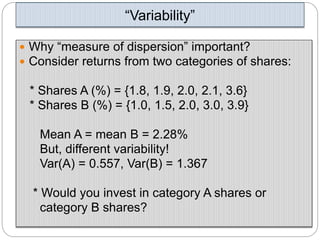
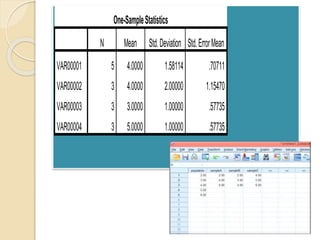
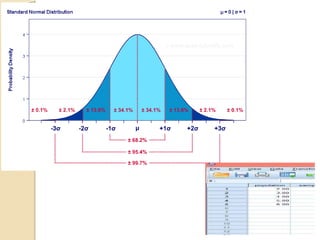
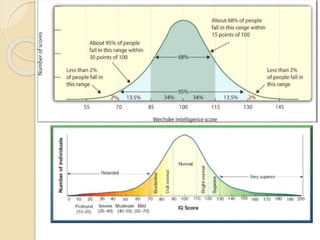

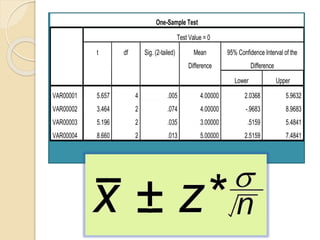


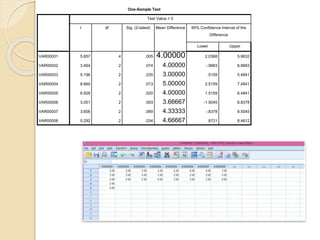

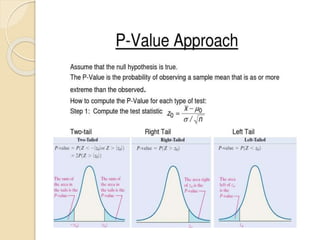
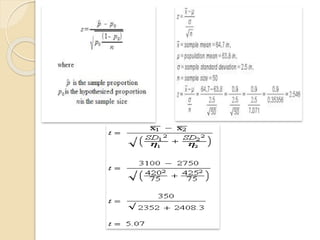
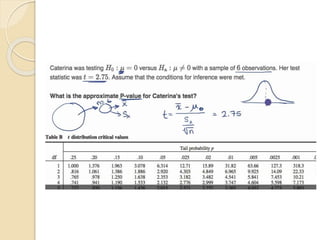
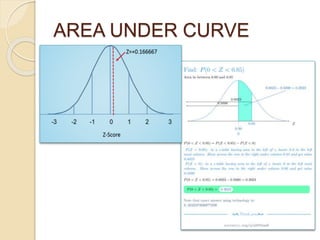
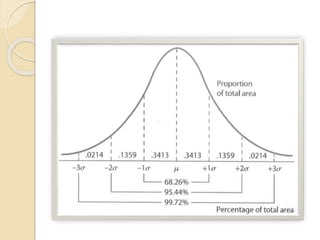
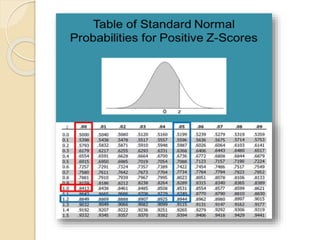
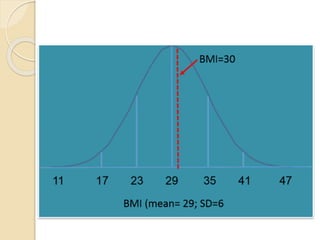
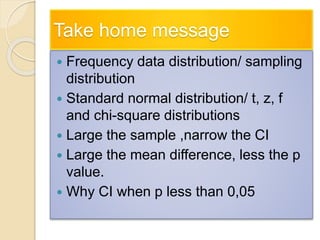


This document discusses statistical concepts like variability, standard deviation, confidence intervals, p-values, and distributions. It provides examples to illustrate variability and how it is important when evaluating investments. It also includes tables showing output from statistical tests run on multiple variables, including sample sizes, means, standard deviations, and confidence intervals. The conclusion emphasizes the relationships between sample size, mean differences, and p-values in determining confidence intervals and statistical significance.


