Downloaded 78 times
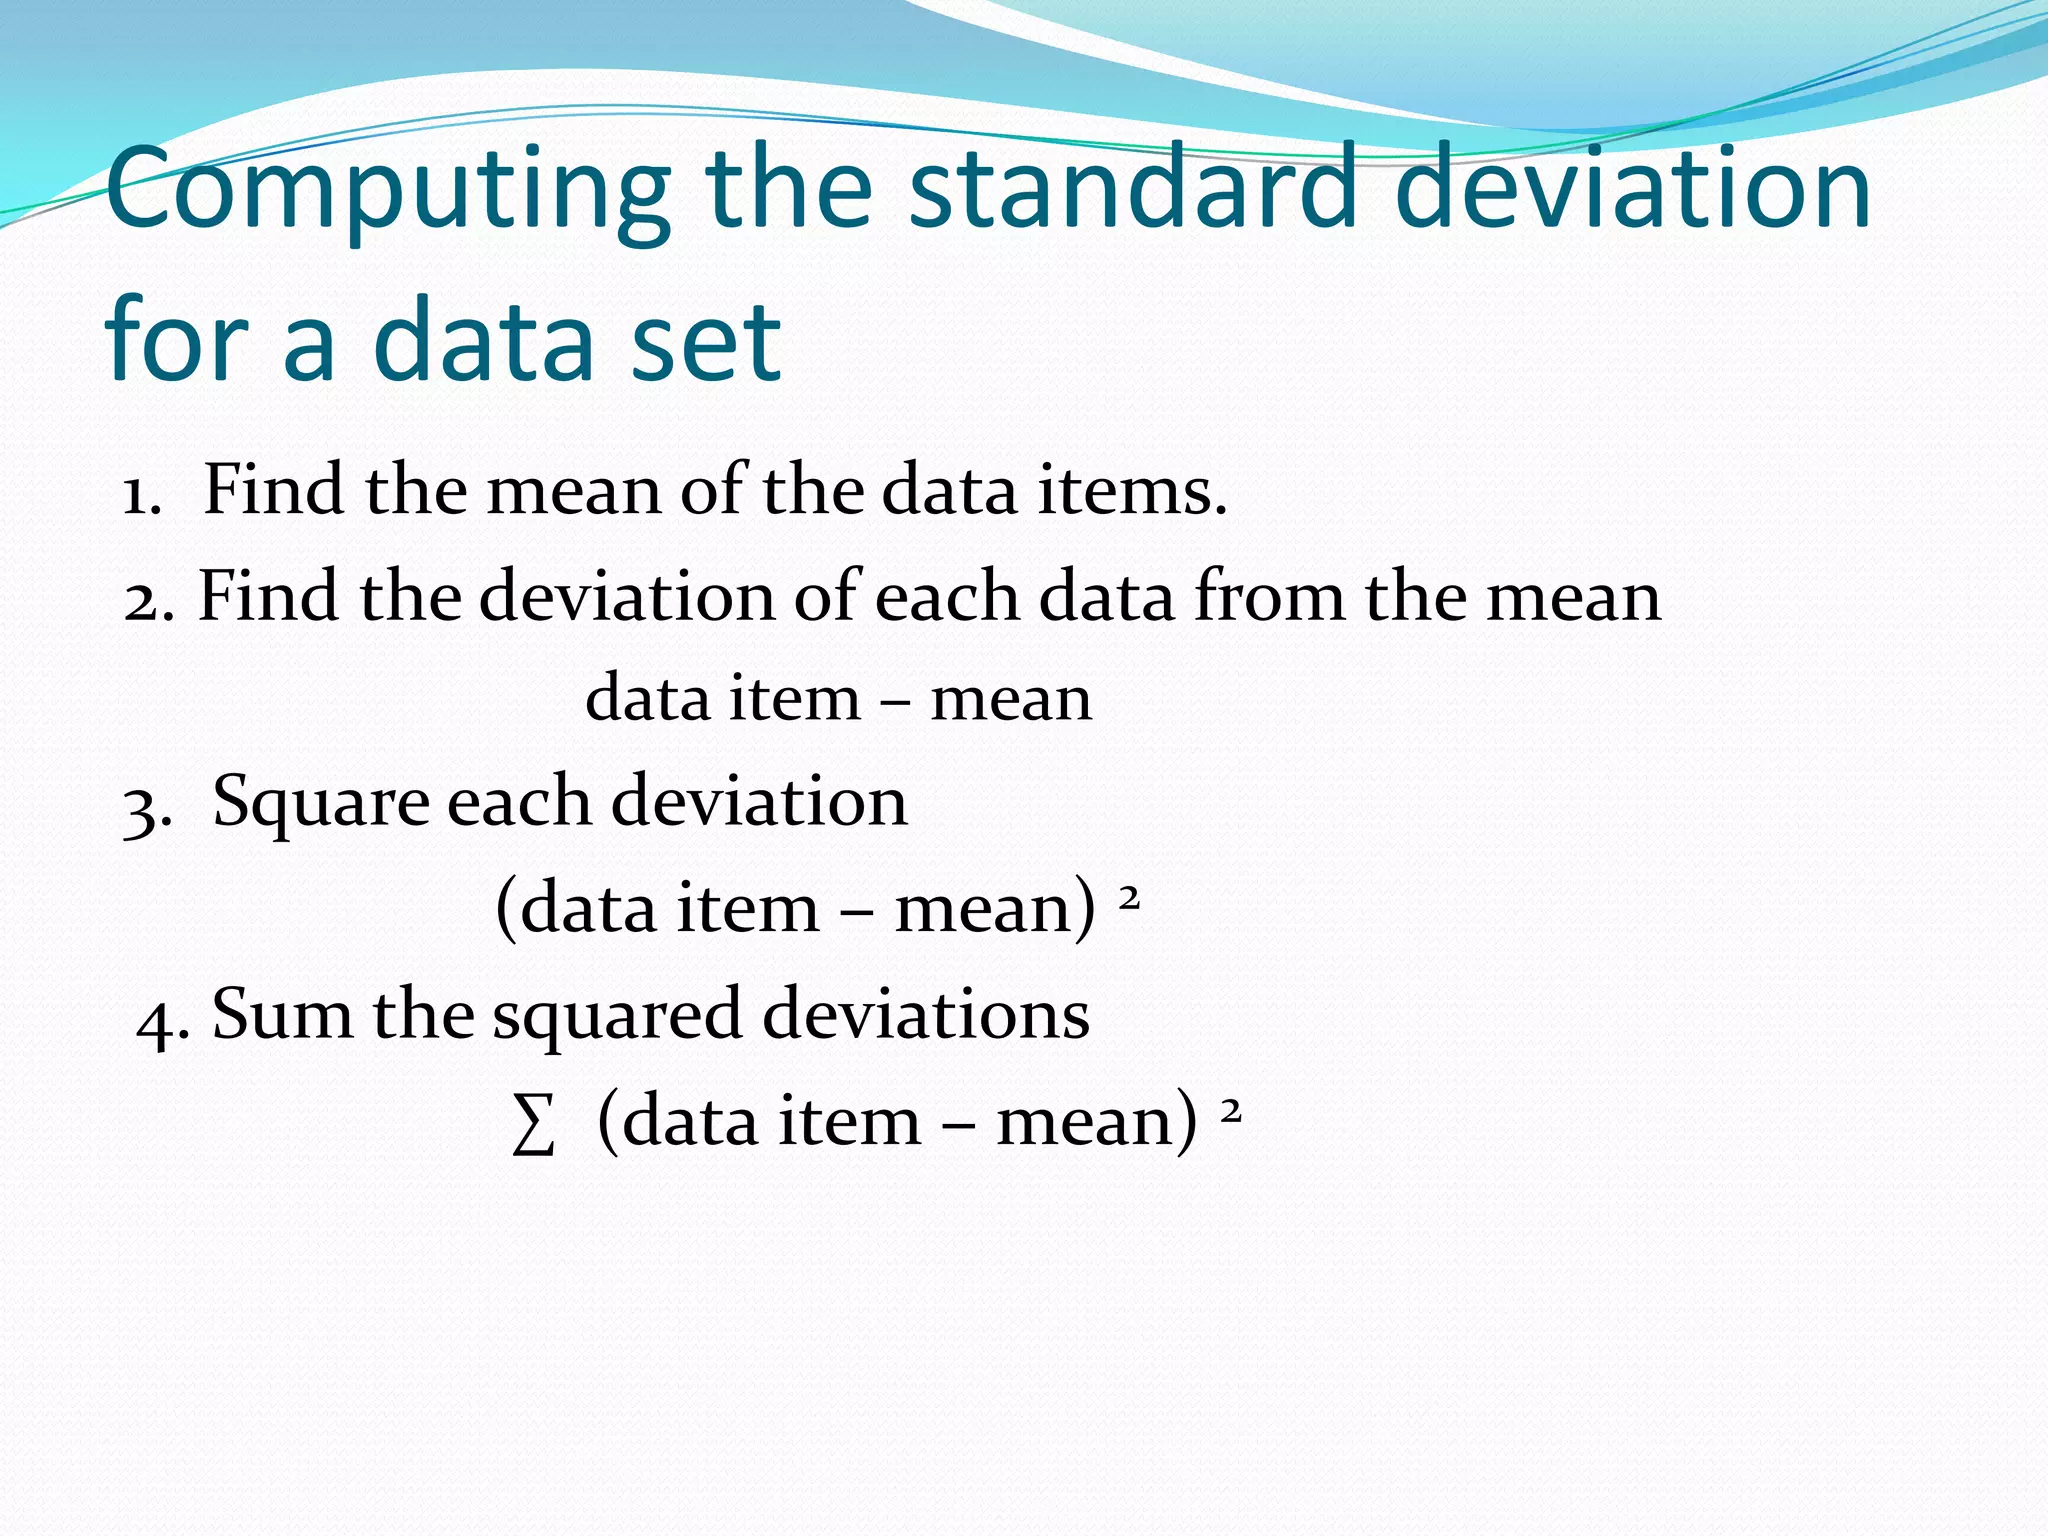
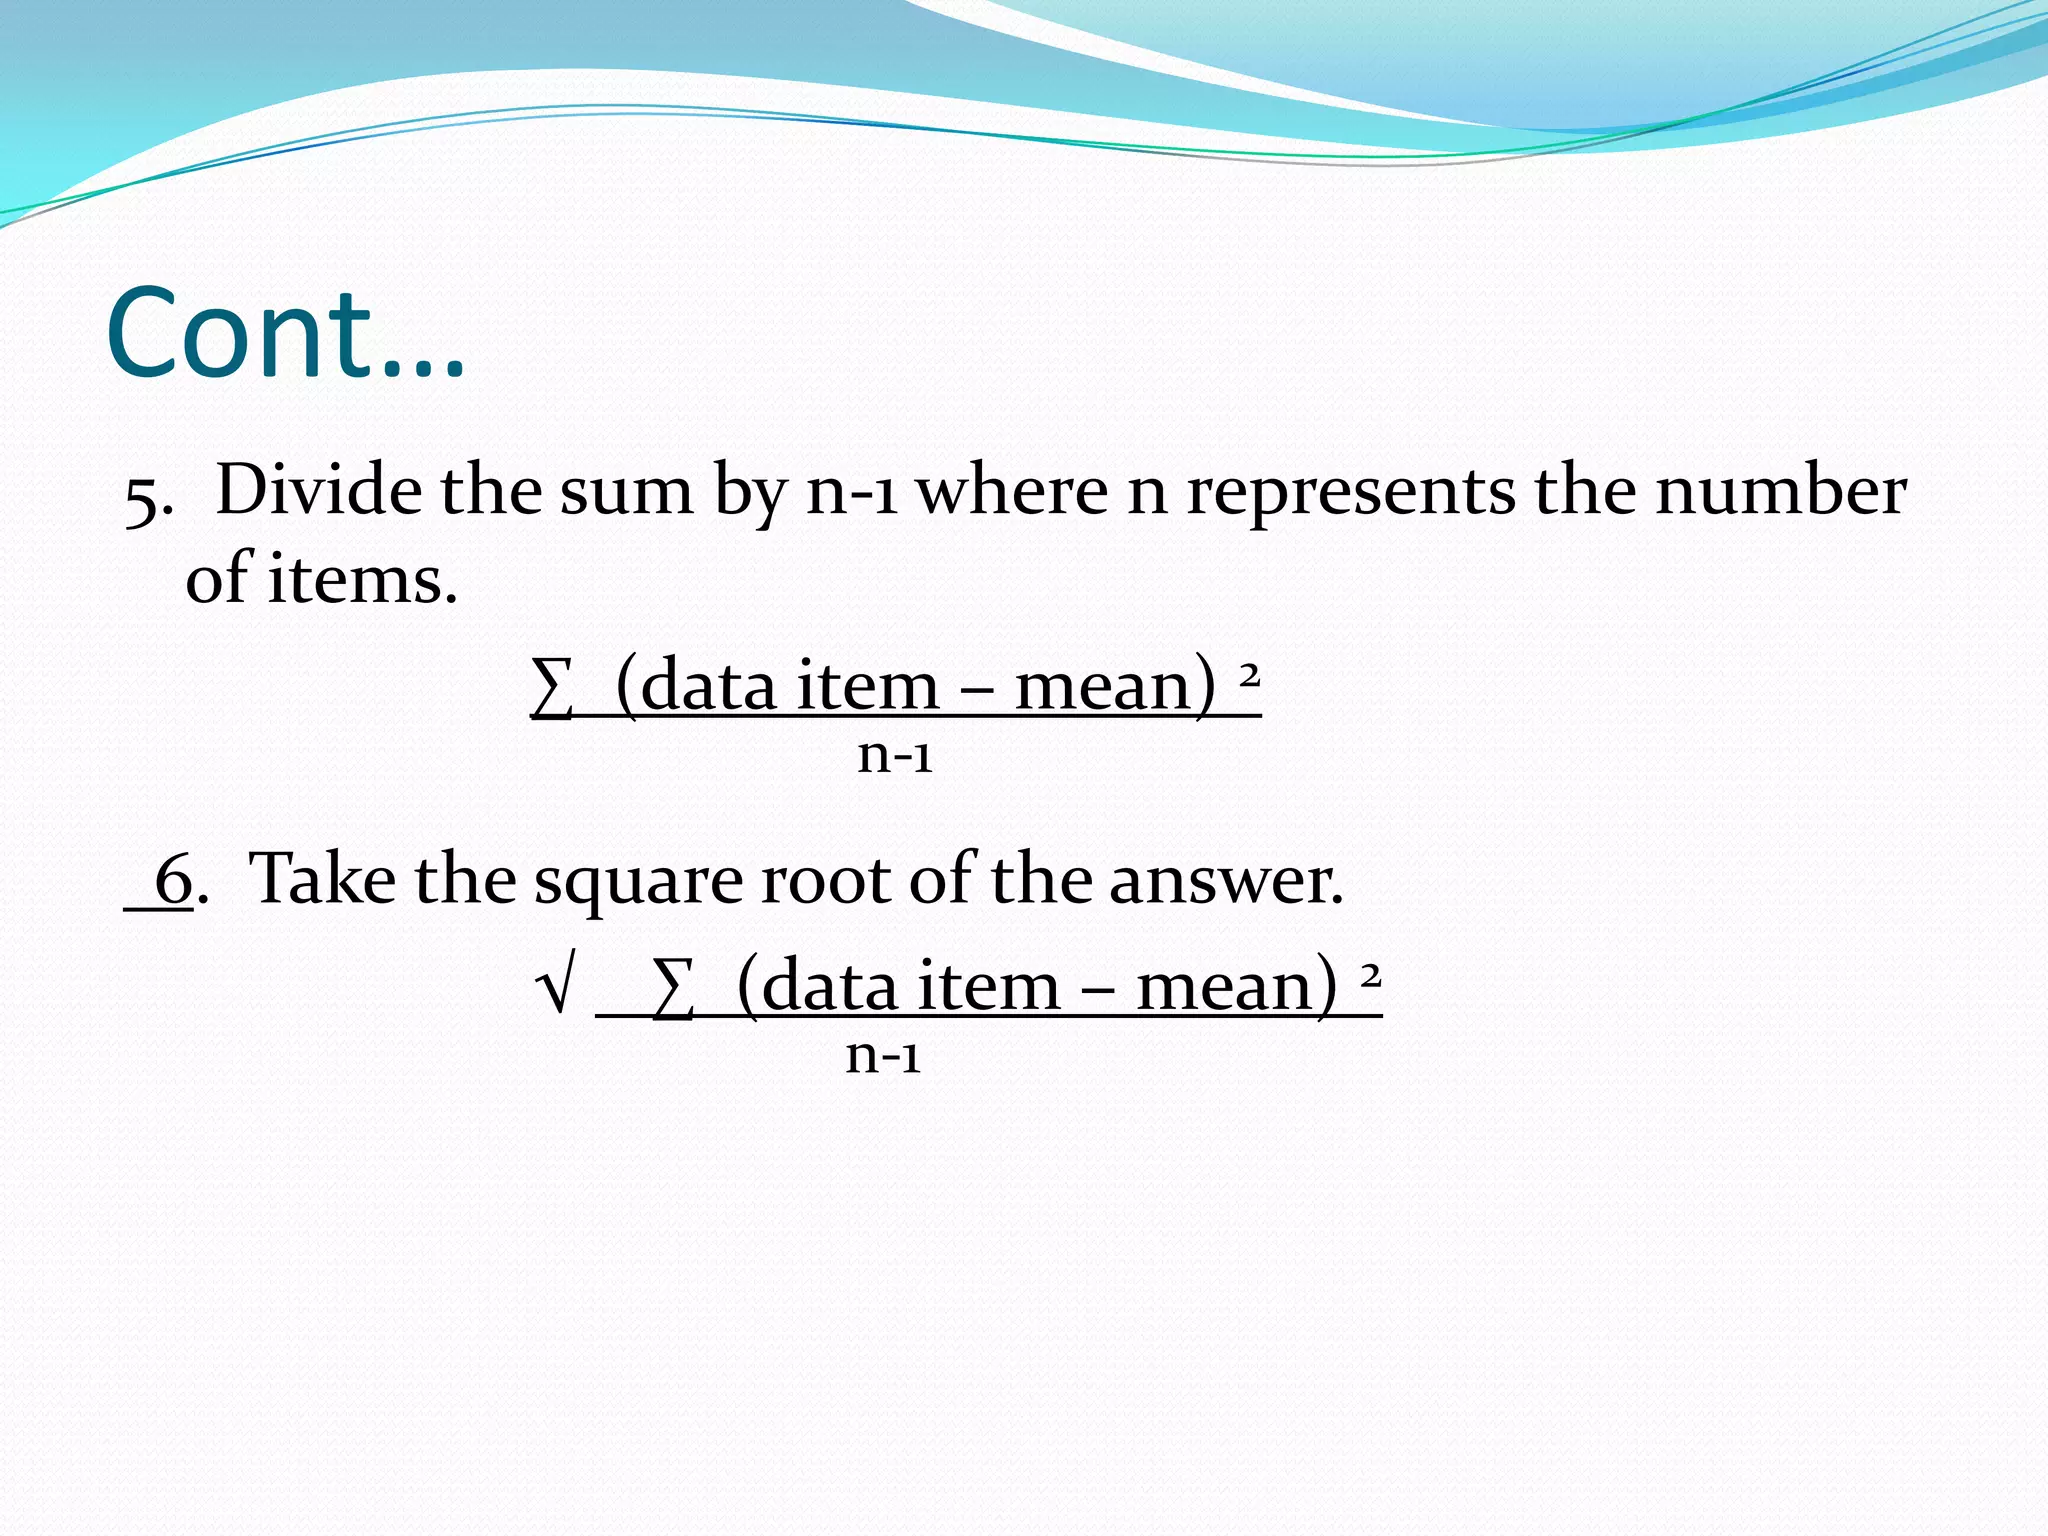

Measures of dispersion describe how spread out or clustered the data is. The range is the difference between the highest and lowest values. Standard deviation measures how far each value deviates from the mean by finding the deviations, squaring them, summing them, dividing by n-1, and taking the square root. It accounts for all data points unlike the range. To calculate standard deviation, first find the mean, then deviations from it, square those values, sum them, and divide the sum by n-1 before taking the square root.