Download to read offline


![Sectoral Strategies 29
Sectoral Strategies
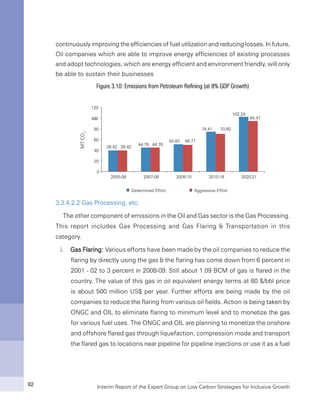
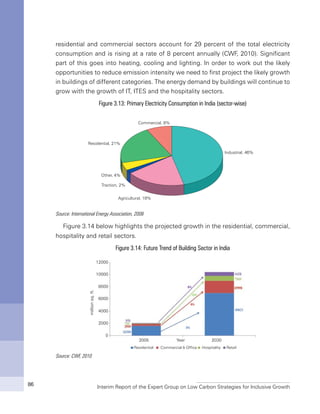
We have seen in Chapter 2 that major GHG emitting sectors are power, transport,
industries and households (including buildings both residential and commercial).
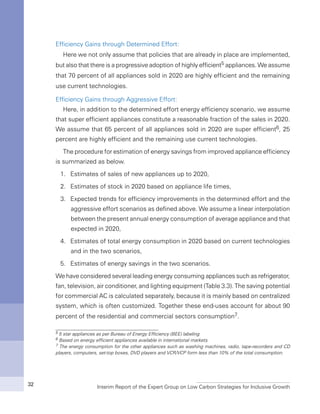
Options to reduce emissions by improving energy efficiency on the demand side
and by reducing GHG emissions on supply side are important, and offer a significant
scope for mitigation. In this chapter, we examine the options for each sector.
For each sector we make projections for two growth outcomes, namely average
real GDP growth rates of 8 and 9 percent up to 2020. And for each growth outcomes,
we give an expected range of emissions. The lower end of the emission reduction
range would henceforth be called Determined Effort Scenario; and the higher end
of this range would henceforth be called Aggressive Effort Scenario. Both of these
are defined below.
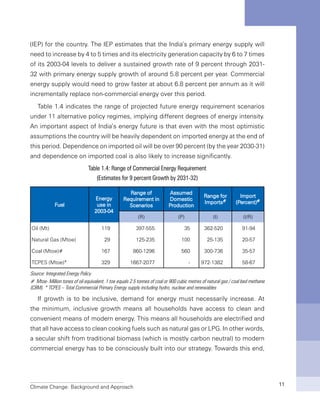
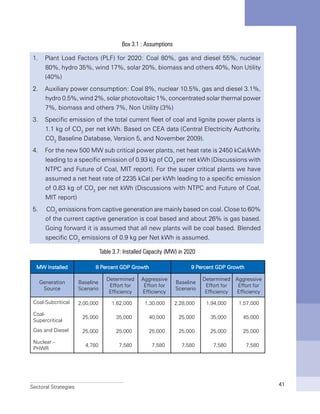
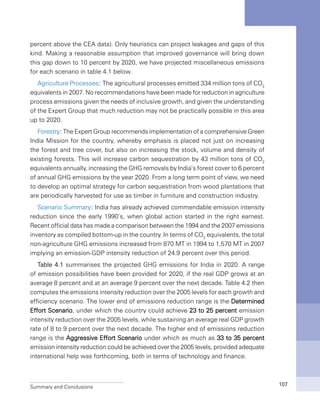
1. Determined Effort [Lower End of the Emission Reduction Range]
Determined Mitigation Effort implies policies that are already in place or
contemplated are pursued vigorously and implemented effectively up to
2020. This is by no means automatic as it requires continuous up-gradation of
technology as well as finance from both public and private sources. This also
assumes the private sector sustains its current efficiency enhancing efforts.
2. Aggressive Effort [Higher End of the Emission Reduction Range]
Aggressive Mitigation requires, in addition to the above, introduction as well
as implementation of new policies. This requires new technology as well as
additional finance. The private sector needs to scale up its efforts significantly
from the present levels. This is essentially what the Expert Group feels is the
upper limit of feasibility up to 2020. The details of policies, technology and
finance required to achieve this would be spelt out in the Final Report.
3](https://image.slidesharecdn.com/interexp-160122083810/85/Inter-exp-37-320.jpg)

![Sectoral Strategies 45
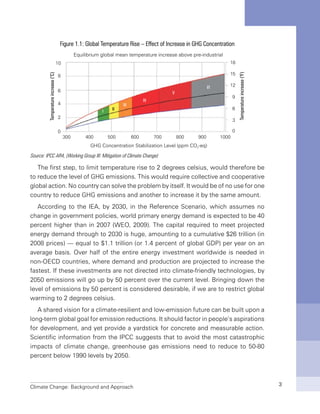
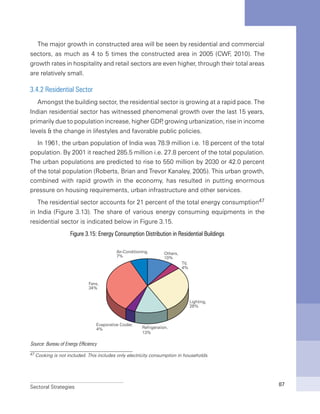
3.2 Transport Sector
3.2.1 The Scene in 2007
The transport sector is the second largest contributor to energy related GHG
emissions in India, and its share in national GHG emissions has increased from 6.4
percent to 7.5 percent between 1994 and 2007 [NATCOM 2007]. Moreover, India
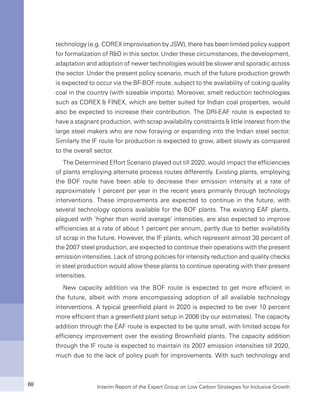
imports about 80 percent of its petroleum requirements, a significant part of which
is used for transport. The quantity of oil imported, the unit cost of oil and the share
of transport fuels (gasoline, diesel and aviation turbine fuel or ATF) in the petroleum
basket are all steadily increasing. Given the likely oil-constrained future, there is need
to lower transport’s dependence on petroleum to enhance India’s energy security
and lower its carbon footprint. This section provides an overview of the emissions
from the transport sector and suggests options to reduce GHG emissions from some
sub-sectors of the transport sector.
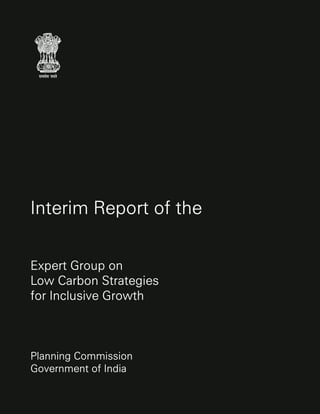
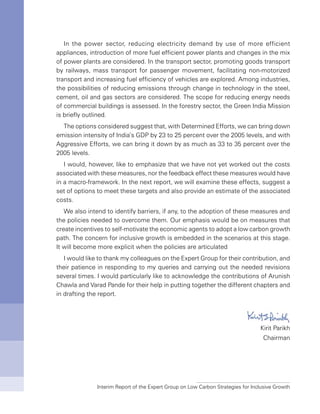
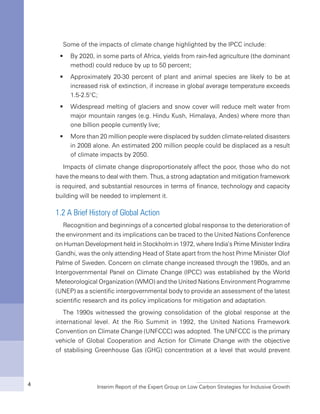
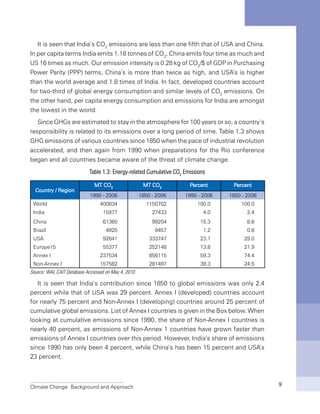
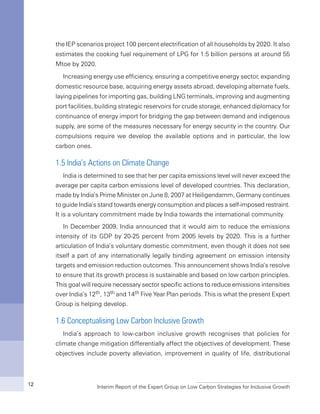
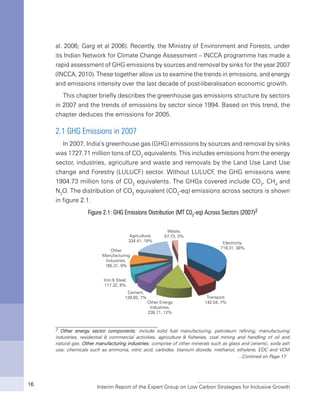
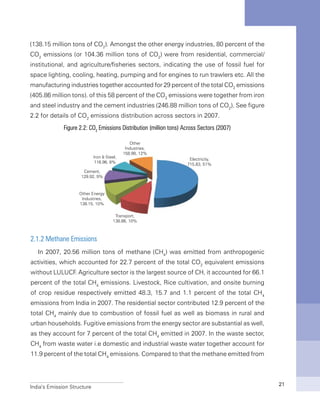
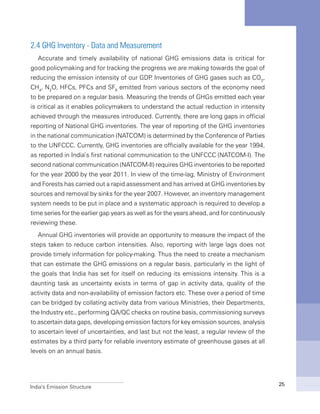
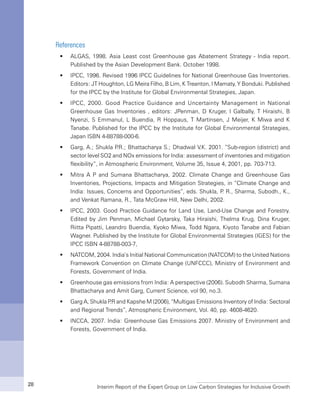
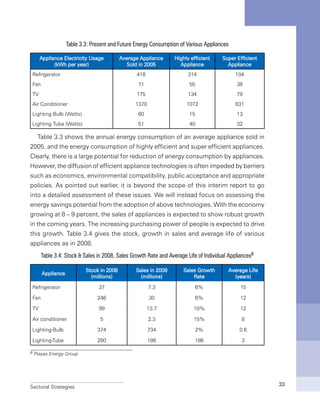
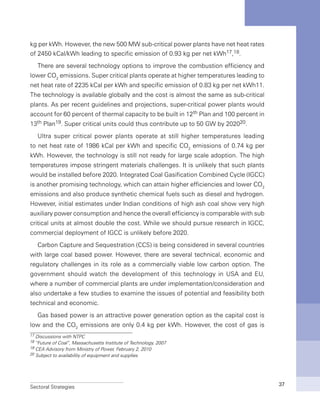
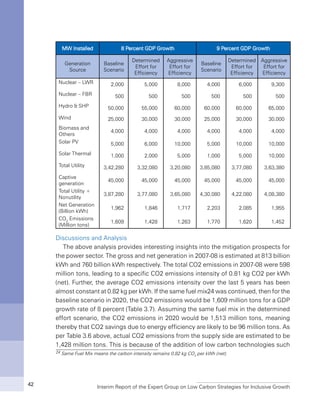
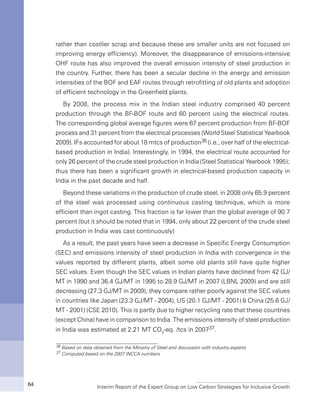
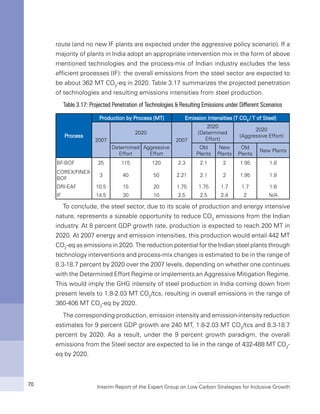
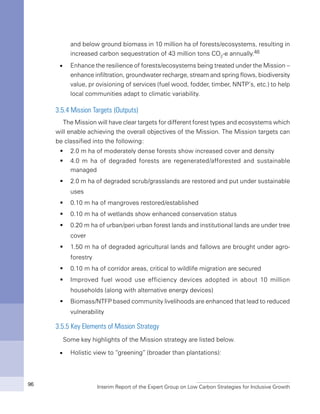
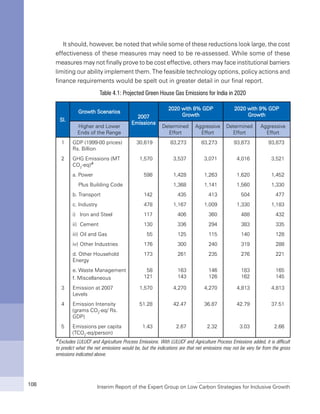
Figure 3.3 depicts the transport activity and emissions from different modes for
freight and passenger transport in the country in 2007, with passenger transport
further disassembled into urban (U) and non-urban or inter-city (IC) transport. It can be
seen that road transport activity is the most significant contributor (about 88 percent)
to emissions from the transport sector, while supporting about 60 percent of freight
activity (ton-km) and 83 percent of passenger activity (passenger-km). The aviation
sector is also important from a GHG emissions perspective since it contributes 15
percent of emissions from passenger transport (and 7 percent of the transport sector)
while supporting only 1 percent of passenger activity. In contrast, rail contributes
only 5 percent of transport sector emissions25 while supporting about 40 percent
of freight activity and 12 percent of passenger activity. Therefore, reducing GHG
emissions from transport sector would broadly require a shift away from road and
air towards rail and water (which is even more energy efficient than rail), in addition
to improving efficiencies of individual modes. Moreover, within the road passenger
sector, there is scope for improvement by increasing the shares of efficient modes
such as public and non-motorized transport.
25 See NATCOM 2007. This is based on accounting for emissions from electricity generation and use in railways
to the power sector.](https://image.slidesharecdn.com/interexp-160122083810/85/Inter-exp-53-320.jpg)
![Interim Report of the Expert Group on Low Carbon Strategies for Inclusive Growth46
3.2.2 Other Studies
[McKinsey 2009, TERI 2006] are two other reports that project India’s transport
sector activities, energy consumption and emissions, and also suggest options and
potential for GHG emission mitigation. We briefly summarize these reports here.
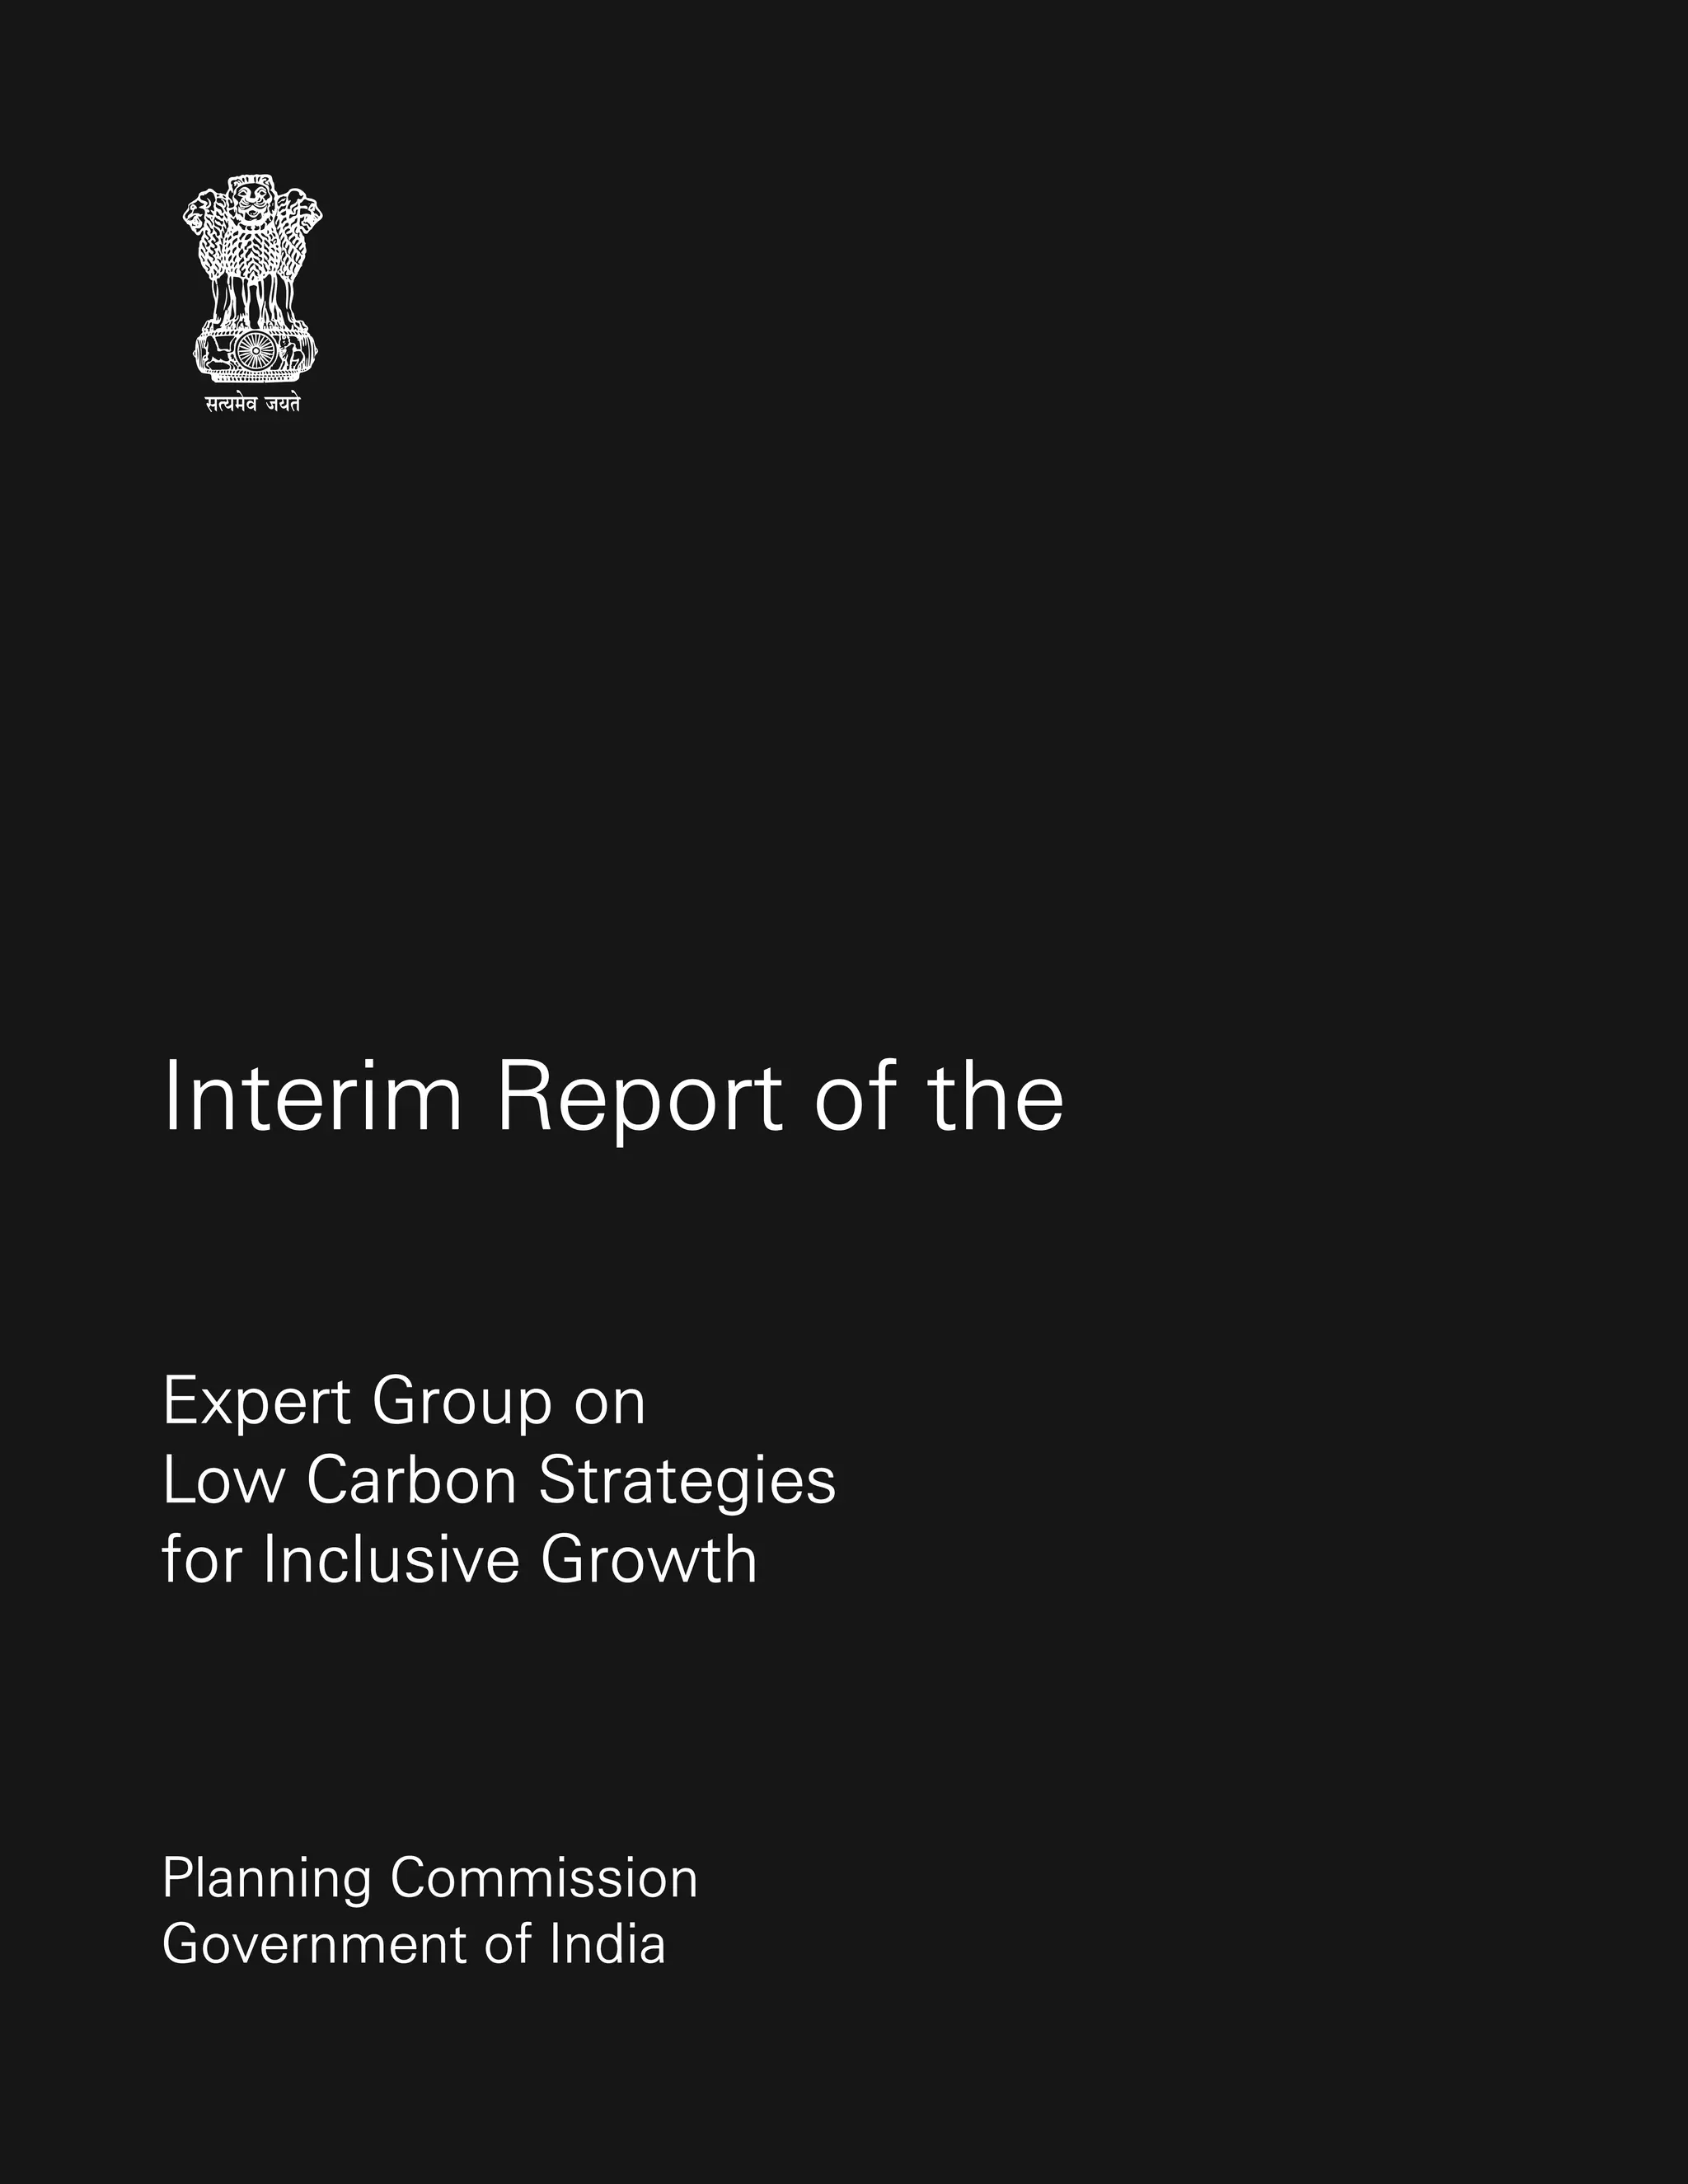
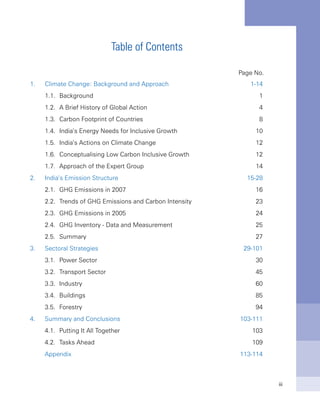
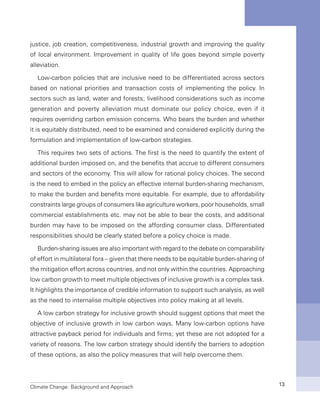
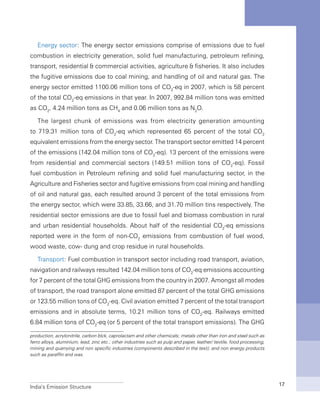
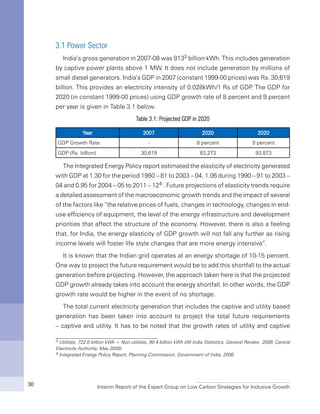
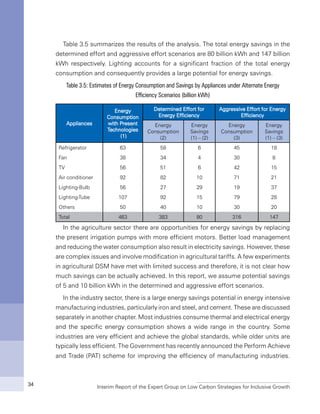
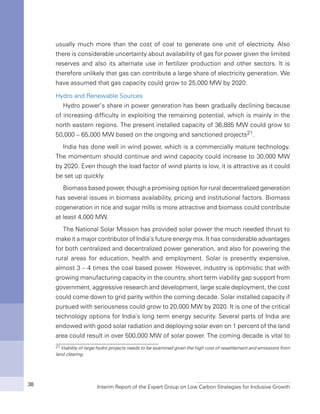
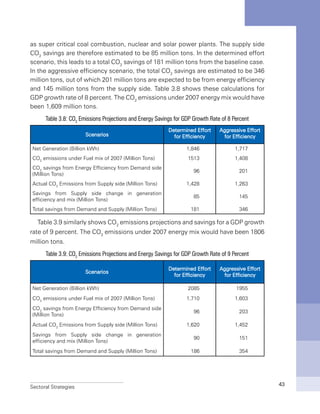
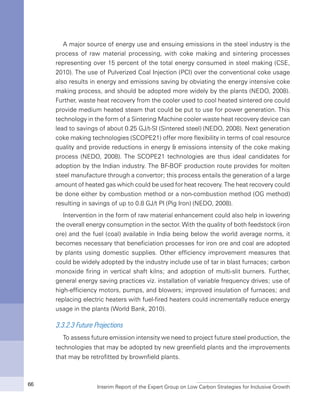
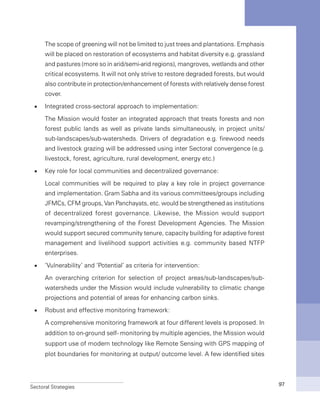
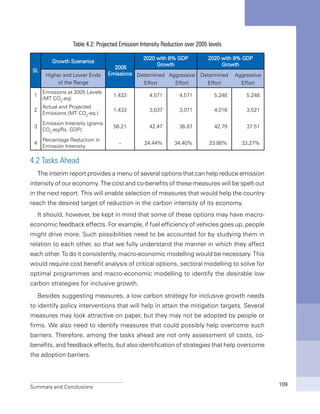
Figure 3.3: Transport Activity and CO2
Emissions in 200726
Freight Transport Passenger Transport
Source: NATCOM 2007, MORTH 2007, MOPNG 2009, WSA 2008, DGCA and Indian Railways
3.2.2.1 McKinsey Report
[McKinsey 2009] analyzes different GHG mitigation options and estimates their
costs and benefits. In the reference scenario (with GDP growth rate 7.5 percent),
it shows an emission elasticity of 0.8 for freight emissions and 0.93 for passenger
emissions up to 2030. The mitigation options suggested in this report are:
1. Improving vehicle efficiency.
2. Shifting freight transport from road to railways and waterways.
3. Shifting passenger transport to public transport.
26 NM-U: Non-motorized (Urban transport), Public-U: Public Transport (Urban transport), Private-U: Private mo-
torized transport (Urban transport), Rail-IC: Railway (inter-city), Road-IC: Road (inter-city), Air-IC: Air (inter-city).
Please see the appendix for details about the numbers in this graph.](https://image.slidesharecdn.com/interexp-160122083810/85/Inter-exp-54-320.jpg)
![Sectoral Strategies 47
4. Shifting vehicles to electric and hybrid varieties.
5. Greater penetration of biodiesel.
The report predicts a possible 24 percent reduction of transport sector emissions
by 2030 based on these options.
3.2.2.2 TERI Report
This report is not focused so much on GHG mitigation as to map energy requirements
and suggest options to minimize energy consumption for various sectors including
transport. It predicts transport activity in future under different GDP growth scenarios
of 8 percent and 10 percent, based on parameters such as urbanization rate, industrial
and agricultural GDP growth, and vehicle stock increase rates. This report predicts
elasticity between 1.11 and 1.18 for freight and 0.68 to 0.77 for passenger transport.
This again varies significantly from available official data. The energy saving (and
hence GHG mitigation) options suggested by the study include:
1. Increasing the share of public transport to 60 percent and share of rail in
passenger transport to 35 percent
2. Increasing the share rail in freight movement to 50 percent
3. Increasing efficiency of vehicles
4. Introducing cleaner fuels
5. Increasing electrification of railway tracks
These two reports, as well as reports by IEA and Chella Rajan, predict that the bulk of
the increase in energy consumption and GHG emissions is going to be from trucks,
cars and motorized two wheelers or MTWs [IEA 2007, Chella Rajan 2010]. The two
reports are also in broad agreement over the policy recommendations to mitigate
the situation.
3.2.3 Methodology
The long-term (1990 - 2005) elasticity of freight activity to national GDP was around
1.2, while the recent (2000 - 05) elasticity has been about 0.92. On the other hand,
the long-term elasticity of passenger transport activity to national GDP was around](https://image.slidesharecdn.com/interexp-160122083810/85/Inter-exp-55-320.jpg)
![Interim Report of the Expert Group on Low Carbon Strategies for Inclusive Growth48
1.76, though the recent elasticity has been around 2.0. This increase in passenger
transport activity is driven by rising incomes (and hence more motorized trips per-
capita) and a huge increase in air passenger traffic. We believe this explosive rate
of growth of passenger transport activity will reduce because oil prices are likely
to remain high, and because the recent demand spurt has perhaps captured most
latent travel demand that was awaiting improved road and air connectivity. Therefore,
going forward, we assume freight transport activity elasticity to be 1.0 and passenger
transport activity elasticity to be 1.5.
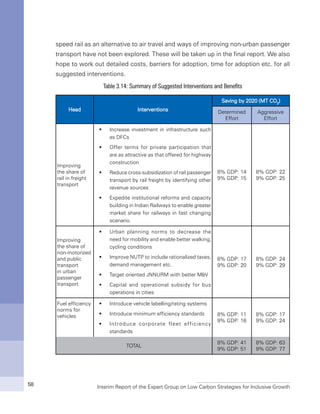
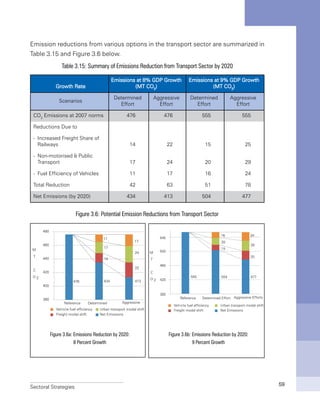
Under these assumptions, the CO2
emissions from transport in 2020 would be
about 476 million tons under 8 percent GDP growth scenario 555 million tons under
9 percent GDP growth in the reference scenario (under which efficiencies and modal
shares are unchanged).
3.2.4 Strategy to Reduce Energy Consumption and Emissions
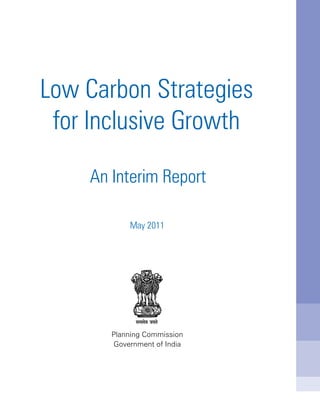
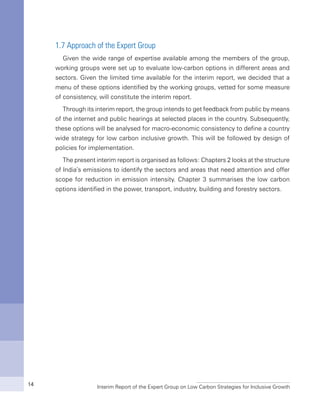
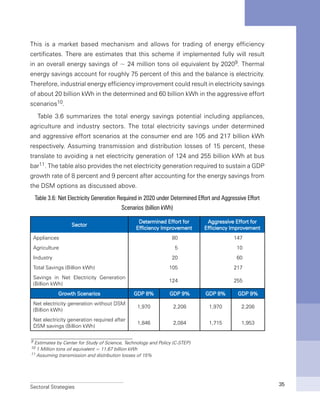
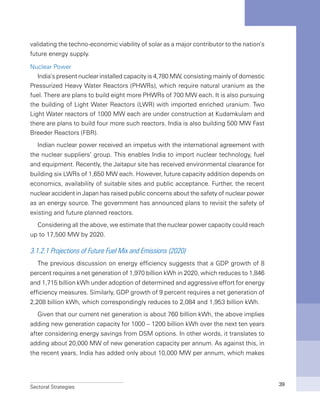
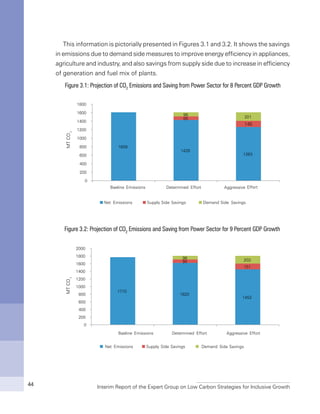
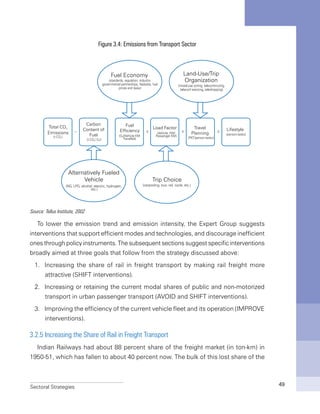
The strategy adopted to reduce emissions from the transport sector is best
described as the avoid-shift-improve paradigm27 which is also described pictorially
in Figure 3.4. The elements of this paradigm can broadly be described as follows:
a) Avoid: This element involves designing systems to reduce the need for transport
through policies to locate industries so as to minimize movement of raw
materials and finished products, and urban planning to minimize commuting
needs. These interventions typically impact the right of Figure 3.4.
b) Shift: This element emphasizes the usage of more (carbon) efficient modes
of transport. These interventions would typically impact the middle of Figure
3.4.
c) Improve: The focus of this element is to use the most carbon efficient
technologies given a mode of transport. These interventions would typically
impact the left of Figure 3.4.
27 See for example, Changing course: A new paradigm for sustainable urban transport, Asian Development
Bank 2009; and [Sundar 2008].](https://image.slidesharecdn.com/interexp-160122083810/85/Inter-exp-56-320.jpg)
![Interim Report of the Expert Group on Low Carbon Strategies for Inclusive Growth52
3.2.5.1 Improving the Efficiency of Road Freight
In addition to enabling railways to carry more freight, there is also a need to
investigate how road freight efficiency can be improved. India offers highly competitive,
low-cost road freight services. However, there is considerable room for improvement
in its operational efficiencies. Possible reasons for this include sub-optimal utilization
rates of trucks, inefficient border crossing and toll regimes, lack of hub-and-spoke like
arrangements for efficient dispersal of heavy loads onto smaller trucks for last mile
connectivity, and excess trucking capacity. The industry also needs to move towards
more multi-axle and tractor-trailer trucks.
These issues need to be further investigated to identify the key bottlenecks to
improvement of road freight efficiency and suggest solutions to overcome them.
3.2.6 Urban Transport: Promoting Public and Non-Motorized Transport
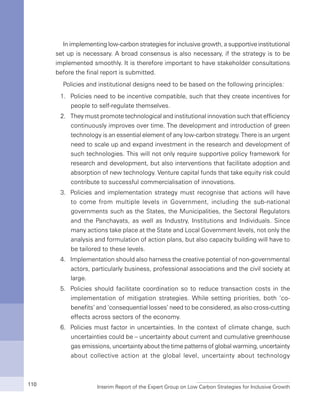
In the reference scenario, we apply the passenger transport elasticity of 1.5 to
project urban passenger transport activity30 and use predicted modal shares as given
in [WSA 2008] (see Table 3.11). As can be seen, the shares of non-motorized and
public transport decrease gradually while the shares of cars and MTWs increase in
the reference scenario. Apart from resulting in increasing energy consumption and
emissions per passenger-km travelled, this also leaves out the disadvantaged who
cannot afford vehicles and increases the possibility of accidents on the road. This is
a consequence of the neglect of non-motorized transport and the inability of public
transport to keep up with rising urbanization, and higher incomes facilitating increased
motorization.
WSA [2008] states that between 60 to 90 percent of CO2
emissions in India’s urban
areas come from cars and MTWs. This is corroborated by Sperling [2004] (which is
quoted in the IPCC 2007 report), according to which the emissions per passenger-
km of buses are lower than those for cars and MTWs. It must also be kept in mind
that non-motorized transport (walking, cycling, cycle-rickshaws etc.) has no direct
GHG emissions at all, while these modes currently support about 39 percent of trips
in urban India.
30 Note that urban passenger activity as projected by [WSA 2008] increases at roughly 5% a year until 2030. This
is surprisingly low considering national passenger transport activity data from MORTH indicates that passenger
activity has been growing at about 15% p.a, and urban transport activity is likely to increase at least as fast as
national passenger activity. Hence, we use the elasticity of 1.5 for urban passenger transport also.](https://image.slidesharecdn.com/interexp-160122083810/85/Inter-exp-60-320.jpg)
![Sectoral Strategies 53
Therefore, though Indian cities currently have reasonably good shares of public and
non-motorized transport, the challenge is to retain and improve their modal shares in
the face of current trends. Many cities in Europe (e.g. Amsterdam and Copenhagen)
with high car ownership took specific steps to prioritize bicycling as a mode, which
has resulted in bicycling now contributing to over 30 percent of trips. This shows that
policies and actions promoting such modes can induce a modal shift.
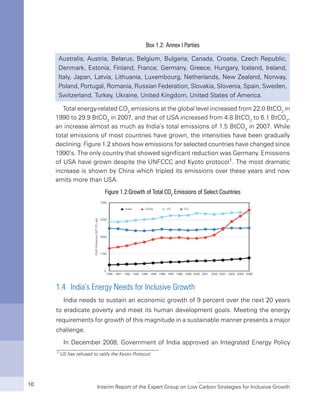
Table 3.11: Decreasing Shares (percent) of Public and Non-motorized Transport
City Category
No. of
Cities
Population
(lakhs)
2007 2011 2021 2031
PT13 PV+
IPT
NMT PT
PV+
IPT
NMT PT
PV+
IPT
NMT PT
PV+
IPT
NMT
Category 1-a
4305 1385.3
5 57 38 4 59 36 3 66 31 2 72 26
Category 1-b 8 34 58 7 37 56 5 47 48 3 57 40
Category 2 35 247.9 9 39 53 8 42 50 6 51 43 5 58 36
Category 3 25 323.8 13 43 44 12 46 43 10 52 38 9 57 34
Category 4 5 128.5 10 47 43 9 49 42 8 51 41 8 52 40
Category 5 4 235.3 22 42 36 21 45 35 15 51 34 12 54 34
Category 6 4 549.2 46 24 30 42 28 30 31 40 29 26 46 28
Source: WSA 2008
The interventions suggested in this regard are32:
1. Use policies such as National Urban Housing and Habitat Policy to ensure that
cities remain dense and of mixed land-use with adequate provisions for housing
for the poor to ensure that their travel distances remain small.
2. Develop urban planning guidelines to encourage transit-oriented development,
discourage sprawl, rationalize parking policies and charges, and mandate public
transport accessibility indicators for large developments, institute intelligent
transport systems to enable schemes such as congestion charging.
31 PT: Public transport; PV: Private motorized vehicles; IPT: Intermediate public transport; NMT: Non-motorized
transport
32 These are largely adapted from [Tiwari 2010]](https://image.slidesharecdn.com/interexp-160122083810/85/Inter-exp-61-320.jpg)
![Interim Report of the Expert Group on Low Carbon Strategies for Inclusive Growth54
3. Improve the National Urban Transport Policy (NUTP) by introducing elements
such as demand management, rational transport pricing and clear definition of
the role for Urban Mass Transport Authority.
4. Improve the JNNURM scheme by improving its Monitoring & Verification
mechanisms to ensure that projects are NUTP-compliant, modal shares of public
and non-motorized transport are actually improving in cities and infrastructure
is friendly for non-motorized transport.
5. Incentivize bus operations in cities by providing capital subsidy and reimbursing
taxes and duties paid on fuel.
These interventions will have to be implemented at the central, state and city levels
given that various agencies are involved in governing the transport sector. The National
Mission on Sustainable Habitat, one of the missions under the National Action Plan
on Climate Change, also addresses the issue of de-carbonizing urban transport.
We estimate the range of CO2
emission savings33 in 2020 that can result from
the above interventions in the determined and aggressive effort scenarios. In the
determined effort scenario, we assume that, compared to the expected modal shares
in 2020, public transport share increases by 5.5 percent (3 percent from MTWs and
2.5 percent from cars) and non-motorized transport share increases by 3 percent (1.5
percent each from MTWs and cars). In the aggressive effort scenario, we assume that
public transport share in 2020 increases by 8 percent (4 percent each from MTWs
and cars) and non-motorized transport share increases by 4 percent (2 percent each
from MTWs and cars)34. The resultant savings in CO2
emissions and oil imports are
given in table 3.12.
Table 3.12: Annual Savings from Passenger Transport Modal Shift
GDP
Growth
Determined Effort Aggressive Effort
MT CO2
Savings
Import (Rs. ‘000 Cr.)
Savings
MT CO2
Savings
Import (Rs. ‘000 Cr.)
Savings
8% 17 10 24 15
9% 20 12 29 18
33 Modal share data for 2020 is used from WSA [2008]. Further, for the reference scenario, we assume no
technology change in this period and compute emissions using the values given in table 3.16.
34 The shifts are assumed to begin in 2012. Note that in spite of these shifts, the share of MTW in 2020 is 18%
and 17% in the determined and aggressive scenarios respectively compared to its current share of 20%. The
modal share of cars increases from a current share of 6% to 11% and 9% respectively.](https://image.slidesharecdn.com/interexp-160122083810/85/Inter-exp-62-320.jpg)
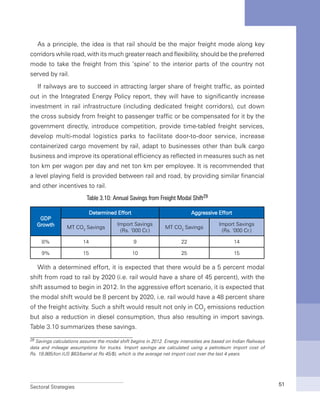
![Interim Report of the Expert Group on Low Carbon Strategies for Inclusive Growth56
percent improvement in specific fuel consumption per year in the aggressive effort
scenario35, this translates to CO2
savings as given in table 3.13.
Table 3.13: Annual CO2
Savings from Introducing Fuel Efficiency Norms
GDP growth
Savings (MT CO2
)
Determined Effort Aggressive Effort
8% 11 17
9% 16 24
Additionally, some options to modernize the vehicle fleet in the country by replacing
older vehicles with newer ones (with better technology and lower emissions) were
considered. These included incentives to owners of commercial vehicles older than
15 years to modernize their fleet, encourage owners of private vehicles older than
15 years to replace their vehicles through a suitable tax regime, a vehicle recycling
policy and drastic improvement in the inspection and certification regime. However,
these were expected to only yield a one-time saving of about 1 MT CO2
(by 2015)
after replacing about 3 million vehicles. Hence this is not being considered further
in the report.
3.2.8 Co-Benefits
The interventions suggested above for the transport sector have many other
socio-economic impacts whose benefits are likely to be greater than any directly
climate-related benefits.
1. Inclusive Growth: The interventions for improvement of public and non-motorized
transport will make them more attractive and accessible to the poorer sections
of society who are the major users of these modes [Badami 2004]. It will also
improve productivity (due to reduced congestion) and safety on the road.
2. Air Pollution: Increased use of rail freight, non-motorized and public transport
modes and introduction of cleaner vehicles and fuels will also contribute greatly
to reduced air pollution in our cities.
3. Energy Security: The suggested interventions will lead to reduced fuel
consumption, in turn, improving India’s energy security since most of the
35 This is roughly in line with international fuel consumption or emission standards [ICCT 2011]](https://image.slidesharecdn.com/interexp-160122083810/85/Inter-exp-64-320.jpg)
![Interim Report of the Expert Group on Low Carbon Strategies for Inclusive Growth60
Appendix
This appendix explains the numbers shown in Figure 3.3. Transport activity data is
taken from [MORTH 2007] while fuel consumption data is taken from [MOPNG 2009,
NATCOM 2007]. Urban transport activity is taken from [WSA 2008] and emissions
from urban transport are calculated using the assumptions for the vehicle stock in
2007 as given in Table 3.16. We have also classified all rail passenger transport as
inter-city though some rail travel is also intra-city. Emissions from electricity used
in railways are not accounted here, as [NATCOM 2007] accounts for this under the
electricity sector.
Table 3.16: Vehicle Efficiency Assumptions
Parameter Buses Two-wheelers Cars Three-wheelers
Mileage (kmpl) 3.5 50 10 25
Occupancy 42 1.5 2 1.8
Reconciling official transport activity data with official fuel consumption data
indicates vehicle fuel efficiencies that are perhaps on the higher side. However,
Figure 3.3 uses official numbers as given, which results in inter-city road transport’s
emission share being shown as being smaller than its activity share since the activity
and emissions for this category is calculated as the difference between overall road-
based activity/emissions and sum of the other road passenger activity/emissions. In
reality, its share of emissions is likely to be higher than its share of activity.
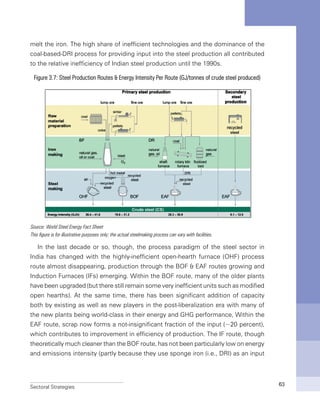
3.3 Industry
3.3.1 Introduction
Industry accounts for nearly one-third of global energy usage while contributing
almost 40 percent to global GHG emissions. With over 35 percent of total energy
consumption in the country, the Indian industry is particularly energy & emissions
intensive consuming about 6300 PJ energy in 2007 including electricity used by it
(LBNL 2009). This represents the second-largest share in the final energy usage
after the residential sector. With this energy share the industry sector contributed
29 percent towards the GDP in 2009 (MOSPI, 2011). The Indian industry energy mix
is dominated by coal and oil with these two energy sources contributing over half](https://image.slidesharecdn.com/interexp-160122083810/85/Inter-exp-68-320.jpg)


![Sectoral Strategies 89
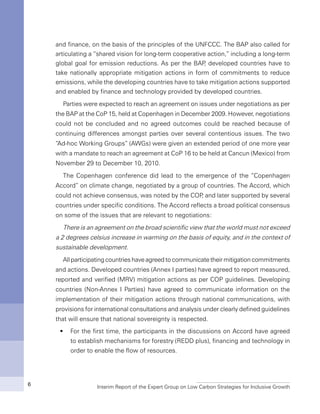
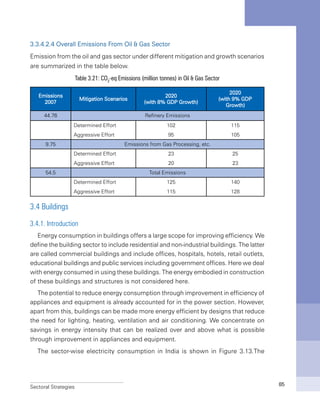
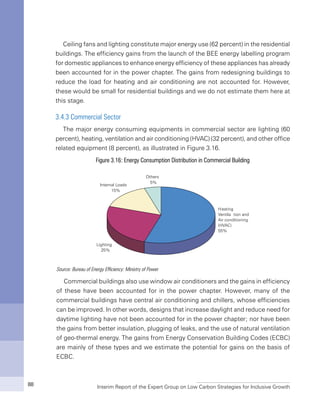
3.4.4 Present Codes and Standards
Codes and Standards as determined by policy can significantly enable the reduction
of CO2
emissions in the building sector. The country has done well in developing
various standards like National Building Code (NBC), Energy Conservation Building
Codes (ECBC), Bureau of Energy Efficiency rating programs for appliances and the
more recent energy rating program for the existing buildings. The market-driven
voluntary Green Building Rating Programs have significantly transformed the way
buildings are designed. Green buildings have the potential to save 40 to 50 percent
energy vis-à-vis the conventional practices.
Some of the widely used building codes in India are discussed below.
3.4.4.1 Energy Conservation Building Code
Energy Conservation Building Codes, formally launched in May 2005, specifies
the energy performance requirements of commercial buildings in India. ECBC has
been developed by the Bureau of Energy Efficiency (BEE) and has been mandated
by the Energy Conservation Act 2001. The code covers buildings with a connected
electrical load of 500 kW or more.
The purpose of this code is to provide minimum requirements for the energy-
efficient design and construction of buildings. It is planned that the code shall be
mandatory for commercial buildings or building complexes.The Bureau of Energy
Efficiency is the primary body responsible for implementing the ECBC; and it works
towards policy formulation as well as technical support for the development of the
codes and standards and their supporting compliance tools and procedures.
3.4.4.2 Green Building Rating Systems
Green building rating systems have come to India in a big way. Major green building
rating systems currently operating in India are:
Indian Green Building Council (IGBC) programmes - LEED India New Construction,ƒƒ
LEED India Core and Shell, IGBC Green Homes, IGBC Green Factory Building,
IGBC Green SEZ *, IGBC Green Cities* [*under development]
TERI – GRIHAƒƒ
Eco housingƒƒ
47 Cooking is not included. This includes only electricity consumption in households.](https://image.slidesharecdn.com/interexp-160122083810/85/Inter-exp-97-320.jpg)
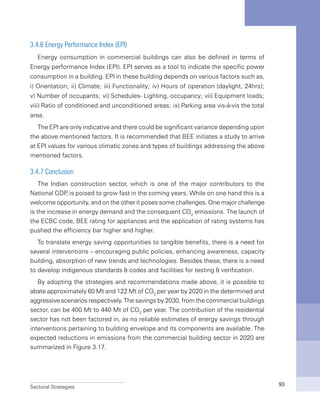
![Sectoral Strategies 99
3.5.8 Sequestration and Emission Neutralization
The Mission would increase above and below ground biomass in 10 million ha
of forests and other ecosystems resulting in increased carbon sequestration of 43
million tons CO2
equivalents annually in the year 2020. This will neutralize an additional
1.5 percent of India’s annual GHG emissions in 2020, taking GHG removal by India’s
forests in 2020 to 6.35 percent.
Most of carbon sequestration takes place during the period of growth of trees
and mature forests sequester small amounts if any. Thus for sequestration through
forests an optimal strategy should examine the [possibilities of fast growing trees,
periodically harvested and locking up the captured carbon in furniture and buildings
or burnt to generate power replacing coal.
References
[Badami 2004] Access and mobility for the urban poor in India: Bridging the gap betweenƒƒ
policy and needs, M. Badami, G. Tiwari, D. Mohan, Forum on Urban Infrastructure and
Public Service Delivery for the urban poor, New Delhi, June 2004
[BEE 2009] “Study Report for Establishment of the Specific Energy Consumption Normsƒƒ
for the Iron & Steel Industry Cluster”, 2009.
[Chella Rajan 2010] Transport and Energy scenarios for India, submission by Prof.ƒƒ
Sudhir Chella Rajan (Professor and Coordinator, Indo-German Centre for Sustainability,
IIT Madras) to the Working Group on Transport, April 2010
[Cement Technology Roadmap 2009] IEA – WBSCD, “Carbon technology roadmap 2009:ƒƒ
Carbon emissions reductions up to 2050”.
[CMA 2009] Data from Cement Manufacturers Association: http://www.cmaindia.org/ƒƒ
industry.html
[CSE 2010] Center for Science and Environment (Chandra Bhushan), “Challenge of theƒƒ
New Balance,” New Delhi, 2010.
[CSI/ECRA, 2009] CSI-ECRA – Technology papers, “Development of state of the artƒƒ
techniques in cement manufacturing: trying to look ahead”, June 2009.](https://image.slidesharecdn.com/interexp-160122083810/85/Inter-exp-107-320.jpg)
![Interim Report of the Expert Group on Low Carbon Strategies for Inclusive Growth100
[CWF April 2010] Reducing GHG Emissions in the Building Sector in India: A Strategyƒƒ
Paper, Climate works foundation, India
[ICCT 2011] Global passenger car: fuel economy and greenhouse gas emissionƒƒ
standards, International Council on Clean Transportation, January 2011 update
[IEA 2007]ƒƒ World Energy Outlook, International Energy Agency, 2007
[IEA 2009] IEA Gielen et al. “Energy Transition for Indian Industry”, 2009ƒƒ
[INCCA 2010] Ministry of Environment and Forests, “India: Greenhouse Gas Emissionsƒƒ
2007,” New Delhi, 2010.
[IRADe/ICF/CCAP,2009] (Integrated Research and Action for Development (IRADe)/ICFƒƒ
International/ Center for Clean Air Policy (2009). Analysis of GHG Emissions for Major
Sectors in India: Opportunities and Strategies for Mitigation
[JPC, 2010] Data provided by the Joint Plant Committee, Kolkata in August 2010.ƒƒ
[LBNL 1998] Lawrence Berkeley National Laboratory Report (Katja Schumacher andƒƒ
Jayant Sathaye) “India’s Iron and Steel Industry: Productivity, Energy Efficiency and
Carbon Emissions,” Berkeley, CA, 1998.
[LBNL 2009] Lawrence Berkeley National Laboratory Report (Stephane de la Rue duƒƒ
Can, Michael McNeil, and Jayant Sathaye) “India Energy Outlook: End Use Demand in
India to 2020,” Berkeley, CA, 2009.
[MOPNG 2009]ƒƒ Basic Statistics on Indian Petroleum and Natural Gas 2008-09, Ministry
of Petroleum and Natural Gas, Government of India
[McKinsey 2009] McKinsey and Co, “Energy and Environmental Sustainability: Anƒƒ
Approach for India” New Delhi, 2009.
[MORTH 2007] Ministry of Road Transport and Highways, Year book 2006-07ƒƒ
[NATCOM 2007] India: Greenhouse Gas Emissions 2007, Ministry of Environment andƒƒ
Forests, May 2010.
[NEDO 2008] Global Warming Countermeasures 2008 Revised Edition, “Japaneseƒƒ
Technologies for energy savings/GHG emissions reduction”
[Roberts, Brian and Trevor Kanaley 2005] Urbanisation and Sustainability in Asia: goodƒƒ
practice approaches in region development.](https://image.slidesharecdn.com/interexp-160122083810/85/Inter-exp-108-320.jpg)
![Sectoral Strategies 101
[Rue du Can 2009]ƒƒ Residential and transport energy use in India: Past trend and future
outlook, S. Rue du Can, V. Letschert, M. McNeil, N. Zhou, J. Sathaye, Lawrence Berkeley
National Laboratory report, January 2009
[Sperling 2004]ƒƒ Environmental impacts due to urban transport, D. Sperling, Urban
Transport and the Environment, Nakamura, Hayashi, May (eds.), Elsevier, pp 99-186,
2004
[Steel Statistical Yearbook 1995] World Steel Association, “Steel statistical Yearbookƒƒ
1995”
TERI 2007: TERI Energy Data Directory & Yearbook, 2007.ƒƒ
[Stephane de la Rue du Can et.al] January 2009. India Energy Outlook: End Use Demandƒƒ
in India to 2020
[Sundar 2008]ƒƒ Transport and Energy: The challenge of climate change, S. Sundar and
C. Dhingra, International Transport Forum workshop on transport CO2
in emerging
economies, Leipzig, May 2008
[TERI 2006]ƒƒ National Energy Map for India, Technology Vision 2030, The Energy and
Resources Institute, 2006
[Tiwari 2010]ƒƒ Low carbon urban transport systems in India: Strategies for promoting
public transport and non-motorized transport in Indian cities, submission by Prof. Geetam
Tiwari (TRIPP Chair Associate Professor for Transportation Planning, Transportation
Research and Injury Prevention Programme, IIT Delhi) to the Working Group on Transport,
April 2010
[World Bank 2010] World Bank, “Energy Intensive Sectors of the Indian Economy: Pathƒƒ
to Low Carbon Development,” Washington, DC, 2010.
[World Steel Association, 2010] Data from www.worldsteel.orgƒƒ
[World Steel Statistical Yearbook 2009] World Steel Association, “Steel statisticalƒƒ
Yearbook 2009”
[WSA 2008]ƒƒ Study on traffic and transportation policies and strategies in urban areas
in India, a report by Wilbur Smith Associates for the Ministry of Urban Development,
Government of India, May 2008](https://image.slidesharecdn.com/interexp-160122083810/85/Inter-exp-109-320.jpg)


This document provides an interim report from the Expert Group on Low Carbon Strategies for Inclusive Growth in India. It summarizes the group's approach and work conducted so far. The group was tasked with developing strategies for India's Twelfth Five Year Plan to pursue low carbon inclusive growth. Initial work focused on identifying options to reduce greenhouse gas emission intensity across key sectors of the Indian economy, including power, transport, industry, buildings and forestry. Preliminary analysis suggests emission intensity could be reduced 23-25% by 2022 through determined efforts and 33-35% through more aggressive efforts. Further analysis of costs and macroeconomic impacts is still needed.