Download to read offline
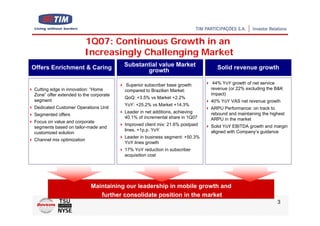
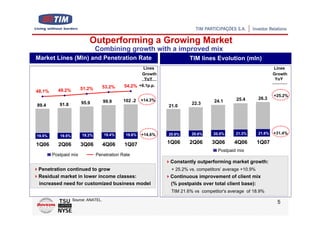
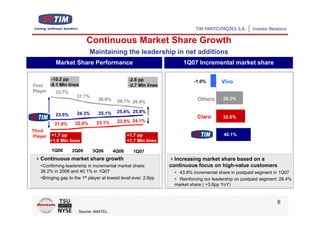


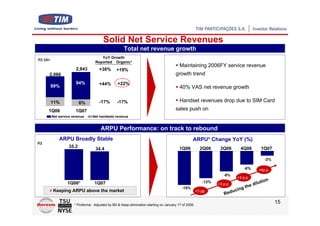
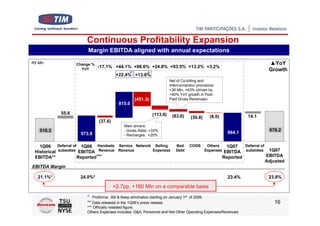

TIM Participações S.A. reported strong financial results for 1Q07, with continued growth in the challenging Brazilian mobile market. Key highlights include: 1) Solid revenue growth of 44% YoY for net service revenue, driven by 40% growth in VAS net revenue. 2) Superior subscriber growth of 25.2% YoY outpaced the market growth of 14.3%. TIM achieved 40.1% of the market's incremental subscriber additions in 1Q07. 3) EBITDA increased 44% YoY and the EBITDA margin expanded to 23.8%, aligned with the company's annual guidance despite investments in the business.


