Download to read offline


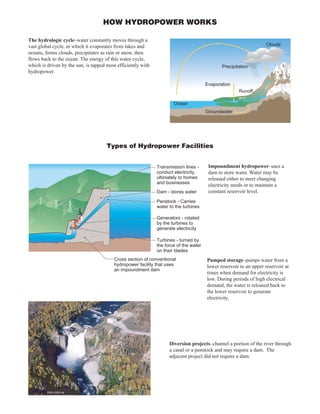


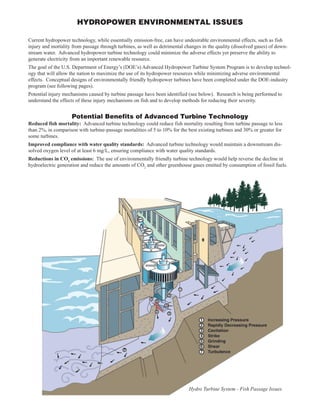
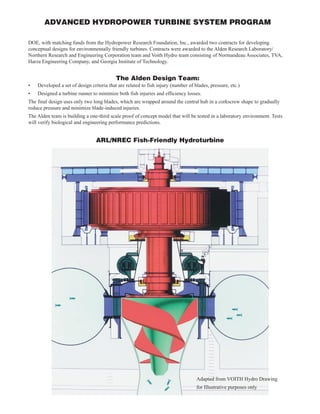


Hydropower harnesses the energy of flowing water to generate electricity. Water is diverted from a river or reservoir through a penstock to spin turbines, which turn generators to produce electricity. Advanced turbine designs aim to minimize environmental impacts like fish injury and mortality. The DOE is funding projects to develop more fish-friendly turbine concepts and test designs that use gradual pressure reduction and minimize contact with blades to reduce stress on fish passing through turbines.


