
Recommended
Recommended
More Related Content
What's hot
What's hot (20)
Similar to Random sampling
Similar to Random sampling (20)
Recently uploaded
Recently uploaded (20)
Random sampling
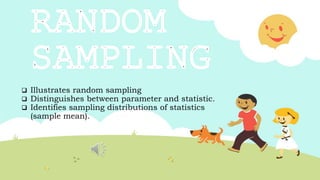
- 1. Illustrates random sampling Distinguishes between parameter and statistic. Identifies sampling distributions of statistics (sample mean).
- 2. A consumer is interested in buying grapes. Before deciding, the consumer requests a piece from the bunch of grapes shown by the seller. Based upon this piece, the consumer decided to buy the bunch of grapes.
- 3. The consumer’s decision to buy the grapes was based only on a piece, or sample, of the bunch. Obviously, it was not needed for the consumer to buy and eat the whole bunch of grapes before determining whether these grapes tasted good enough to purchase. This idea of selecting a portion, or sample, to determine the taste or characteristics of all the grapes, or population, is the concept of sampling.
- 4. SAMPLING IN EVERYDAY LIFE
- 5. A population refers to the entire group that is under study or investigation. A sample is a subset taken from a population, either by random or non-random sampling techniques. A sample is a representation of the population where one hopes to draw valid conclusions from about the population. Sampling is the process of selecting a portion, or sample, of the entire population. A simple random sampling or random sampling is a selection of elements derived from a population , which is the subject of the investigation or experiment, where each sample point has an equal chance of being selected using the appropriate sampling technique.
- 8. Simple Random/Lottery Sampling A sampling technique where every member of the population has an equal chance of being selected. The procedure is carried out by randomly picking numbers, with each number corresponds to each member of the population. Example. Drawing of winning prizes from the tambiolo.
- 9. SIMPLE RANDOM SAMPLING 9 • Applicable when population is small, homogeneous & readily available • All subsets of the frame are given an equal probability. Each element of the frame thus has an equal probability of selection. • It provides for greatest number of possible samples. This is done by assigning a number to each unit in the sampling frame. • A table of random number or lottery system is used to determine which units are to be selected.
- 10. SIMPLE RANDOM SAMPLING…….. 10 Estimates are easy to calculate. Disadvantages If sampling frame large, this method impracticable. Minority subgroups of interest in population may not be present in sample in sufficient numbers for study.
- 11. Systematic Sampling A sampling technique in which members of the population are ordered in some way such as alphabetically or numerically and samples are selected in intervals called sample intervals. In this technique, a starting point is randomly selected from the first k positions, and then, every kth number, is selected from the sample. Since k is the ratio of the population size to sample size, to find the k use the formula: 𝒌 = 𝒑𝒐𝒑𝒖𝒍𝒂𝒕𝒊𝒐𝒏 𝒔𝒊𝒛𝒆/𝒔𝒂𝒎𝒑𝒍𝒆 𝒔𝒊𝒛𝒆
- 12. SYSTEMATIC SAMPLING…… 12 ADVANTAGES: Sample easy to select Suitable sampling frame can be identified easily Sample evenly spread over entire reference population DISADVANTAGES: Sample may be biased if hidden periodicity in population coincides with that of selection. Difficult to assess precision of estimate from one survey.
- 13. Example. A Science teacher decides to select a sample of 10 students from her large lecture class containing 300 students to be part of an experiment using the systematic sampling procedure. If each student has an assigned number from 1 to 300 and she randomly selects 3 as her starting point, identify the students selected for the experiment. Solution. Step 1: Identify the value of . 𝒌=𝒑𝒐𝒑𝒖𝒍𝒂𝒕𝒊𝒐𝒏 𝒔𝒊𝒛𝒆/𝒔𝒂𝒎𝒑𝒍𝒆 𝒔𝒊𝒛𝒆 𝑘 = 300 10 𝒌=𝟑𝟎 Step 2: Since 𝒌=𝟑𝟎 and the starting point given is 3, the sample of selected students are: 1st student: 3rd 6th student: 123 + 30 = 153rd 2nd student: 3+30 = 33rd 7th student: 153 + 30 = 183rd 3rd student: 33+30 = 63rd 8th student: 183 + 30 = 213rd 4th student: 63+30 = 93rd 9th student: 213 + 30 = 243rd 5th student: 93+30 = 123rd 10th student: 243 + 30 = 273rd
- 14. Stratified Random Sampling A sampling procedure wherein the members of the population are grouped based on their homogeneity. This technique is used when there are a number of distinct subgroups in the population, within each of which is required that there is full representation. The sample is constructed by classifying the population into subpopulations or strata, based on some characteristics of the population such as age, gender, or socio-economic status. The selection of elements is then made separately from within each stratum, usually by random or systematic sampling methods.
- 15. STRATIFIED SAMPLING 15 Where population embraces a number of distinct categories, the frame can be organized into separate "strata." Each stratum is then sampled as an independent sub-population, out of which individual elements can be randomly selected. Every unit in a stratum has same chance of being selected. Using same sampling fraction for all strata ensures proportionate representation in the sample. Adequate representation of minority subgroups of interest can be ensured by stratification & varying sampling fraction between strata as required.
- 16. STRATIFIED SAMPLING…… 16 Finally, since each stratum is treated as an independent population, different sampling approaches can be applied to different strata. Drawbacks to using stratified sampling. First, sampling frame of entire population has to be prepared separately for each stratum Second, when examining multiple criteria, stratifying variables may be related to some, but not to others, further complicating the design, and potentially reducing the utility of the strata. Finally, in some cases (such as designs with a large number of strata, or those with a specified minimum sample size per group), stratified sampling can potentially require a larger sample than would other methods
- 17. STRATIFIED SAMPLING……. 17 Draw a sample from each stratum
- 18. Example. Using stratified random sampling, select a sample of 387 students from the population which are grouped according to the cities they come from. The table below shows the number of students per city. Solution. To determine the number of students to be taken as sample from each City, divide the number of students per city (stratum) by the total population (which is 36 500) and multiply the result by the total sample size (which is 387). Based on the table, 138 students will be drawn from City A, 111 students from City B, 85 students from City C, and 53 students from D. The selection of students from each City may use random or systematic sampling methods.
- 19. Cluster Sampling It is sometimes called area sampling, the population is divided into groups or clusters, usually based upon geographic location, and these clusters contain data values which are heterogenous. A simple random sample of clusters is selected to represent the population. Ideally, the clusters should be similar and be a representative small-scale version of the overall population.
- 20. CLUSTER SAMPLING……. 20 Advantages : Cuts down on the cost of preparing a sampling frame. This can reduce travel and other administrative costs. Disadvantages: sampling error is higher for a simple random sample of same size. Often used to evaluate vaccination coverage in EPI
- 21. CLUSTER SAMPLING……. 21 • Identification of clusters – List all cities, towns, villages & wards of cities with their population falling in target area under study. – Calculate cumulative population & divide by 30, this gives sampling interval. – Select a random no. less than or equal to sampling interval having same no. of digits. This forms 1st cluster. – Random no.+ sampling interval = population of 2nd cluster. – Second cluster + sampling interval = 4th cluster. – Last or 30th cluster = 29th cluster + sampling interval
- 22. Difference Between Strata and Clusters 22 Although strata and clusters are both non-overlapping subsets of the population, they differ in several ways. All strata are represented in the sample; but only a subset of clusters are in the sample. With stratified sampling, the best survey results occur when elements within strata are internally homogeneous. However, with cluster sampling, the best results occur when elements within clusters are internally heterogeneous
- 23. Example. A statistician wants to determine the number of children per family in Tarlac City. To minimize the cost of selecting a sample, the statistician decides to divide the city of Tarlac into Barangays (clusters) and use the cluster sampling procedure to select the sample. A random sample of the Barangays are selected and every family on the Barangay are interviewed to determine the number of children in the family.
- 24. Multi-Stage Sampling It is done using a combination of different sampling techniques. Example. When selecting respondents for a national election survey, lottery method may be used to select regions and cities. Then, utilize stratified sampling to determine the number of respondents from the chosen areas and clusters.
- 25. A nonrandom sampling is used when the sample is not a proportion of the population and when there is no system in selecting a sample. This is often used by the researchers to elicit and gather quick responses for questions which do not require confidentiality. The researcher states prejudice in the choice of the sample giving the members of the population unequal chances to be selected.
- 27. Quota Sampling The researcher limits the number of his samples based on the required number of the subject under investigation. The population is first segmented into mutually exclusive subgroups, then judgement used to select subjects or units from each segment is based on the specified proportion. For example, an interviewer may be told to sample 200 females and 300 males between age 45 and 60.
- 28. Convenience Sampling The researcher conducts a study at his convenient time, preferred place, or venue. It is the most convenient and fastest sampling technique that make use of telephone, mobile phones, or the internet. It simply uses results that are readily available.
- 29. Purposive Sampling It is used in very small sample sizes. Choosing samples is based on a certain criteria and rules laid down by the researcher. For example, this can be used if the sample of the study are deans of universities or area managers of certain institutions. Since the different random sampling techniques were presented, the next thing to be determined is the sample size.
- 31. Identify which sampling technique was used in the following situations?
- 32. A group of test subjects is divided into twelve groups; four of the groups are chosen at random. Cluster Sampling
- 33. A market researcher polls every tenth person who walks into a store. Systematic Random Sampling
- 34. A computer generates 100 random numbers, and 100 people whose names correspond with numbers on the list are chosen. Simple Random Sampling/Lottery Sampling
- 35. The first 50 people who walk into sporting event are polled on their television preferences. Quota Sampling
- 36. A researcher conducted his survey by randomly choosing one town in the province of Tarlac by using a fishbowl and then randomly picking 40 samples from that town. Multi-Stage
- 37. A researcher conducted his survey by choosing 40 persons he knew. What sampling method that the researcher used? Convenience Sampling
- 38. A study was done to determine the age, number of times per week and duration of residents using a local park in Victoria, Tarlac. The first house in the neighborhood around the park was selected randomly, and then the resident of every eight house in the neighborhood around the park was interviewed. What sampling method was used? Systematic Random Sampling
- 39. In most applications of Statistics, researchers use a sample rather than the entire population since it is usually impractical or impossible to obtain all the population observations or measurements; thus, sample information are used to estimate the characteristics of a population. That is, the use of a statistic to make inferences about the corresponding population parameter is being done.
- 40. A statistic is a number which describes a characteristic of a sample. It can be directly computed and observed. It serves as estimator of the population parameter. A parameter is a number which describes a characteristic of a population. While statistic can be directly computed and observed, the value of a parameter can be approximated and is not necessarily equal to the statistic of a sample.
- 42. In calculating a statistic, such as a sample mean, from a random sample of the population, the computed statistic is not necessarily equal to the population parameter. Furthermore, taking another random sample from the same population may result to a different computed statistic. But both are estimates of the parameter. This clearly shows that the statistics which can be computed from a randomly selected sample of the given population are distinct. If so, what could be the distribution of values that can be computed for the statistics? What is the frequency with which different values for the statistic will be computed to estimate the parameter?
- 43. A sampling distribution is the probability distribution when all possible samples of size are repeatedly drawn from a population.
- 44. Illustrative Example 1 Construct a sampling distribution of the mean and a histogram for the set of data below. 86 89 92 95 98
- 48. Problem: Find the mean of the set of data below and construct a sampling distribution, without replacement and repetition, by selecting 4 samples at a time ( = 4). Construct a histogram of the sample means. 25, 28, 24, 27, 30, 20 Random Sample Sample Mean 20,24,25,27 24 20,24,25,28 24.25 20,24,25,30 24.75 20,24,27,28 24.5 20,24,27,30 25.25 20,24,28,30 25.5 20,25,27,28 25 20,27,28,30 26.25 24,25,27,28 26 24,25,27,30 26.5 24,27,28,30 27.25 25,27,28,30 27.5 24,25,28,30 26.75 20,25,28,30 25.75 20,25,27,30 25.5 Sample Mean P(x) 24 0.067 24.25 0.067 24.5 0.067 24.75 0.067 25 0.067 25.25 0.067 25.5 0.13 25.75 0.067 26 0.067 26.25 0.067 26.5 0.067 26.75 0.067 27.25 0.067 27.5 0.067
- 49. PERFORMANCE TASK # 4 (Problem Solving ) Direction: Answer the given problem below in a separate sheet of paper and show your complete solution. Problem: Find the mean of the set of data below and construct a sampling distribution, without replacement and repetition, by selecting 5 samples at a time ( = 5). Construct a histogram of the sample means. 5 8 11 14 17 20 23