Downloaded 1,998 times


![What’s a hypothesis Hypothesis : a predicted, or expected answer to a research question e.g. Tenure [of ‘x’, at time ‘t’, in place ‘y’] is positively correlated with salary](https://image.slidesharecdn.com/quantitative-data-a-basic-introduction-1198133206856240-3/85/Quantitative-Data-A-Basic-Introduction-20-320.jpg)

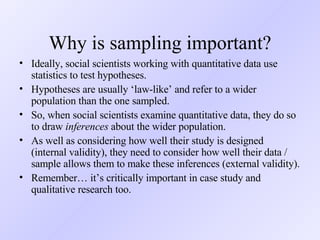
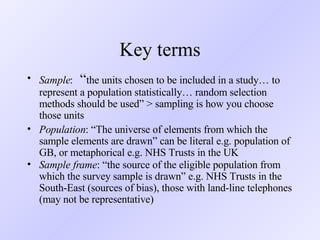
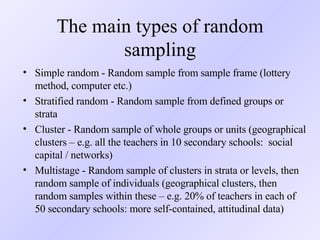
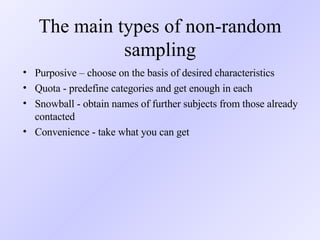

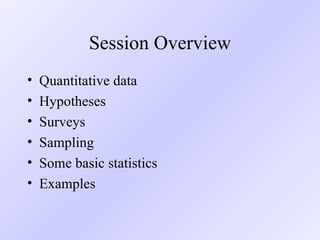
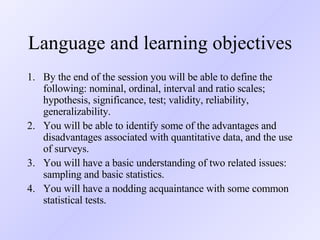
This document serves as an introduction to quantitative data, outlining key concepts such as types of scales, hypotheses, sampling methods, and basic statistics. It highlights the advantages and disadvantages of using quantitative data and surveys for research, emphasizing the importance of sampling and validity in social science studies. By the end of the session, participants will be equipped to define fundamental statistical terms and understand essential statistical tests.