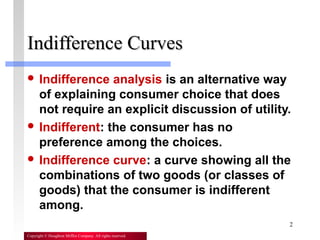
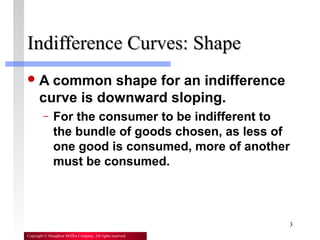
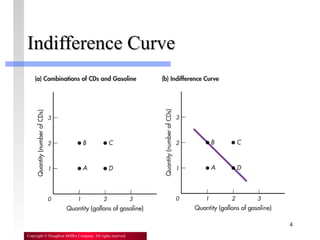
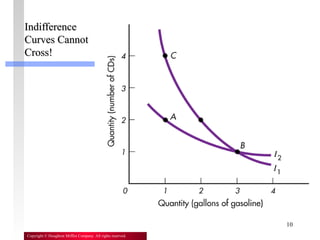
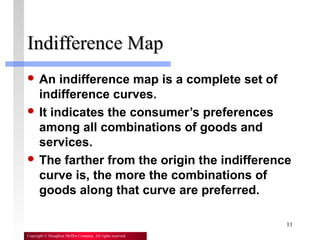
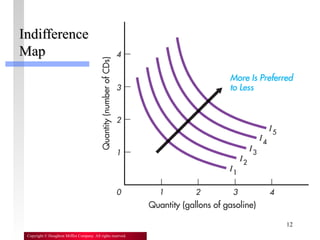
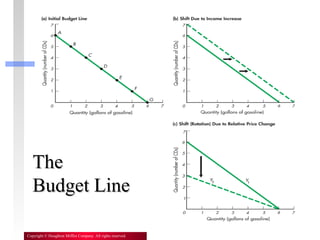
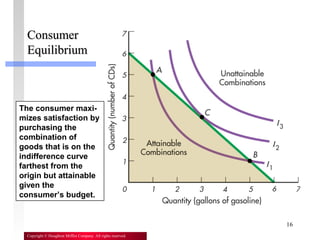
Indifference AnalysisIndifference Analysis
2
Copyright © Houghton Mifflin Company. All rights reserved.
Indifference CurvesIndifference Curves
 Indifference analysis is an alternative way
of explaining consumer choice that does
not require an explicit discussion of utility.
 Indifferent: the consumer has no
preference among the choices.
 Indifference curve: a curve showing all the
combinations of two goods (or classes of
goods) that the consumer is indifferent
among.
3
Copyright © Houghton Mifflin Company. All rights reserved.
Indifference Curves: ShapeIndifference Curves: Shape
A common shape for an indifference
curve is downward sloping.
– For the consumer to be indifferent to
the bundle of goods chosen, as less of
one good is consumed, more of another
must be consumed.
4
Copyright © Houghton Mifflin Company. All rights reserved.
Indifference CurveIndifference Curve
5
Copyright © Houghton Mifflin Company. All rights reserved.
Indifference Curves: Shape (2)Indifference Curves: Shape (2)
 The indifference curves are not likely to be
vertical, horizontal, or upward sloping.
– A vertical or horizontal indifference curve holds the
quantity of one of the goods constant, implying that the
consumer is indifferent to getting more of one good
without giving up any of the other good.
– An upward-sloping curve would mean that the
consumer is indifferent between a combination of
goods that provides less of everything and another that
provides more of everything.
– Rational consumers usually prefer more to less.
6
Copyright © Houghton Mifflin Company. All rights reserved.
Indifference Curve ShapesIndifference Curve Shapes
7
Copyright © Houghton Mifflin Company. All rights reserved.
Indifference Curves: SlopeIndifference Curves: Slope
 The slope or steepness of indifference
curves is determined by consumer
preferences.
– It reflects the amount of one good that a consumer
must give up to get an additional unit of the other good
while remaining equally satisfied.
– This relationship changes according to diminishing
marginal utility—the more a consumer has of a good,
the less the consumer values an additional value of
that good. This is shown by an indifference curve that
bows in toward the origin.
8
Copyright © Houghton Mifflin Company. All rights reserved.
Bowed-inBowed-in
IndifferenceIndifference
CurveCurve
9
Copyright © Houghton Mifflin Company. All rights reserved.
Indifference Curves:Indifference Curves:
No Crossing Allowed!No Crossing Allowed!
 Indifference curves cannot cross.
 If the curves crossed, it would mean that
the same bundle of goods would offer two
different levels of satisfaction at the same
time.
 If we allow that the consumer is indifferent
to all points on both curves, then the
consumer must not prefer more to less.
10
Copyright © Houghton Mifflin Company. All rights reserved.
IndifferenceIndifference
Curves CannotCurves Cannot
Cross!Cross!
11
Copyright © Houghton Mifflin Company. All rights reserved.
Indifference MapIndifference Map
 An indifference map is a complete set of
indifference curves.
 It indicates the consumer’s preferences
among all combinations of goods and
services.
 The farther from the origin the indifference
curve is, the more the combinations of
goods along that curve are preferred.
12
Copyright © Houghton Mifflin Company. All rights reserved.
IndifferenceIndifference
MapMap
13
Copyright © Houghton Mifflin Company. All rights reserved.
Budget ConstraintBudget Constraint
 The indifference map only reveals the
ordering of consumer preferences among
bundles of goods. It tells us what the
consumer is willing to buy.
 It does not tell us what the consumer is
able to buy. It does not tell us anything
about the consumer’s buying power.
 The budget line shows all the
combinations of goods that can be
purchased with a given level of income.
14
Copyright © Houghton Mifflin Company. All rights reserved.
TheThe
Budget LineBudget Line
15
Copyright © Houghton Mifflin Company. All rights reserved.
Consumer EquilibriumConsumer Equilibrium
The indifference map in
combination with the budget line
allows us to determine the one
combination of goods and
services that the consumer most
wants and is able to purchase.
This is the consumer equilibrium.
16
Copyright © Houghton Mifflin Company. All rights reserved.
ConsumerConsumer
EquilibriumEquilibrium
The consumer maxi-
mizes satisfaction by
purchasing the
combination of
goods that is on the
indifference curve
farthest from the
origin but attainable
given the
consumer’s budget.

Indiffrence analist

  • 1.
  • 2.
    2 Copyright © HoughtonMifflin Company. All rights reserved. Indifference CurvesIndifference Curves  Indifference analysis is an alternative way of explaining consumer choice that does not require an explicit discussion of utility.  Indifferent: the consumer has no preference among the choices.  Indifference curve: a curve showing all the combinations of two goods (or classes of goods) that the consumer is indifferent among.
  • 3.
    3 Copyright © HoughtonMifflin Company. All rights reserved. Indifference Curves: ShapeIndifference Curves: Shape A common shape for an indifference curve is downward sloping. – For the consumer to be indifferent to the bundle of goods chosen, as less of one good is consumed, more of another must be consumed.
  • 4.
    4 Copyright © HoughtonMifflin Company. All rights reserved. Indifference CurveIndifference Curve
  • 5.
    5 Copyright © HoughtonMifflin Company. All rights reserved. Indifference Curves: Shape (2)Indifference Curves: Shape (2)  The indifference curves are not likely to be vertical, horizontal, or upward sloping. – A vertical or horizontal indifference curve holds the quantity of one of the goods constant, implying that the consumer is indifferent to getting more of one good without giving up any of the other good. – An upward-sloping curve would mean that the consumer is indifferent between a combination of goods that provides less of everything and another that provides more of everything. – Rational consumers usually prefer more to less.
  • 6.
    6 Copyright © HoughtonMifflin Company. All rights reserved. Indifference Curve ShapesIndifference Curve Shapes
  • 7.
    7 Copyright © HoughtonMifflin Company. All rights reserved. Indifference Curves: SlopeIndifference Curves: Slope  The slope or steepness of indifference curves is determined by consumer preferences. – It reflects the amount of one good that a consumer must give up to get an additional unit of the other good while remaining equally satisfied. – This relationship changes according to diminishing marginal utility—the more a consumer has of a good, the less the consumer values an additional value of that good. This is shown by an indifference curve that bows in toward the origin.
  • 8.
    8 Copyright © HoughtonMifflin Company. All rights reserved. Bowed-inBowed-in IndifferenceIndifference CurveCurve
  • 9.
    9 Copyright © HoughtonMifflin Company. All rights reserved. Indifference Curves:Indifference Curves: No Crossing Allowed!No Crossing Allowed!  Indifference curves cannot cross.  If the curves crossed, it would mean that the same bundle of goods would offer two different levels of satisfaction at the same time.  If we allow that the consumer is indifferent to all points on both curves, then the consumer must not prefer more to less.
  • 10.
    10 Copyright © HoughtonMifflin Company. All rights reserved. IndifferenceIndifference Curves CannotCurves Cannot Cross!Cross!
  • 11.
    11 Copyright © HoughtonMifflin Company. All rights reserved. Indifference MapIndifference Map  An indifference map is a complete set of indifference curves.  It indicates the consumer’s preferences among all combinations of goods and services.  The farther from the origin the indifference curve is, the more the combinations of goods along that curve are preferred.
  • 12.
    12 Copyright © HoughtonMifflin Company. All rights reserved. IndifferenceIndifference MapMap
  • 13.
    13 Copyright © HoughtonMifflin Company. All rights reserved. Budget ConstraintBudget Constraint  The indifference map only reveals the ordering of consumer preferences among bundles of goods. It tells us what the consumer is willing to buy.  It does not tell us what the consumer is able to buy. It does not tell us anything about the consumer’s buying power.  The budget line shows all the combinations of goods that can be purchased with a given level of income.
  • 14.
    14 Copyright © HoughtonMifflin Company. All rights reserved. TheThe Budget LineBudget Line
  • 15.
    15 Copyright © HoughtonMifflin Company. All rights reserved. Consumer EquilibriumConsumer Equilibrium The indifference map in combination with the budget line allows us to determine the one combination of goods and services that the consumer most wants and is able to purchase. This is the consumer equilibrium.
  • 16.
    16 Copyright © HoughtonMifflin Company. All rights reserved. ConsumerConsumer EquilibriumEquilibrium The consumer maxi- mizes satisfaction by purchasing the combination of goods that is on the indifference curve farthest from the origin but attainable given the consumer’s budget.