Downloaded 211 times


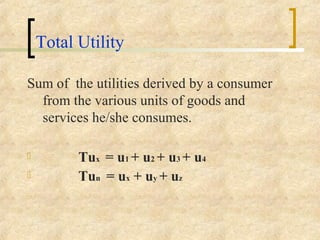


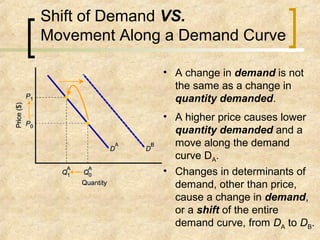

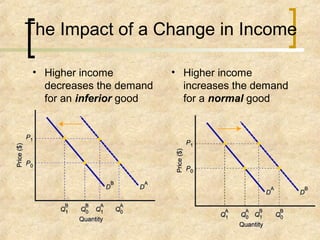


This document defines and explains the economic concept of utility. It begins by defining utility as the ability of a commodity to satisfy human needs. It then discusses how different commodities provide different levels of utility to different people in different situations. It also explains that marginal utility decreases with increasing consumption of a good while total utility increases at a decreasing rate. The document provides examples and formulas to illustrate these concepts. It concludes by discussing the determinants and assumptions of demand and how the law of demand states that demand curves will slope downward, showing an inverse relationship between price and quantity demanded.