Downloaded 167 times
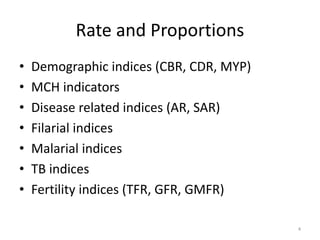

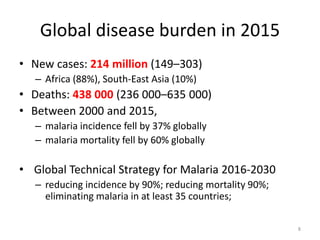
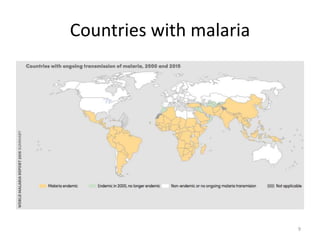
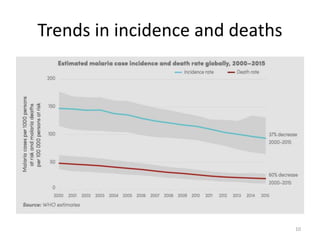

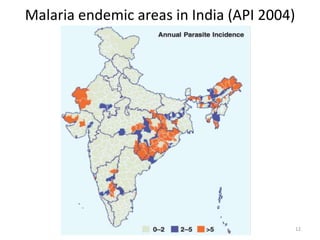

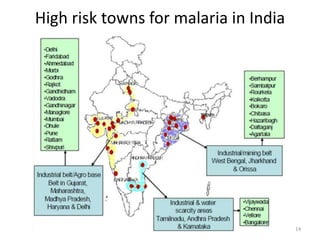
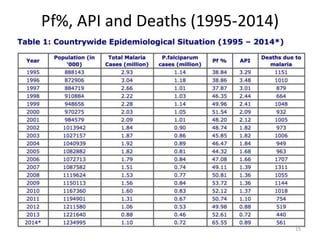
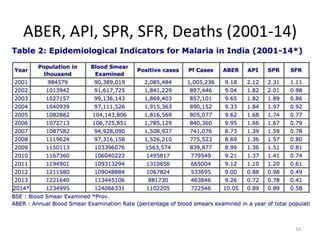
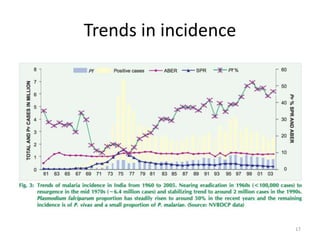
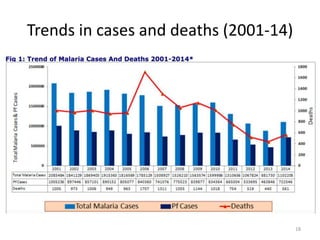
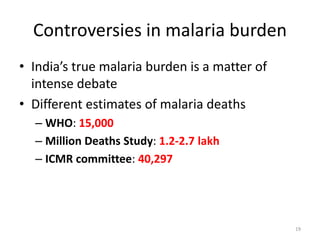
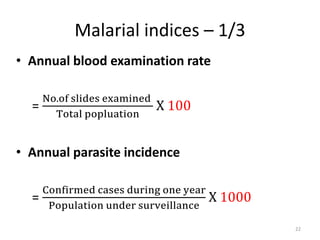
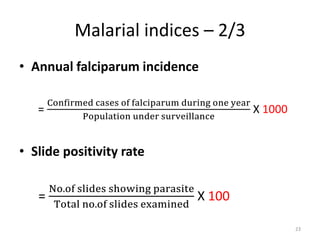
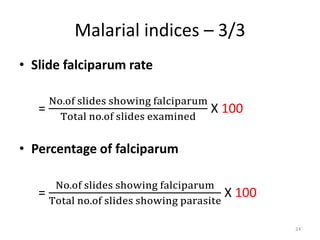


Malaria remains a major global health problem, though incidence and mortality have decreased in recent years. In 2015, there were an estimated 214 million malaria cases and 438,000 deaths worldwide. India also has a significant malaria burden, with estimates of annual deaths ranging from 15,000 to over 200,000. Key malaria indices calculated to monitor disease burden and evaluate control programs include annual blood examination rate, annual parasite incidence, slide positivity rate, and percentage of malaria cases that are falciparum. These indices are calculated using population data and numbers of blood slides examined and positive results to measure aspects of local transmission and intervention effectiveness.


![CTEV [ clubfoot] DR ARUN LAL ,DR MOHAMED ASHRAF travancore medical college k...](https://cdn.slidesharecdn.com/ss_thumbnails/ctevclubfootdrarunlaldrmohamedashraftravancoremedicalcollegekollamkeralaindia-260208063247-18fc466c-thumbnail.jpg?width=640&height=640&fit=bounds)

