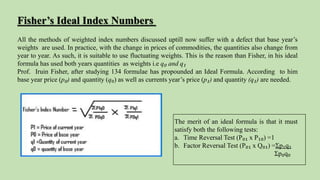
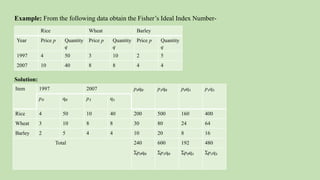
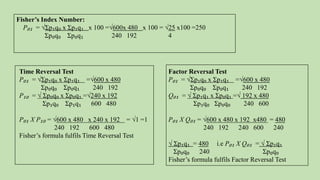
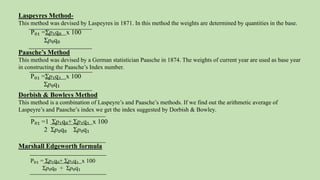
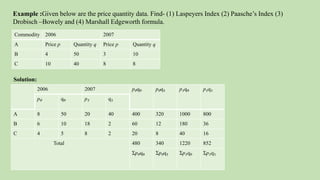
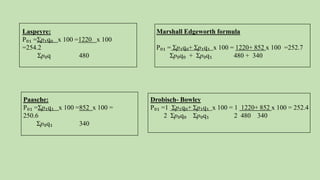
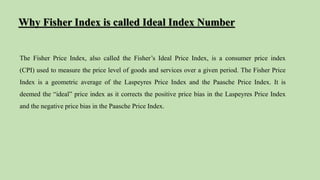
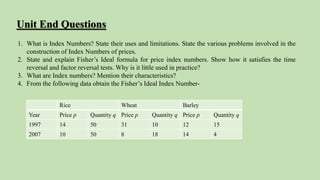
Dr rekha choudhary
Department of Economics
Jai NarainVyas University,Jodhpur
Rajasthan
ECONOMICS
BASICSTATISTICS
Introduction
An index number measures the relative change in price, quantity,
value, or some other item of interest from one time period to
another. A simple index number measures the relative change in
one or more than one variable.
Objective
After going through this unit, you will be able to:
 Understand the concept of Index Numbers;
 Define Index Numbers , types of Index Numbers
 Which is Ideal Index Numbers
Some particles problems of Index Numbers.
Index numbers
According to Croxton and Cowden, “Index numbers are the devices for measuring differences in
magnitude of a group of related variables”
According to Spiegel, “ An index number is statistical number designed to show changes in a variable
or a group of related variables with respect to time, geographic location or other characteristics.”
In general we can say that “ Index numbers are specialized averages which measures the general
trend of relative changes in the magnitude of a variable or a group of related variables with respect to
time, space or other specific characteristics”
Meaning and Definition
1.Relative measurement of changes
2.Average of percentage
3.Base of comparison
4.Applicability
Characteristics of Index numbers
Index numbers are specialized averages. Index numbers measure the change in the level of a
phenomenon. Index numbers measure the effect of changes over a period of time.
1.To make difficult facts easy
2.Helpful in comparative study
3.Indicate the future trend
4.Helpful in policy determination
5.Useful in Deflating Income
6.Uses in Wholesale Price Index numbers
7.Usefulness of Consumer Price Index numbers
8.Business activity Index numbers
Advantages of Index numbers
1.Index numbers are true on an average basis
2.Lack of absolute purity
3.Difference In objects and methods
4.Ignore qualitative changes
5.Limitations of averages
6.Other limitations
Disadvantages of Index numbers
1. Choice of the base period.
2. Choice of an average.
3. Choice of index.
4. Selection of commodities. Data collection.
Problems Related To Index Numbers
Price Index Number: It evaluates the relative differences in costs between two particular points in
time.
Quantity Index Number: It measures differences in the physical quantity of products
manufactured, bought or sold of one item or group of items.
Types of Index Number
Methods Of Constructing Index Numbers
These are those index numbers in which rational weights are assigned to various chains in an explicit
fashion. These index numbers are the simple aggregative type with the fundamental difference that
weights are assigned to the various items included in the index.
1. Fisher’s ideal method.
2. Dorbish and bowley’s method.
3. Marshall-Edgeworth method.
4. Laspeyre’s method.
5. Paasche’s method.
6. Kelly’s method.
Weighted Index Numbers
Fisher’s Ideal Index Numbers
All the methods of weighted index numbers discussed uptill now suffer with a defect that base year’s
weights are used. In practice, with the change in prices of commodities, the quantities also change from
year to year. As such, it is suitable to use fluctuating weights. This is the reason than Fisher, in his ideal
formula has used both years quantities as weights i.e q₀ and q₁
Prof. Iruin Fisher, after studying 134 formulae has propounded an Ideal Formula. According to him
base year price (p₀) and quantity (q₀) as well as currents year’s price (p₁) and quantity (q₁) are needed.
The merit of an ideal formula is that it must
satisfy both the following tests:
a. Time Reversal Test (P₀₁ x P₁₀) =1
b. Factor Reversal Test (P₀₁ x Q₀₁) =Ʃp₁q₁
Ʃp₀q₀
Example: From the following data obtain the Fisher’s Ideal Index Number-
Rice Wheat Barley
Year Price p Quantity
q
Price p Quantity
q
Price p Quantity
q
1997 4 50 3 10 2 5
2007 10 40 8 8 4 4
Item 1997 2007 p₀q₀ p₁q₀ p₀q₁ p₁q₁
p₀ q₀ p₁ q₁
Rice 4 50 10 40 200 500 160 400
Wheat 3 10 8 8 30 80 24 64
Barley 2 5 4 4 10 20 8 16
Total 240 600 192 480
Ʃp₀q₀ Ʃp₁q₀ Ʃp₀q₁ Ʃp₁q₁
Solution:
Fisher’s Index Number:
P₀₁ = √Ʃp₁q₀ x Ʃp₁q₁ x 100 =√600x 480 x 100 = √25 x100 =250
Ʃp₀q₀ Ʃp₀q₁ 240 192 4
Time Reversal Test
P₀₁ = √Ʃp₁q₀ x Ʃp₁q₁ =√600 x 480
Ʃp₀q₀ Ʃp₀q₁ 240 192
P₁₀ = √ Ʃp₀q₀ x Ʃp₀q₁ =√240 x 192
Ʃp₁q₀ Ʃp₁q₁ 600 480
P₀₁ X P₁₀ = √600 x 480 x 240 x 192 = √1 =1
240 192 600 480
Fisher’s formula fulfils Time Reversal Test
Factor Reversal Test
P₀₁ = √Ʃp₁q₀ x Ʃp₁q₁ =√600 x 480
Ʃp₀q₀ Ʃp₀q₁ 240 192
Q₀₁ = √ Ʃp₁q₁ x Ʃp₀q₁ =√ 192 x 480
Ʃp₁q₀ Ʃp₀q₀ 240 600
P₀₁ X Q₀₁ = √600 x 480 x 192 x480 = 480
240 192 240 600 240
√ Ʃp₁q₁ = 480 i.e P₀₁ X Q₀₁ = √ Ʃp₁q₁
Ʃp₀q₀ 240 Ʃp₀q₀
Fisher’s formula fulfils Factor Reversal Test
Laspeyres Method-
This method was devised by Laspeyres in 1871. In this method the weights are determined by quantities in the base.
Paasche’s Method
This method was devised by a German statistician Paasche in 1874. The weights of current year are used as base year
in constructing the Paasche’s Index number.
Dorbish & Bowleys Method
This method is a combination of Laspeyre’s and Paasche’s methods. If we find out the arithmetic average of
Laspeyre’s and Paasche’s index we get the index suggested by Dorbish & Bowley.
Marshall Edgeworth formula
P₀₁ = Ʃp₁q₀+ Ʃp₁q₁ x 100
Ʃp₀q₀ + Ʃp₀q₁
P₀₁ =Ʃp₁q₀ x 100
Ʃp₀q₀
P₀₁ =Ʃp₁q₁ x 100
Ʃp₀q₁
P₀₁ =1 Ʃp₁q₀+ Ʃp₁q₁ x 100
2 Ʃp₀q₀ Ʃp₀q₁
Example :Given below are the price quantity data. Find- (1) Laspeyers Index (2) Paasche’s Index (3)
Drobisch –Bowely and (4) Marshall Edgeworth formula.
Commodity 2006 2007
A Price p Quantity q Price p Quantity q
B 4 50 3 10
C 10 40 8 8
2006 2007 p₀q₀ p₀q₁ p₁q₀ p₁q₁
p₀ q₀ p₁ q₁
A 8 50 20 40 400 320 1000 800
B 6 10 18 2 60 12 180 36
C 4 5 8 2 20 8 40 16
Total 480 340 1220 852
Ʃp₀q₀ Ʃp₀q₁ Ʃp₁q₀ Ʃp₁q₁
Solution:
Laspeyre:
P₀₁ =Ʃp₁q₀ x 100 =1220 x 100
=254.2
Ʃp₀q 480
Paasche:
P₀₁ =Ʃp₁q₁ x 100 =852 x 100 =
250.6
Ʃp₀q₁ 340
Drobisch- Bowley
P₀₁ =1 Ʃp₁q₀+ Ʃp₁q₁ x 100 = 1 1220+ 852 x 100 = 252.4
2 Ʃp₀q₀ Ʃp₀q₁ 2 480 340
Marshall Edgeworth formula
P₀₁ = Ʃp₁q₀+ Ʃp₁q₁ x 100 = 1220+ 852 x 100 =252.7
Ʃp₀q₀ + Ʃp₀q₁ 480 + 340
Why Fisher Index is called Ideal Index Number
The Fisher Price Index, also called the Fisher’s Ideal Price Index, is a consumer price index
(CPI) used to measure the price level of goods and services over a given period. The Fisher Price
Index is a geometric average of the Laspeyres Price Index and the Paasche Price Index. It is
deemed the “ideal” price index as it corrects the positive price bias in the Laspeyres Price Index
and the negative price bias in the Paasche Price Index.
Unit End Questions
1. What is Index Numbers? State their uses and limitations. State the various problems involved in the
construction of Index Numbers of prices.
2. State and explain Fisher’s Ideal formula for price index numbers. Show how it satisfies the time
reversal and factor reversal tests. Why is it little used in practice?
3. What are Index numbers? Mention their characteristics?
4. From the following data obtain the Fisher’s Ideal Index Number-
Rice Wheat Barley
Year Price p Quantity q Price p Quantity q Price p Quantity q
1997 14 50 31 10 12 15
2007 10 50 8 18 14 4
Required Readings
B.L.Aggrawal (2009). Basic Statistics. New Age International Publisher, Delhi.
Gupta, S.C.(1990) Fundamentals of Statistics. Himalaya Publishing House, Mumbai
Elhance, D.N: Fundamental of Statistics
Singhal, M.L: Elements of Statistics
Nagar, A.L. and Das, R.K.: Basic Statistics
Croxton Cowden: Applied General Statistics
Nagar, K.N.: Sankhyiki ke mool tatva
Gupta, BN : Sankhyiki
https://images.app.goo.gl/f6B2j9y115cTVYEg7
https://images.app.goo.gl/8jK1yVnpUBqFPZcY9
Index numbers

Index numbers

  • 1.
    Dr rekha choudhary Departmentof Economics Jai NarainVyas University,Jodhpur Rajasthan ECONOMICS BASICSTATISTICS
  • 2.
    Introduction An index numbermeasures the relative change in price, quantity, value, or some other item of interest from one time period to another. A simple index number measures the relative change in one or more than one variable.
  • 3.
    Objective After going throughthis unit, you will be able to:  Understand the concept of Index Numbers;  Define Index Numbers , types of Index Numbers  Which is Ideal Index Numbers Some particles problems of Index Numbers.
  • 4.
    Index numbers According toCroxton and Cowden, “Index numbers are the devices for measuring differences in magnitude of a group of related variables” According to Spiegel, “ An index number is statistical number designed to show changes in a variable or a group of related variables with respect to time, geographic location or other characteristics.” In general we can say that “ Index numbers are specialized averages which measures the general trend of relative changes in the magnitude of a variable or a group of related variables with respect to time, space or other specific characteristics” Meaning and Definition
  • 5.
    1.Relative measurement ofchanges 2.Average of percentage 3.Base of comparison 4.Applicability Characteristics of Index numbers Index numbers are specialized averages. Index numbers measure the change in the level of a phenomenon. Index numbers measure the effect of changes over a period of time.
  • 6.
    1.To make difficultfacts easy 2.Helpful in comparative study 3.Indicate the future trend 4.Helpful in policy determination 5.Useful in Deflating Income 6.Uses in Wholesale Price Index numbers 7.Usefulness of Consumer Price Index numbers 8.Business activity Index numbers Advantages of Index numbers
  • 7.
    1.Index numbers aretrue on an average basis 2.Lack of absolute purity 3.Difference In objects and methods 4.Ignore qualitative changes 5.Limitations of averages 6.Other limitations Disadvantages of Index numbers
  • 8.
    1. Choice ofthe base period. 2. Choice of an average. 3. Choice of index. 4. Selection of commodities. Data collection. Problems Related To Index Numbers
  • 9.
    Price Index Number:It evaluates the relative differences in costs between two particular points in time. Quantity Index Number: It measures differences in the physical quantity of products manufactured, bought or sold of one item or group of items. Types of Index Number
  • 10.
  • 11.
    These are thoseindex numbers in which rational weights are assigned to various chains in an explicit fashion. These index numbers are the simple aggregative type with the fundamental difference that weights are assigned to the various items included in the index. 1. Fisher’s ideal method. 2. Dorbish and bowley’s method. 3. Marshall-Edgeworth method. 4. Laspeyre’s method. 5. Paasche’s method. 6. Kelly’s method. Weighted Index Numbers
  • 12.
    Fisher’s Ideal IndexNumbers All the methods of weighted index numbers discussed uptill now suffer with a defect that base year’s weights are used. In practice, with the change in prices of commodities, the quantities also change from year to year. As such, it is suitable to use fluctuating weights. This is the reason than Fisher, in his ideal formula has used both years quantities as weights i.e q₀ and q₁ Prof. Iruin Fisher, after studying 134 formulae has propounded an Ideal Formula. According to him base year price (p₀) and quantity (q₀) as well as currents year’s price (p₁) and quantity (q₁) are needed. The merit of an ideal formula is that it must satisfy both the following tests: a. Time Reversal Test (P₀₁ x P₁₀) =1 b. Factor Reversal Test (P₀₁ x Q₀₁) =Ʃp₁q₁ Ʃp₀q₀
  • 13.
    Example: From thefollowing data obtain the Fisher’s Ideal Index Number- Rice Wheat Barley Year Price p Quantity q Price p Quantity q Price p Quantity q 1997 4 50 3 10 2 5 2007 10 40 8 8 4 4 Item 1997 2007 p₀q₀ p₁q₀ p₀q₁ p₁q₁ p₀ q₀ p₁ q₁ Rice 4 50 10 40 200 500 160 400 Wheat 3 10 8 8 30 80 24 64 Barley 2 5 4 4 10 20 8 16 Total 240 600 192 480 Ʃp₀q₀ Ʃp₁q₀ Ʃp₀q₁ Ʃp₁q₁ Solution:
  • 14.
    Fisher’s Index Number: P₀₁= √Ʃp₁q₀ x Ʃp₁q₁ x 100 =√600x 480 x 100 = √25 x100 =250 Ʃp₀q₀ Ʃp₀q₁ 240 192 4 Time Reversal Test P₀₁ = √Ʃp₁q₀ x Ʃp₁q₁ =√600 x 480 Ʃp₀q₀ Ʃp₀q₁ 240 192 P₁₀ = √ Ʃp₀q₀ x Ʃp₀q₁ =√240 x 192 Ʃp₁q₀ Ʃp₁q₁ 600 480 P₀₁ X P₁₀ = √600 x 480 x 240 x 192 = √1 =1 240 192 600 480 Fisher’s formula fulfils Time Reversal Test Factor Reversal Test P₀₁ = √Ʃp₁q₀ x Ʃp₁q₁ =√600 x 480 Ʃp₀q₀ Ʃp₀q₁ 240 192 Q₀₁ = √ Ʃp₁q₁ x Ʃp₀q₁ =√ 192 x 480 Ʃp₁q₀ Ʃp₀q₀ 240 600 P₀₁ X Q₀₁ = √600 x 480 x 192 x480 = 480 240 192 240 600 240 √ Ʃp₁q₁ = 480 i.e P₀₁ X Q₀₁ = √ Ʃp₁q₁ Ʃp₀q₀ 240 Ʃp₀q₀ Fisher’s formula fulfils Factor Reversal Test
  • 15.
    Laspeyres Method- This methodwas devised by Laspeyres in 1871. In this method the weights are determined by quantities in the base. Paasche’s Method This method was devised by a German statistician Paasche in 1874. The weights of current year are used as base year in constructing the Paasche’s Index number. Dorbish & Bowleys Method This method is a combination of Laspeyre’s and Paasche’s methods. If we find out the arithmetic average of Laspeyre’s and Paasche’s index we get the index suggested by Dorbish & Bowley. Marshall Edgeworth formula P₀₁ = Ʃp₁q₀+ Ʃp₁q₁ x 100 Ʃp₀q₀ + Ʃp₀q₁ P₀₁ =Ʃp₁q₀ x 100 Ʃp₀q₀ P₀₁ =Ʃp₁q₁ x 100 Ʃp₀q₁ P₀₁ =1 Ʃp₁q₀+ Ʃp₁q₁ x 100 2 Ʃp₀q₀ Ʃp₀q₁
  • 16.
    Example :Given beloware the price quantity data. Find- (1) Laspeyers Index (2) Paasche’s Index (3) Drobisch –Bowely and (4) Marshall Edgeworth formula. Commodity 2006 2007 A Price p Quantity q Price p Quantity q B 4 50 3 10 C 10 40 8 8 2006 2007 p₀q₀ p₀q₁ p₁q₀ p₁q₁ p₀ q₀ p₁ q₁ A 8 50 20 40 400 320 1000 800 B 6 10 18 2 60 12 180 36 C 4 5 8 2 20 8 40 16 Total 480 340 1220 852 Ʃp₀q₀ Ʃp₀q₁ Ʃp₁q₀ Ʃp₁q₁ Solution:
  • 17.
    Laspeyre: P₀₁ =Ʃp₁q₀ x100 =1220 x 100 =254.2 Ʃp₀q 480 Paasche: P₀₁ =Ʃp₁q₁ x 100 =852 x 100 = 250.6 Ʃp₀q₁ 340 Drobisch- Bowley P₀₁ =1 Ʃp₁q₀+ Ʃp₁q₁ x 100 = 1 1220+ 852 x 100 = 252.4 2 Ʃp₀q₀ Ʃp₀q₁ 2 480 340 Marshall Edgeworth formula P₀₁ = Ʃp₁q₀+ Ʃp₁q₁ x 100 = 1220+ 852 x 100 =252.7 Ʃp₀q₀ + Ʃp₀q₁ 480 + 340
  • 18.
    Why Fisher Indexis called Ideal Index Number The Fisher Price Index, also called the Fisher’s Ideal Price Index, is a consumer price index (CPI) used to measure the price level of goods and services over a given period. The Fisher Price Index is a geometric average of the Laspeyres Price Index and the Paasche Price Index. It is deemed the “ideal” price index as it corrects the positive price bias in the Laspeyres Price Index and the negative price bias in the Paasche Price Index.
  • 19.
    Unit End Questions 1.What is Index Numbers? State their uses and limitations. State the various problems involved in the construction of Index Numbers of prices. 2. State and explain Fisher’s Ideal formula for price index numbers. Show how it satisfies the time reversal and factor reversal tests. Why is it little used in practice? 3. What are Index numbers? Mention their characteristics? 4. From the following data obtain the Fisher’s Ideal Index Number- Rice Wheat Barley Year Price p Quantity q Price p Quantity q Price p Quantity q 1997 14 50 31 10 12 15 2007 10 50 8 18 14 4
  • 20.
    Required Readings B.L.Aggrawal (2009).Basic Statistics. New Age International Publisher, Delhi. Gupta, S.C.(1990) Fundamentals of Statistics. Himalaya Publishing House, Mumbai Elhance, D.N: Fundamental of Statistics Singhal, M.L: Elements of Statistics Nagar, A.L. and Das, R.K.: Basic Statistics Croxton Cowden: Applied General Statistics Nagar, K.N.: Sankhyiki ke mool tatva Gupta, BN : Sankhyiki https://images.app.goo.gl/f6B2j9y115cTVYEg7 https://images.app.goo.gl/8jK1yVnpUBqFPZcY9