Introduction to Index Numbers in Conceptual Approach.pptx
1.
Theory of IndexNumbers
Price Statistics Division
Ministry of Statistics & Programme Implementation
2.
Overview
Concepts &Definitions of Index Numbers.
Use of Index Numbers.
Concept of Price
Comparison of different Index Formulae
Economic Interpretations of Price Indices
3.
Definition
“Index numbers arespecialized averages which are
designed to measure the relative change in a group
of related variables with respect to time,
geographical location or other characteristics such
as income, profession etc.”
4.
Uses of IndexNumbers
Help in framing suitable economic policies
Reveal trends and tendencies
Use in forecasting future economic activities
Use as a deflator/Inflator
5.
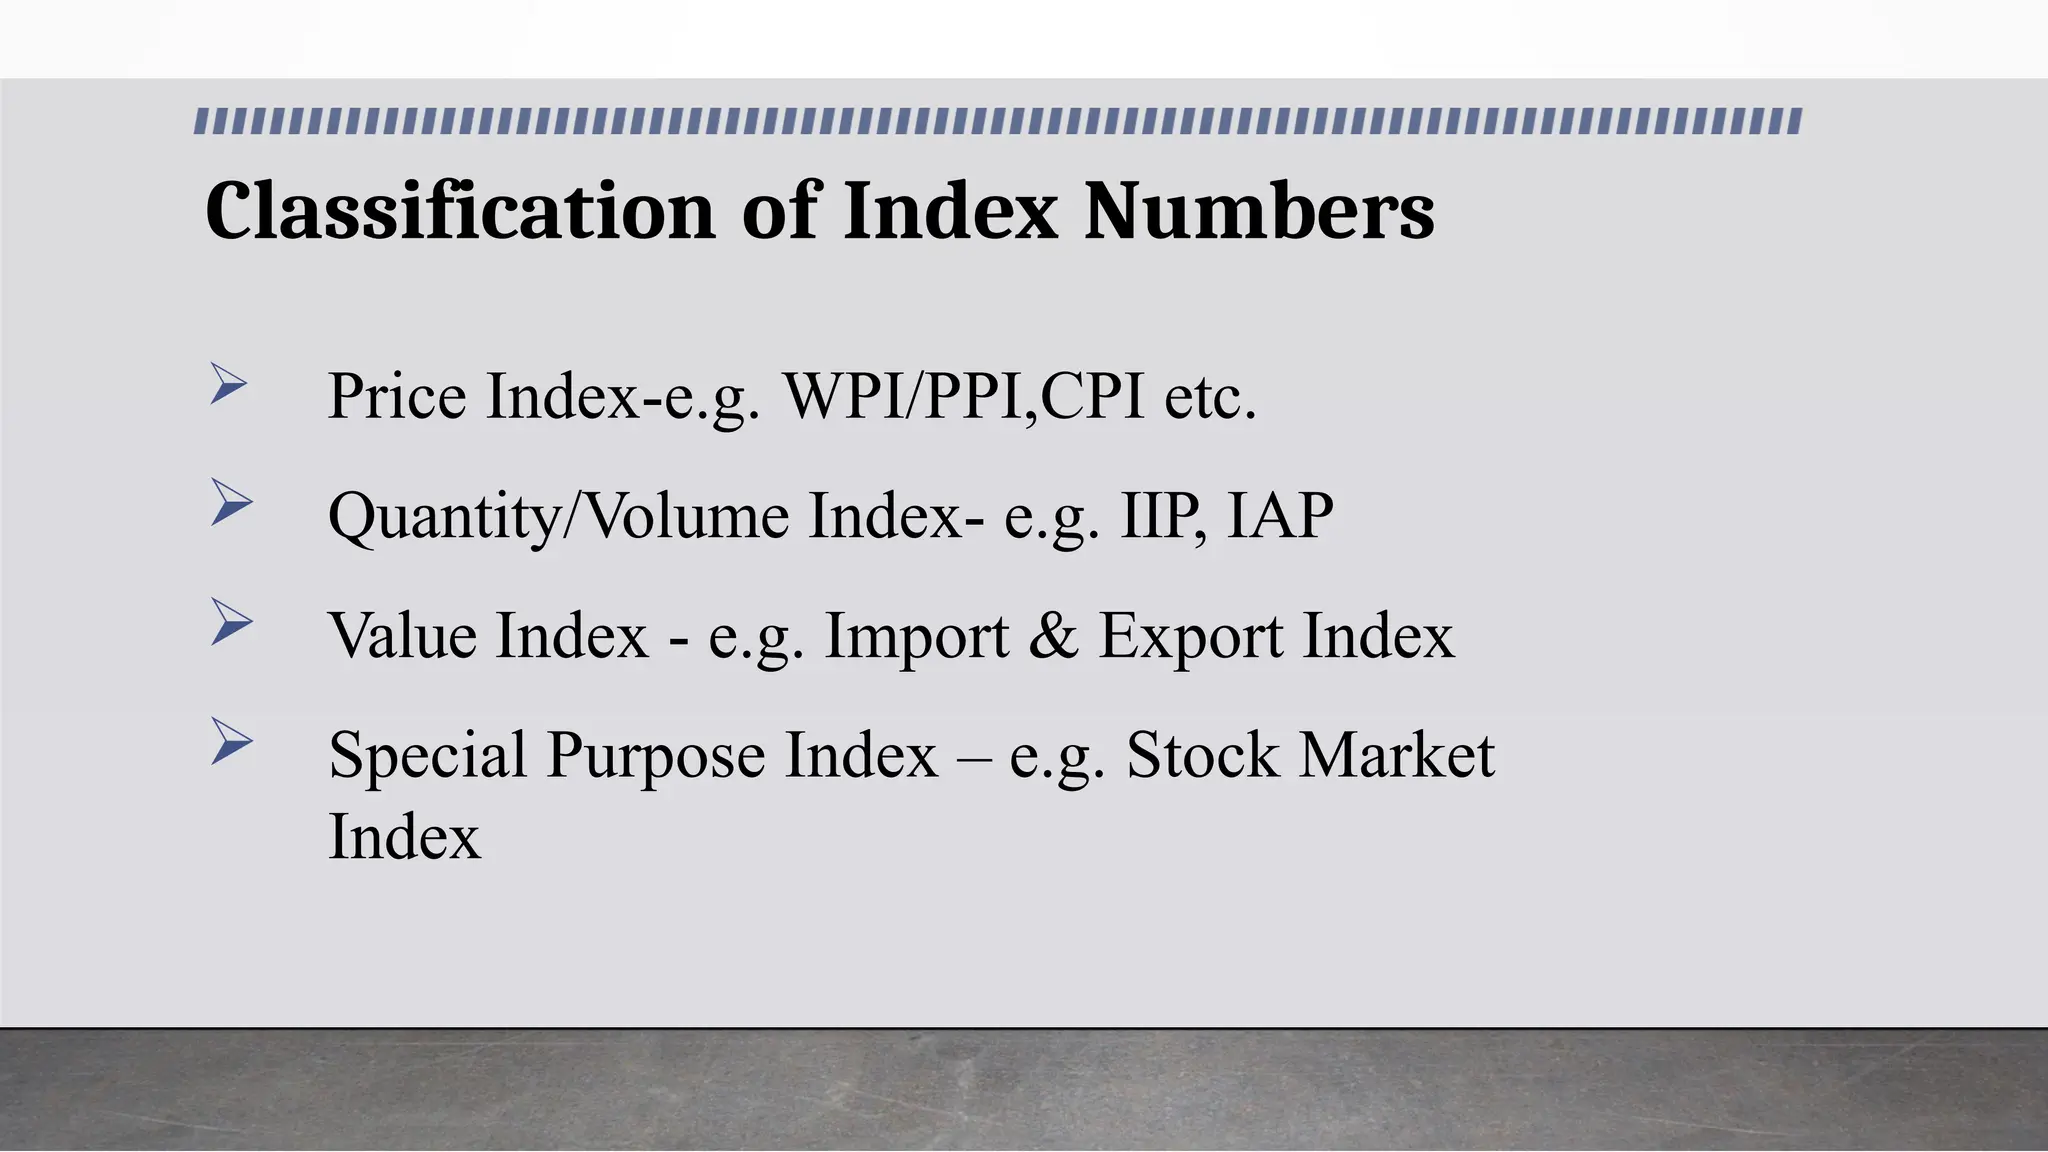
Classification of IndexNumbers
Price Index-e.g. WPI/PPI,CPI etc.
Quantity/Volume Index- e.g. IIP, IAP
Value Index - e.g. Import & Export Index
Special Purpose Index – e.g. Stock Market
Index
6.
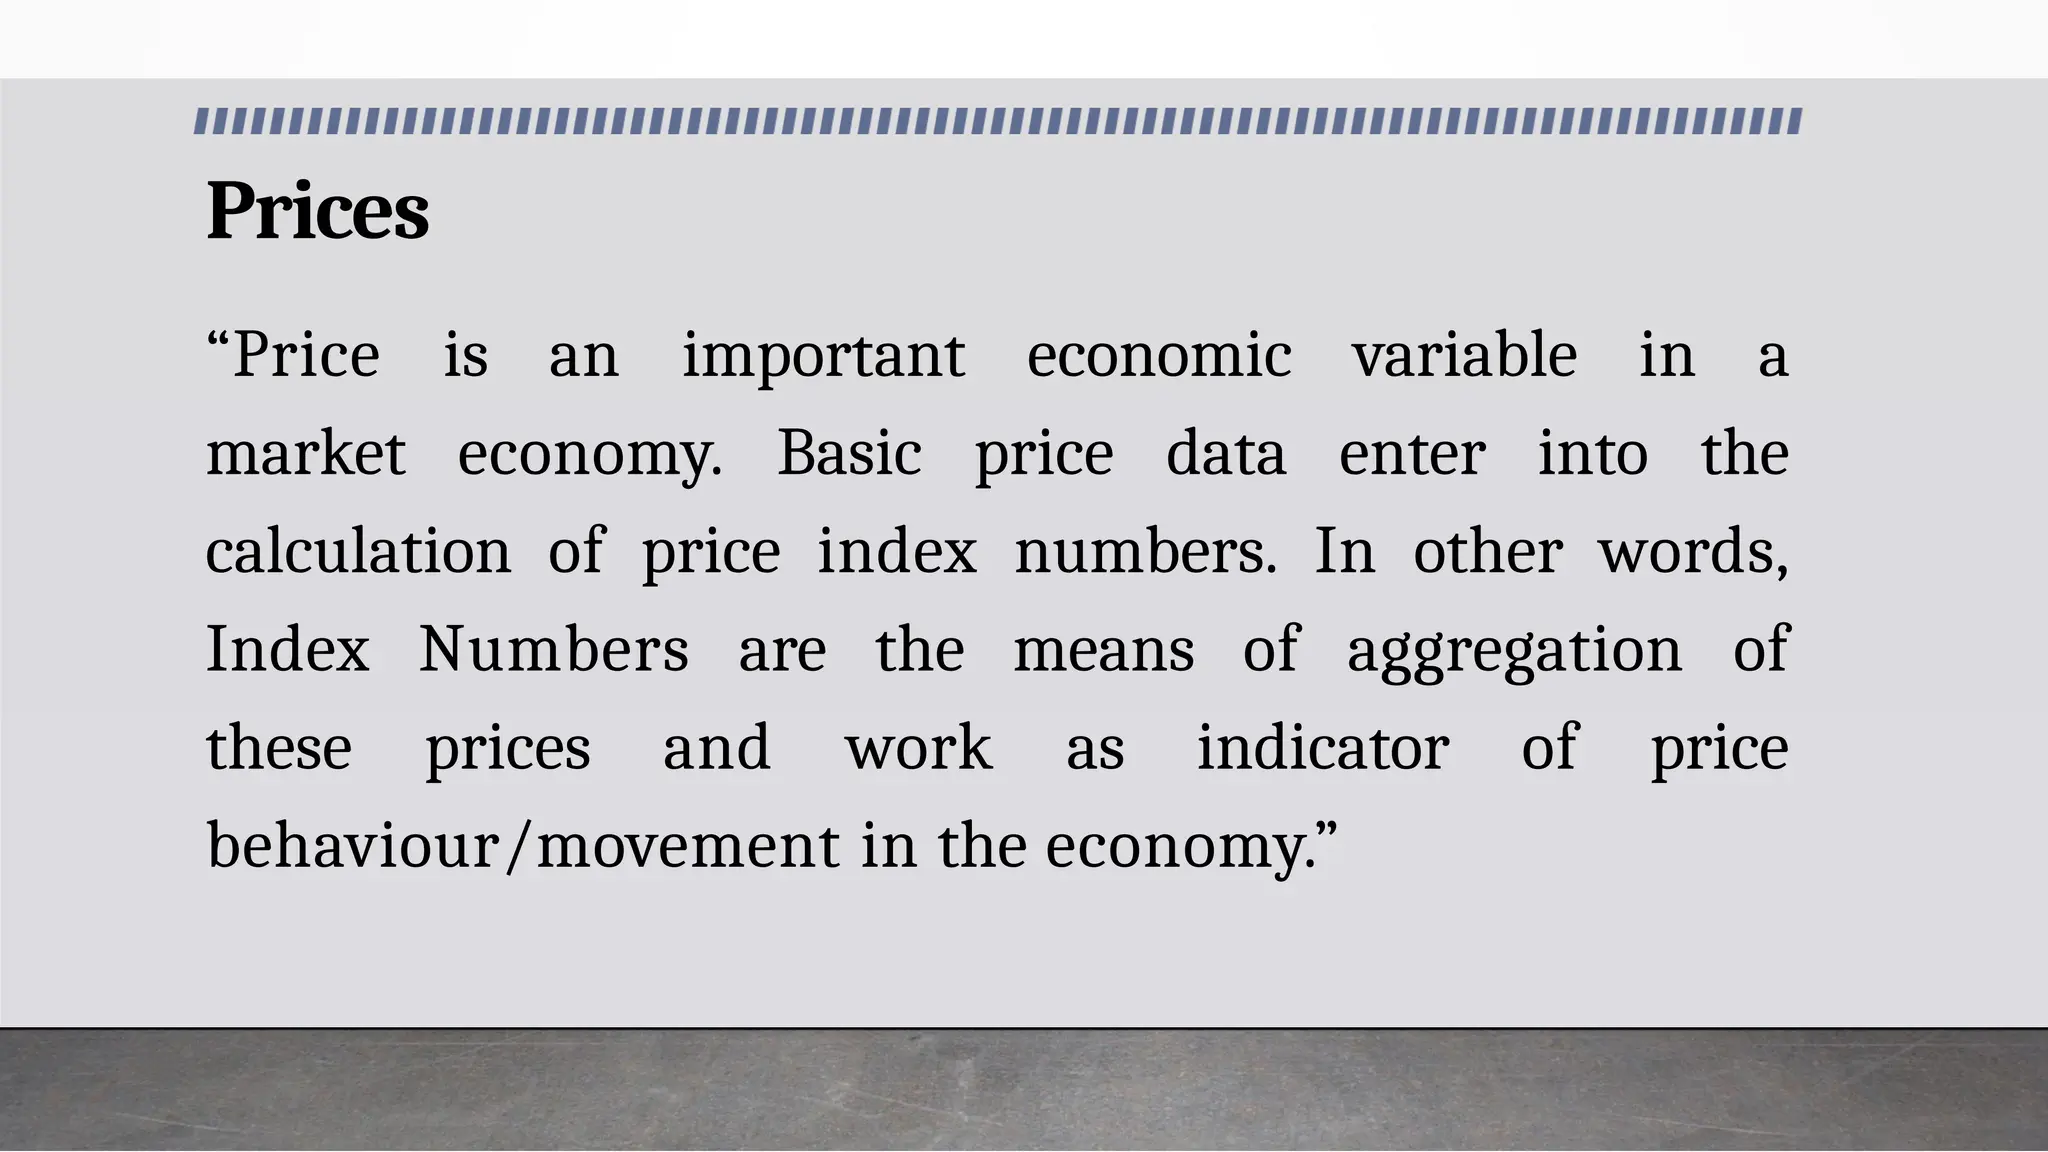
Prices
“Price is animportant economic variable in a
market economy. Basic price data enter into the
calculation of price index numbers. In other words,
Index Numbers are the means of aggregation of
these prices and work as indicator of price
behaviour/movement in the economy.”
7.
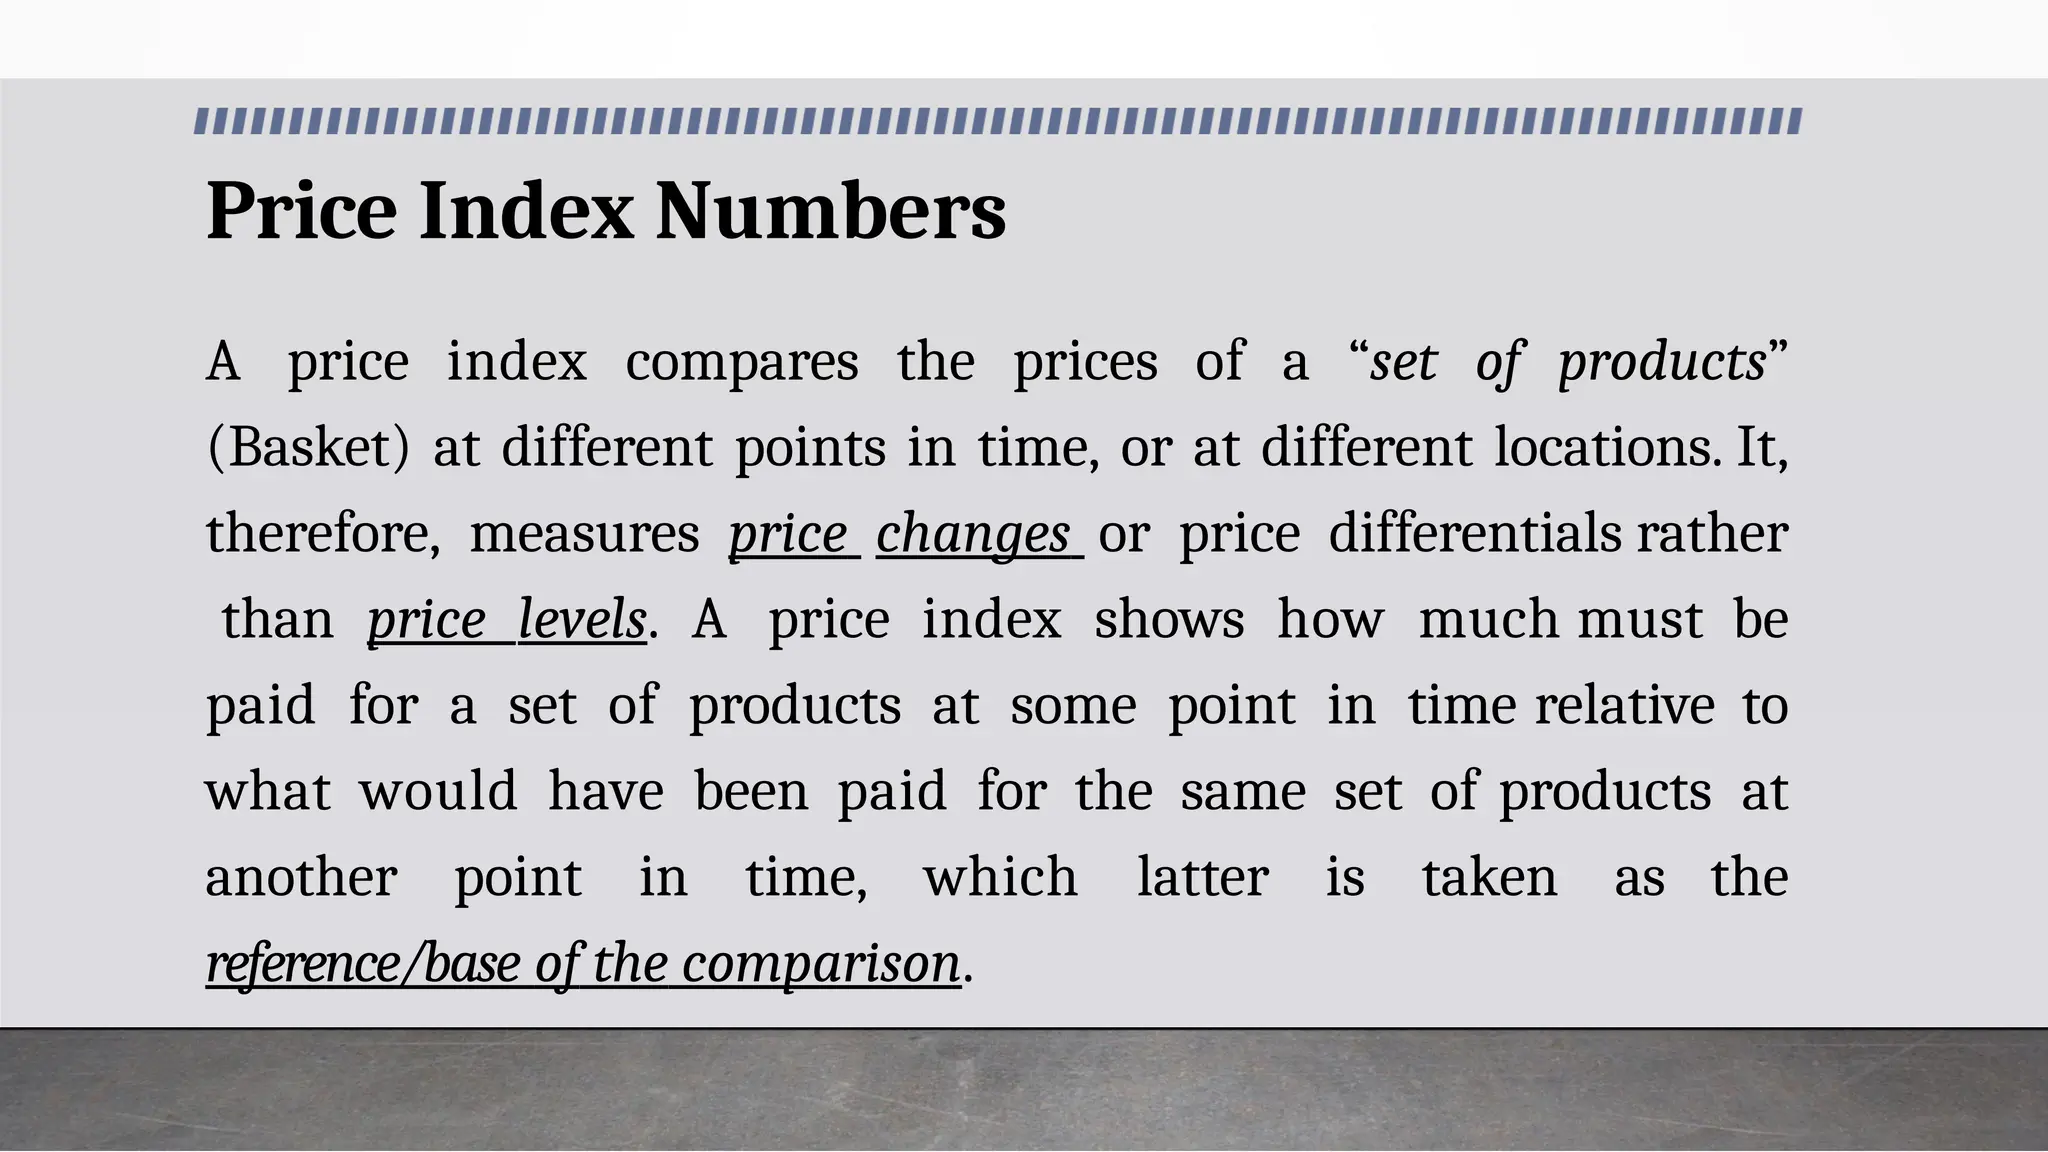
Price Index Numbers
Aprice index compares the prices of a “set of products”
(Basket) at different points in time, or at different locations. It,
therefore, measures price changes or price differentials rather
than price levels. A price index shows how much must be
paid for a set of products at some point in time relative to
what would have been paid for the same set of products at
another point in time, which latter is taken as the
reference/base of the comparison.
8.
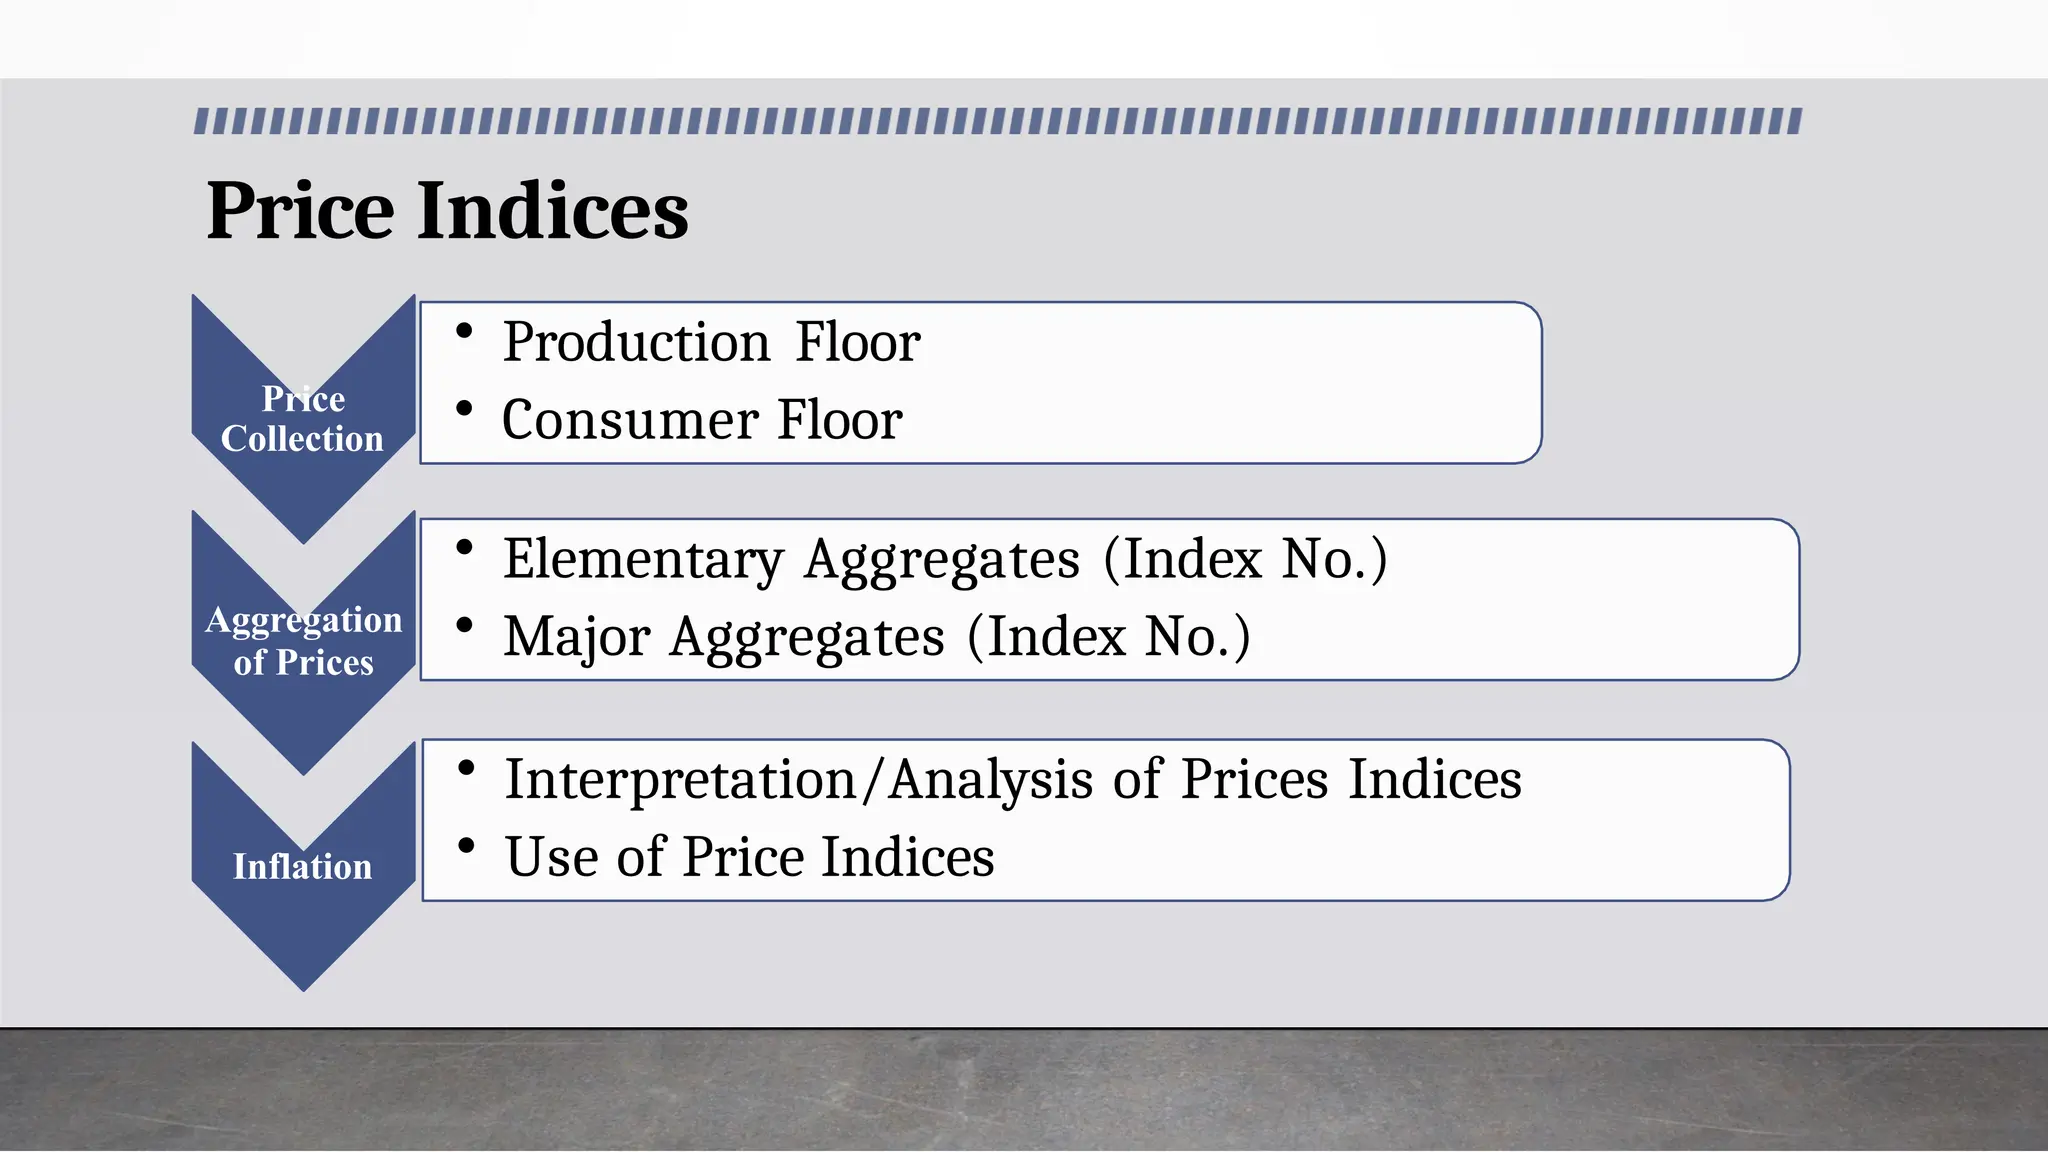
Price Indices
Collection
• ProductionFloor
Price • Consumer Floor
Aggregation
of Prices
• Elementary Aggregates (Index No.)
• Major Aggregates (Index No.)
Inflation
• Interpretation/Analysis of Prices Indices
• Use of Price Indices
9.
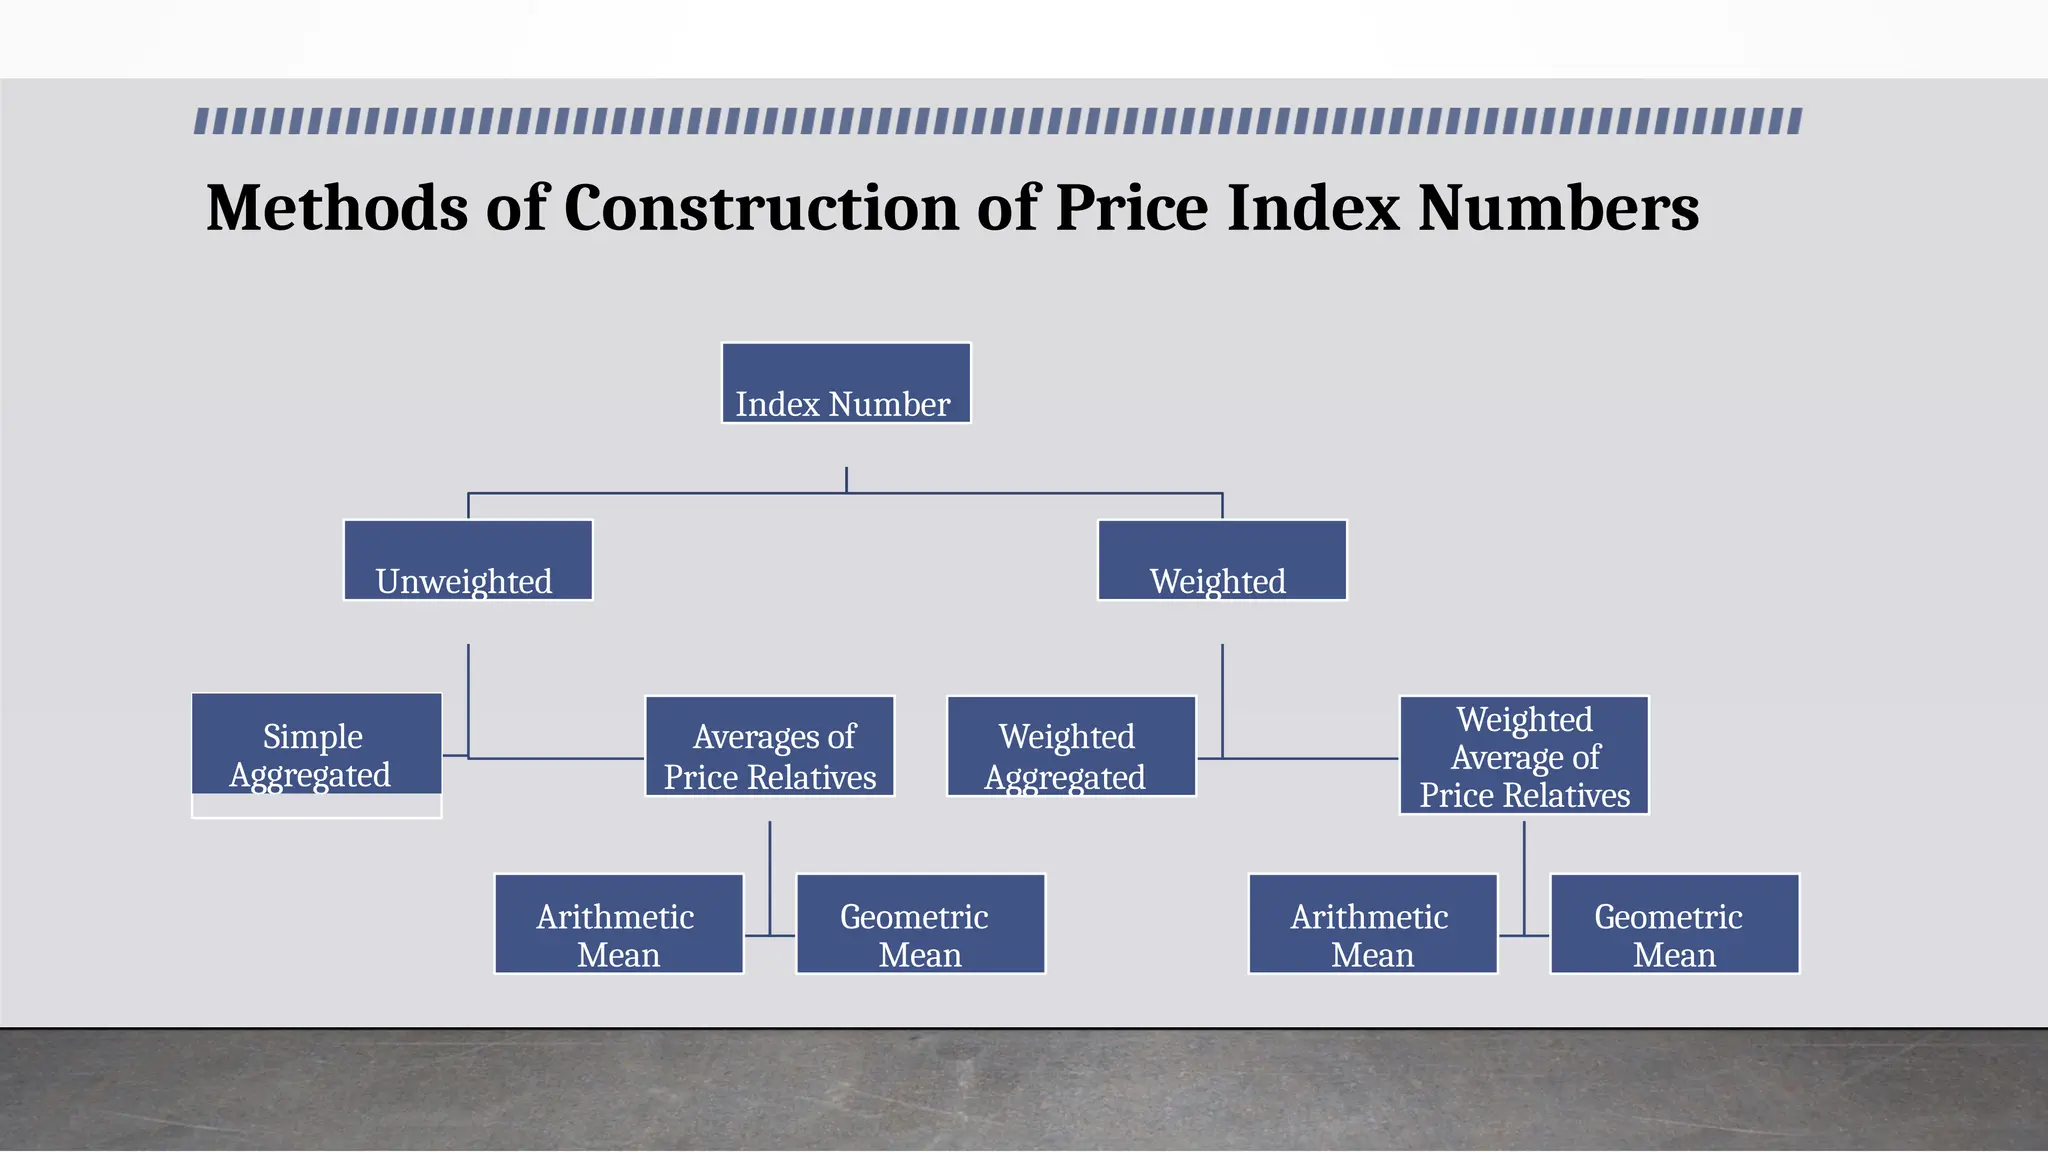
Methods of Constructionof Price Index Numbers
Index Number
Unweighted
Simple
Aggregated
Averages of
Price Relatives
Arithmetic
Mean
Geometric
Mean
Weighted
Weighted
Aggregated
Weighted
Average of
Price Relatives
Arithmetic
Mean
Geometric
Mean
10.
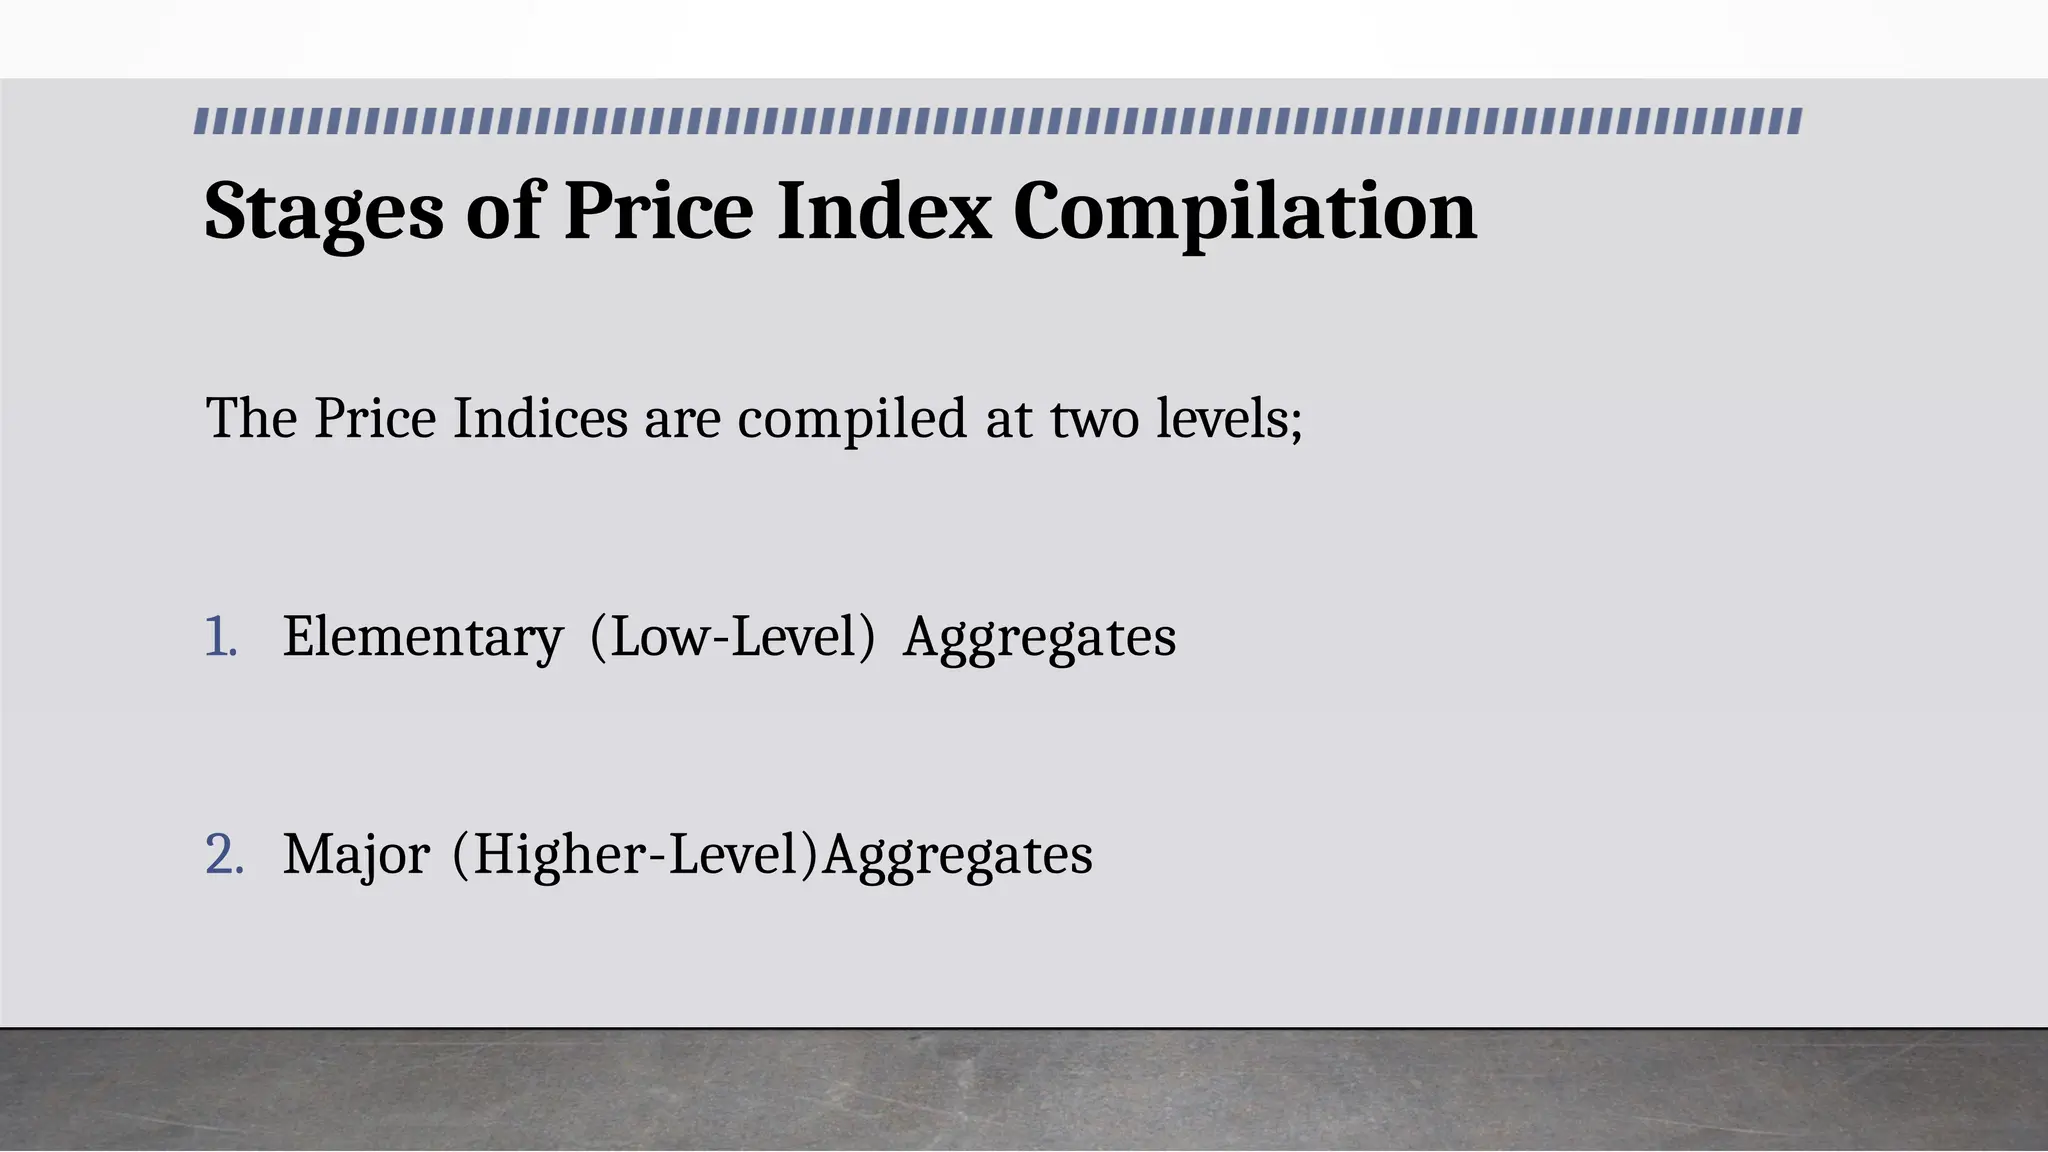
Stages of PriceIndex Compilation
The Price Indices are compiled at two levels;
1. Elementary (Low-Level) Aggregates
2. Major (Higher-Level)Aggregates
11.
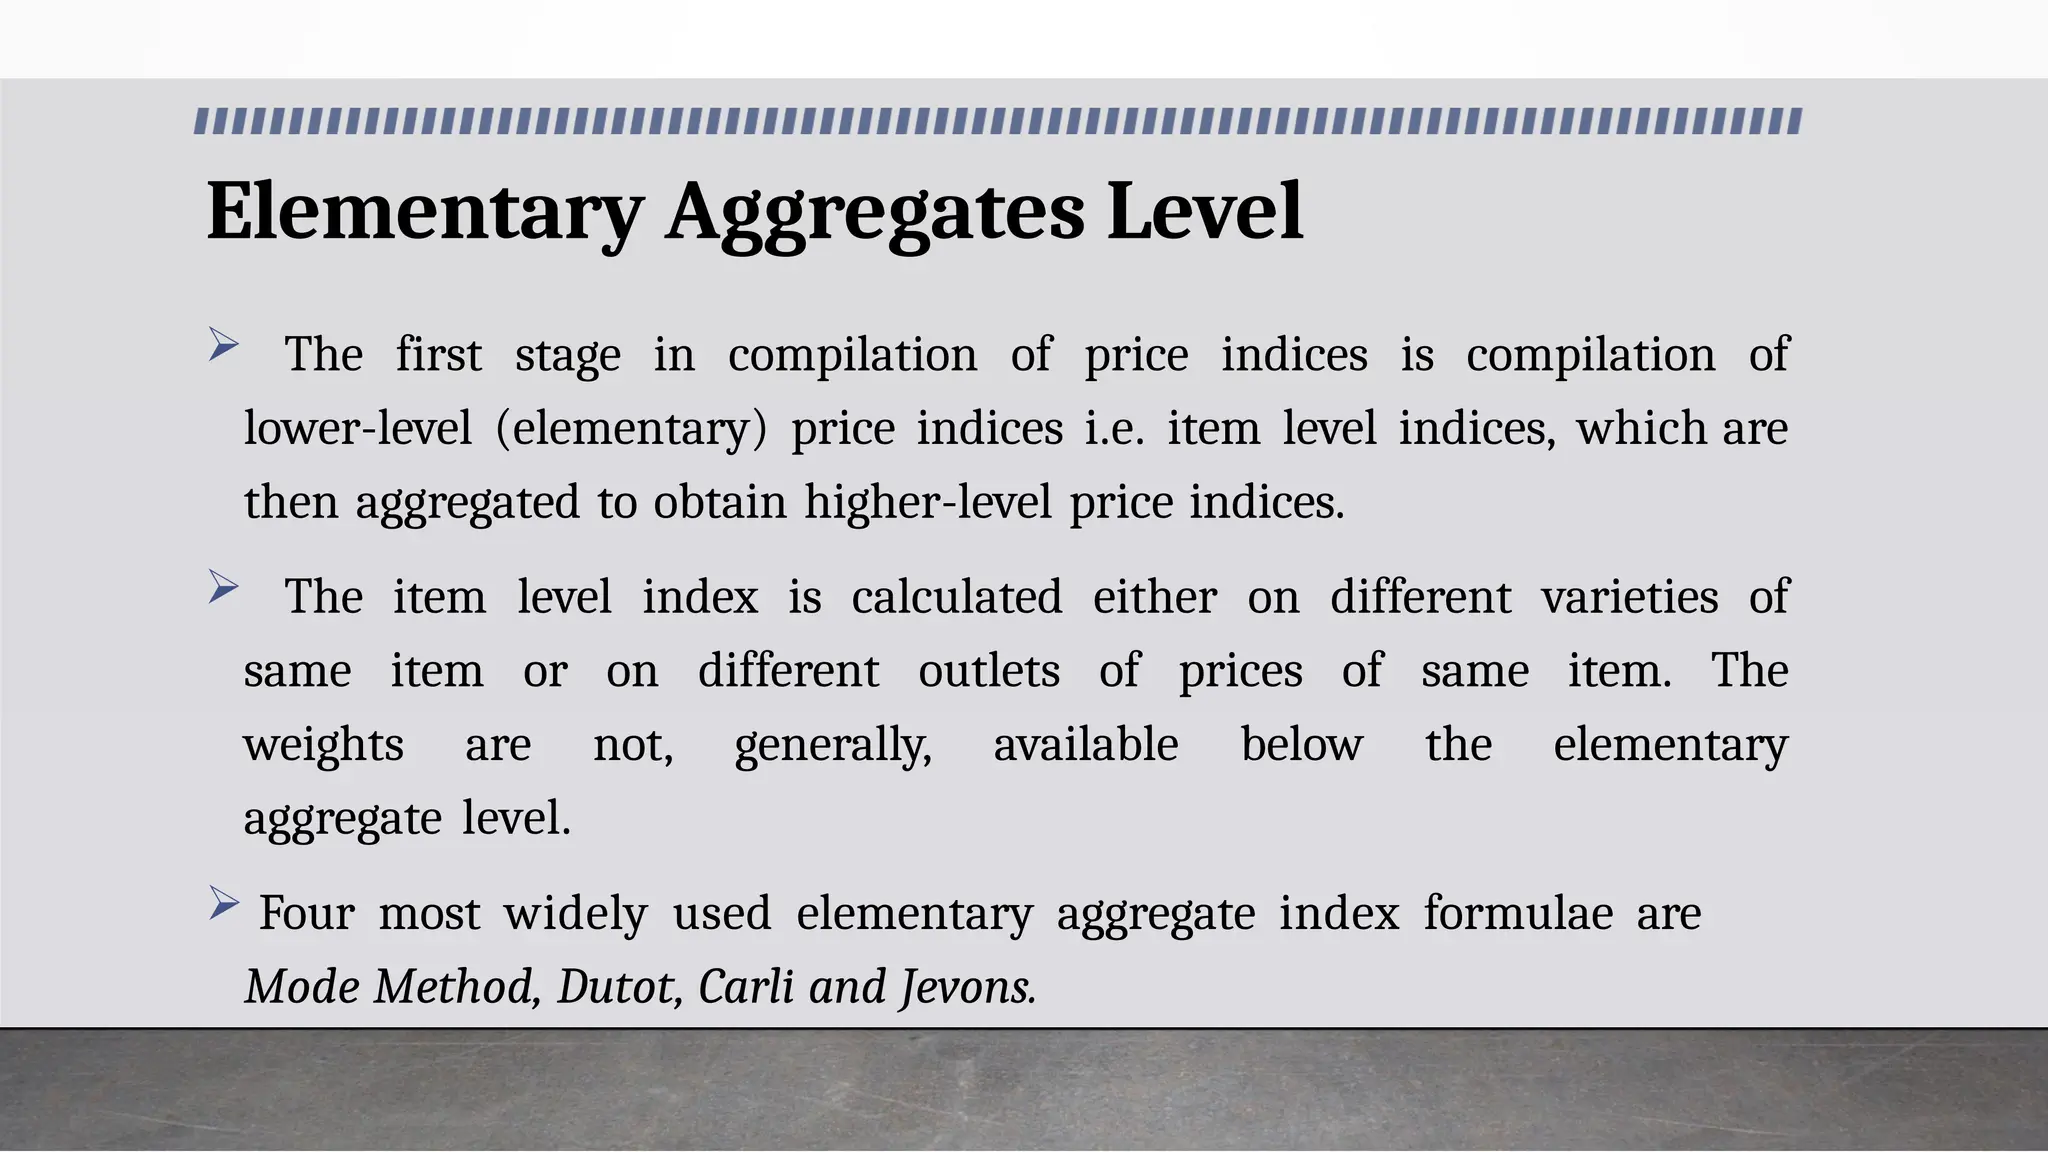
Elementary Aggregates Level
The first stage in compilation of price indices is compilation of
lower-level (elementary) price indices i.e. item level indices, which are
then aggregated to obtain higher-level price indices.
The item level index is calculated either on different varieties of
same item or on different outlets of prices of same item. The
weights are not, generally, available below the elementary
aggregate level.
Four most widely used elementary aggregate index formulae are
Mode Method, Dutot, Carli and Jevons.
12.
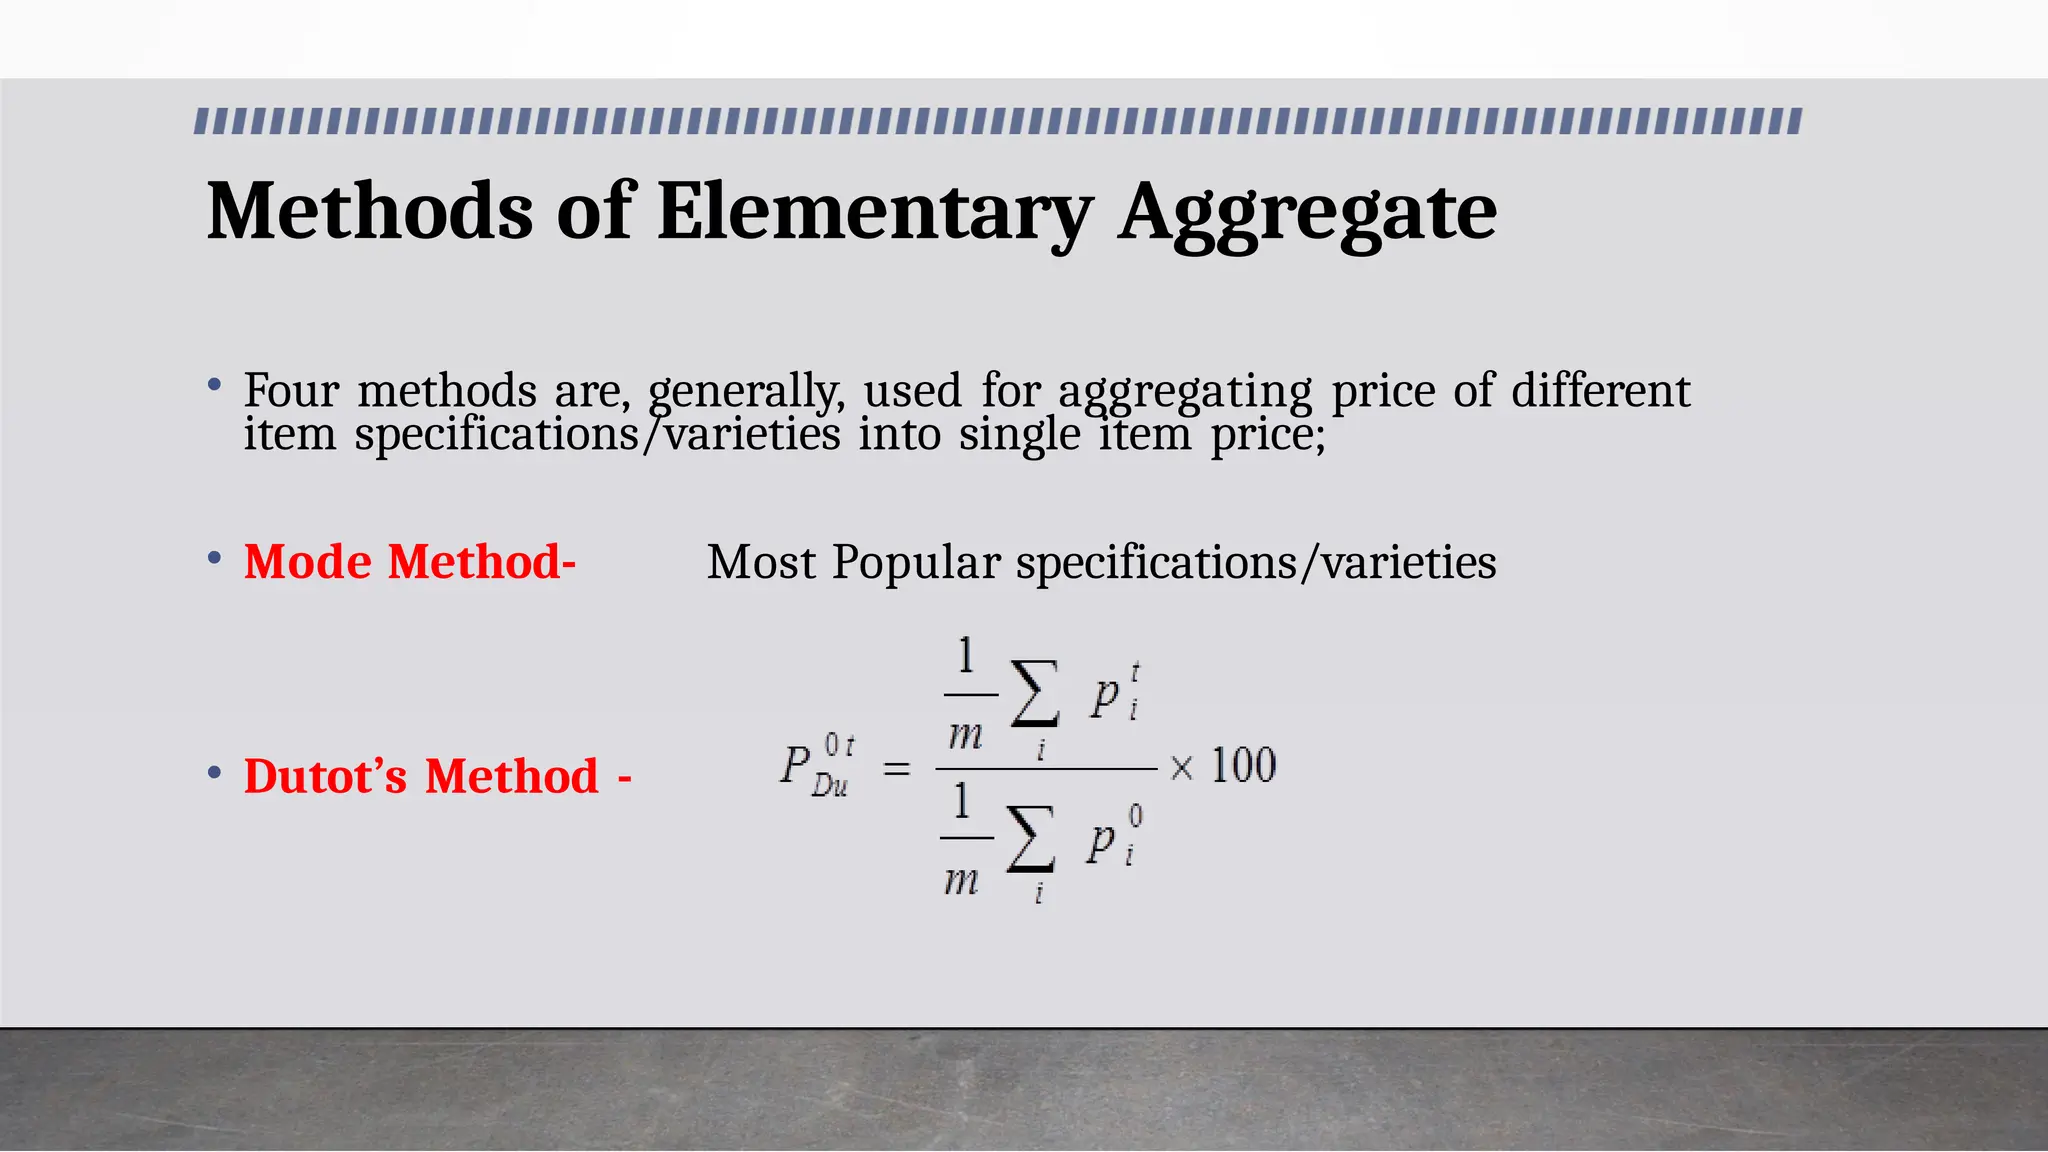
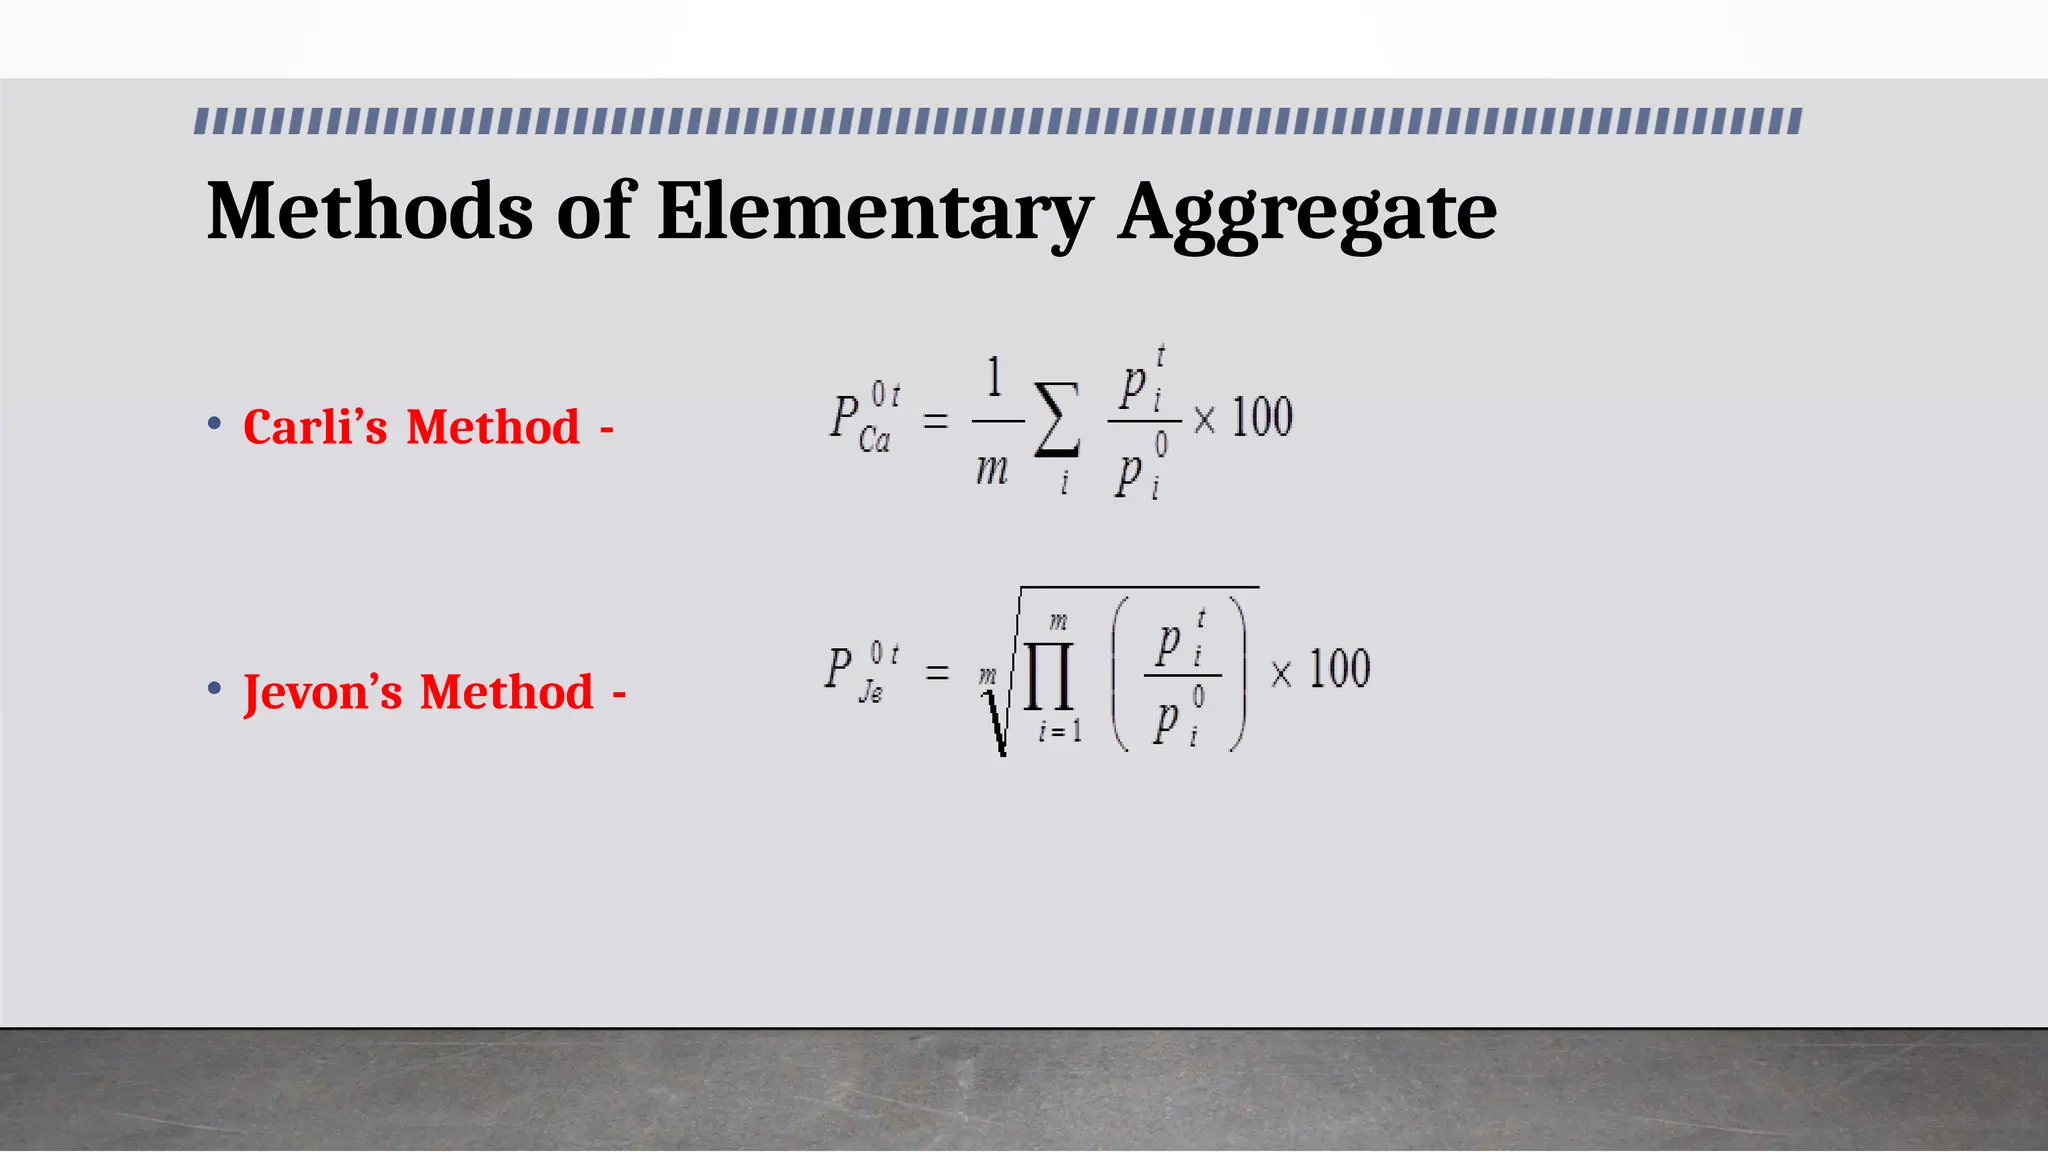
Methods of ElementaryAggregate
• Four methods are, generally, used for aggregating price of different
item specifications/varieties into single item price;
• Mode Method- Most Popular specifications/varieties
• Dutot’s Method -
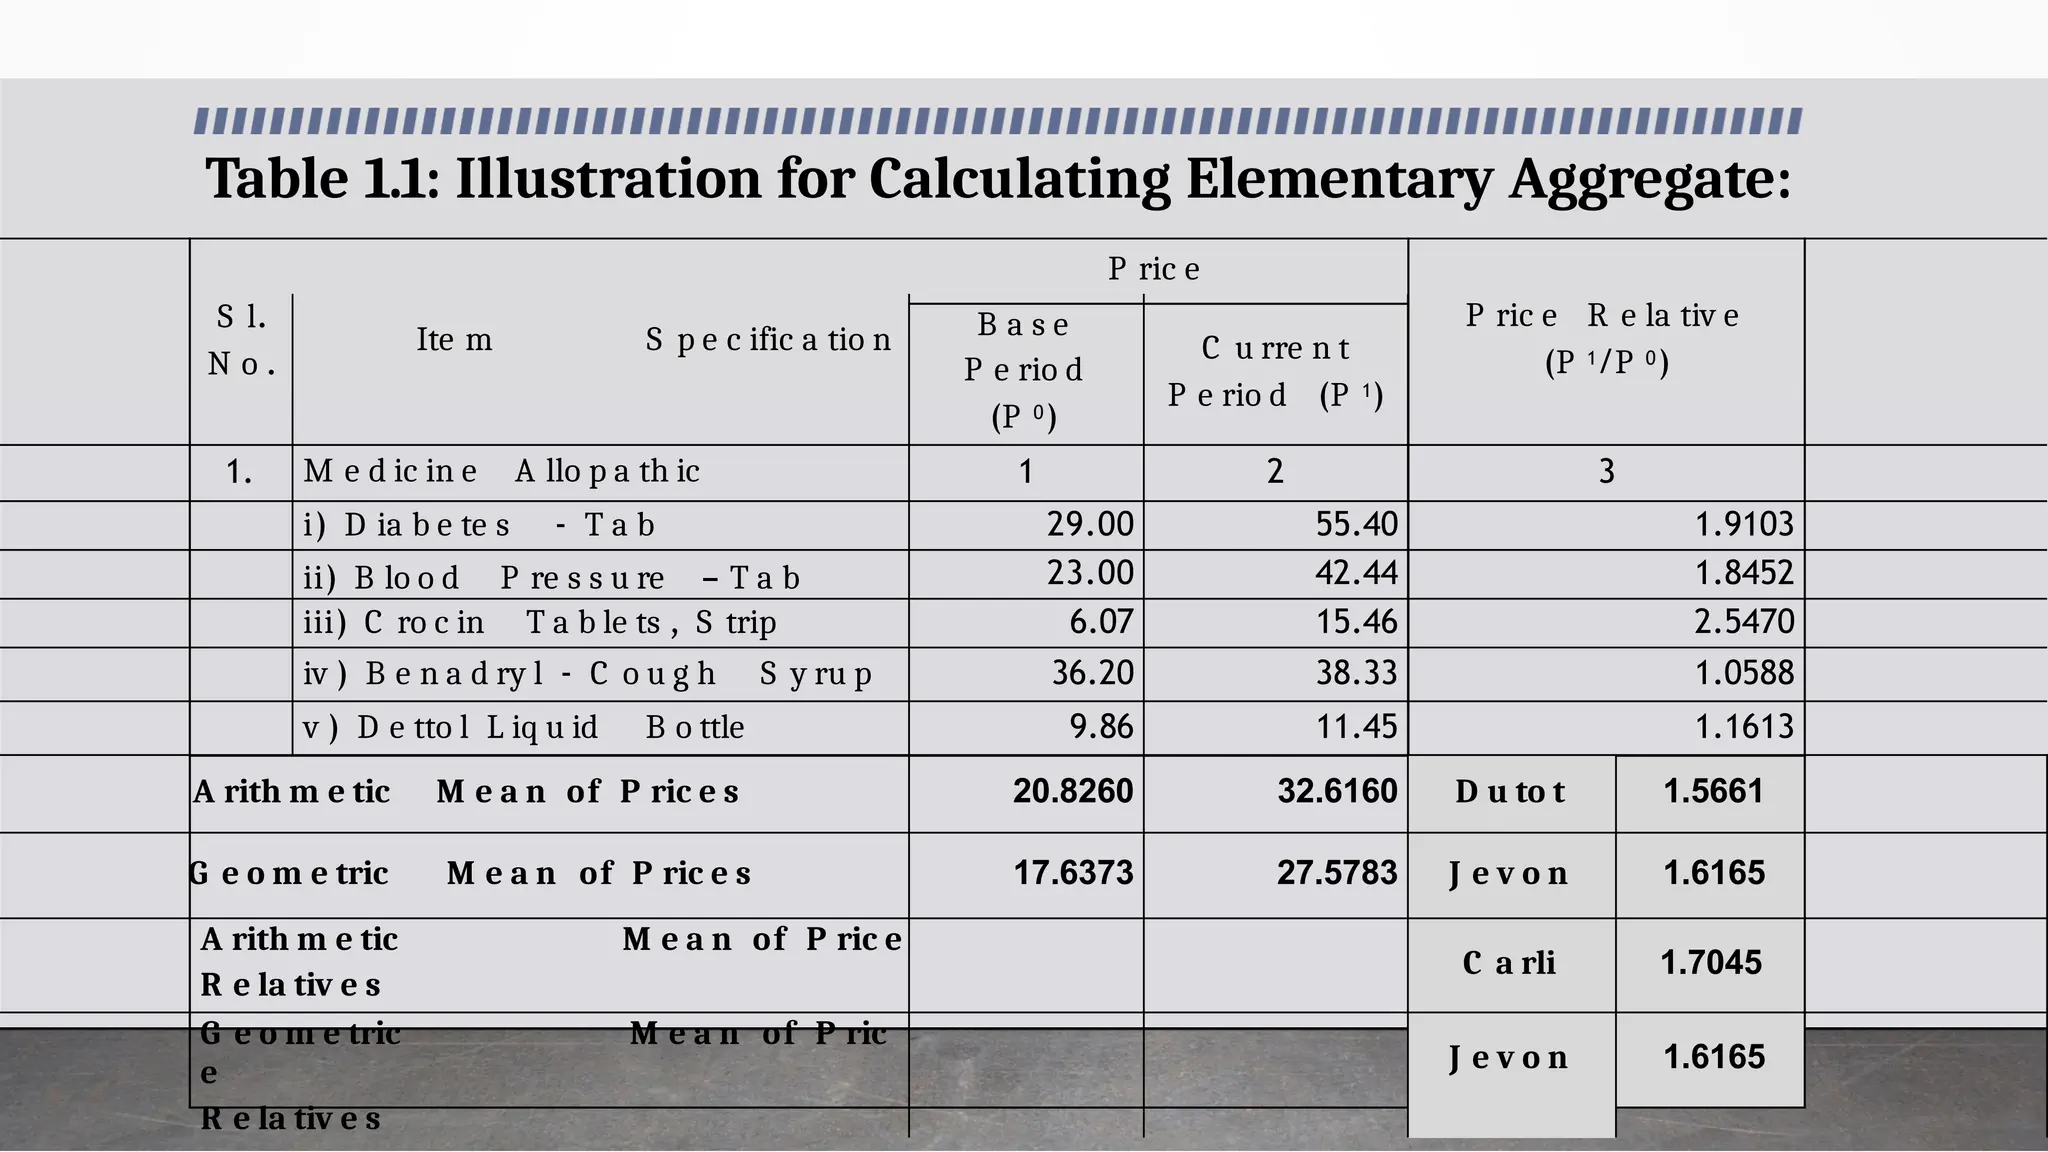
P ric e
Sl.
N o .
Ite m S p e c ific a tio n B a s e
P e rio d
(P 0)
C u rre n t
P e rio d (P 1)
P ric e R e la tiv e
(P 1/P 0)
1. M e d ic in e A llo p a th ic 1 2 3
i) D ia b e te s - T a b 29.00 55.40 1.9103
ii) B lo o d P re s s u re – T a b 23.00 42.44 1.8452
iii) C ro c in T a b le ts , S trip 6.07 15.46 2.5470
iv ) B e n a d ry l - C o u g h S y ru p 36.20 38.33 1.0588
v ) D e tto l L iq u id B o ttle 9.86 11.45 1.1613
A rith m e tic M e a n of P ric e s 20.8260 32.6160 D u to t 1.5661
G e o m e tric M e a n of P ric e s 17.6373 27.5783 J e v o n 1.6165
A rith m e tic M e a n of P ric e
R e la tiv e s
C a rli 1.7045
G e o m e tric M e a n of P ric
e
R e la tiv e s
J e v o n 1.6165
Table 1.1: Illustration for Calculating Elementary Aggregate:
15.
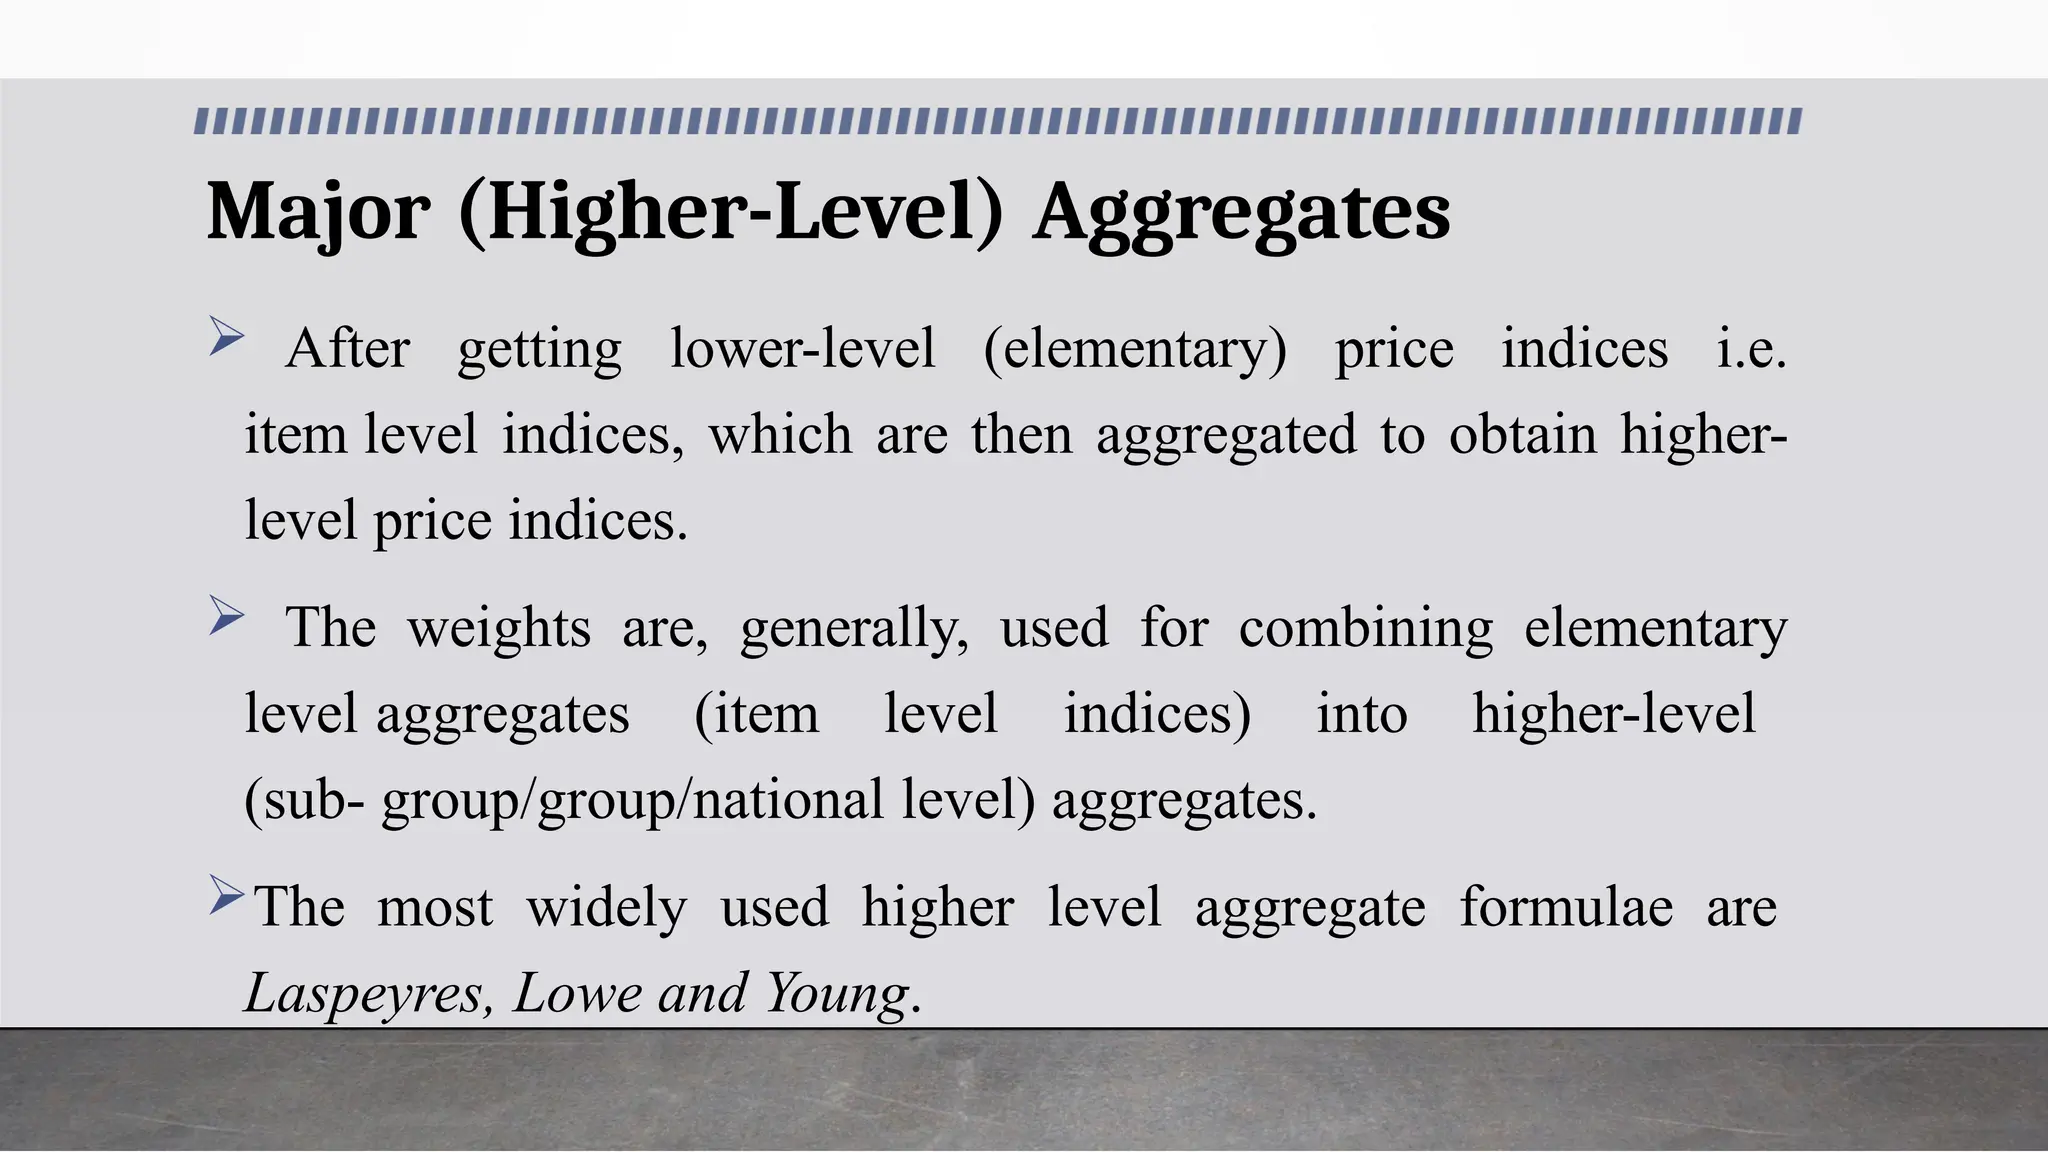
Major (Higher-Level) Aggregates
After getting lower-level (elementary) price indices i.e.
item level indices, which are then aggregated to obtain higher-
level price indices.
The weights are, generally, used for combining elementary
level aggregates (item level indices) into higher-level
(sub- group/group/national level) aggregates.
The most widely used higher level aggregate formulae are
Laspeyres, Lowe and Young.
16.
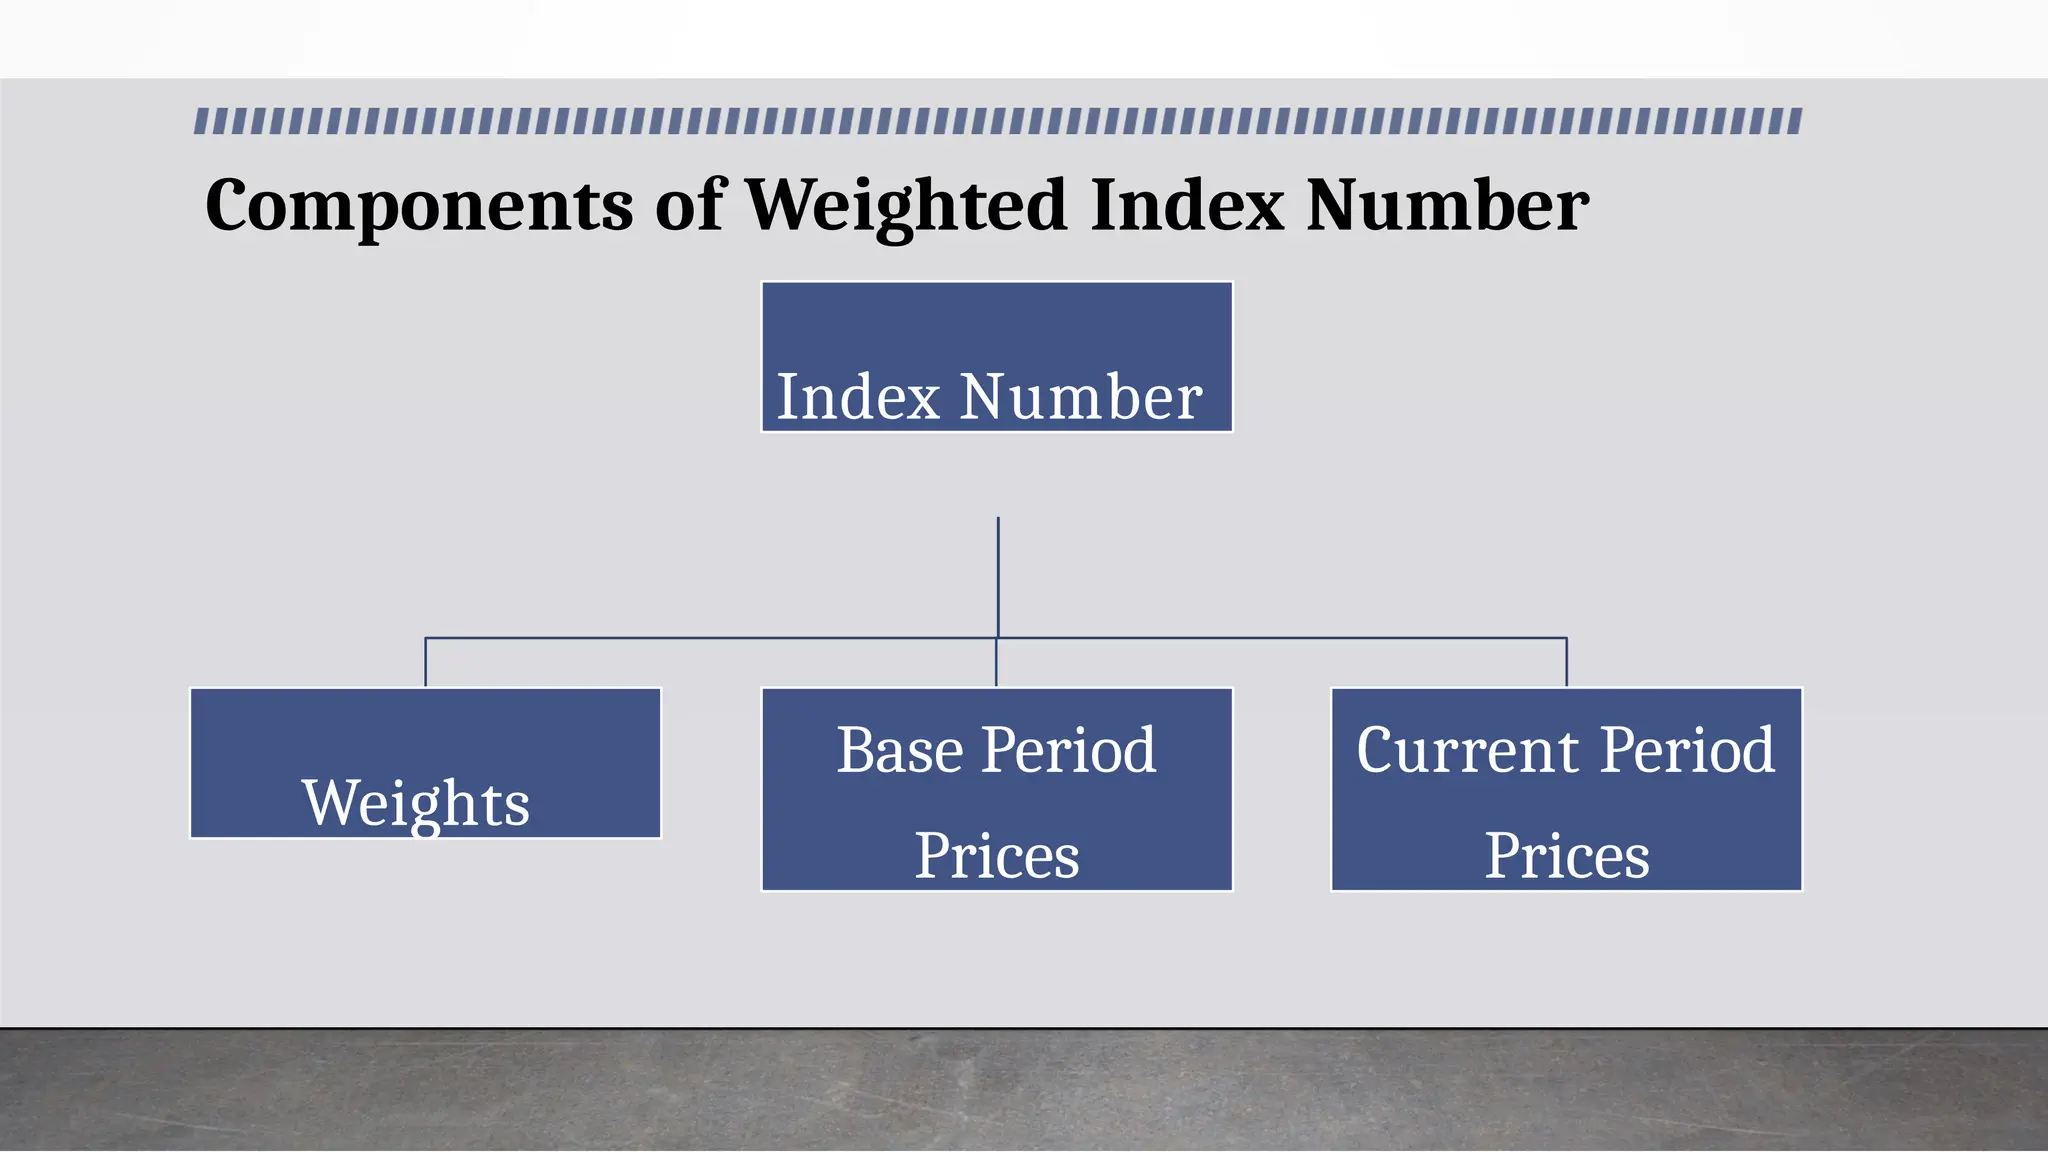
Components of WeightedIndex Number
Index Number
Weights
Base Period
Prices
Current Period
Prices
17.
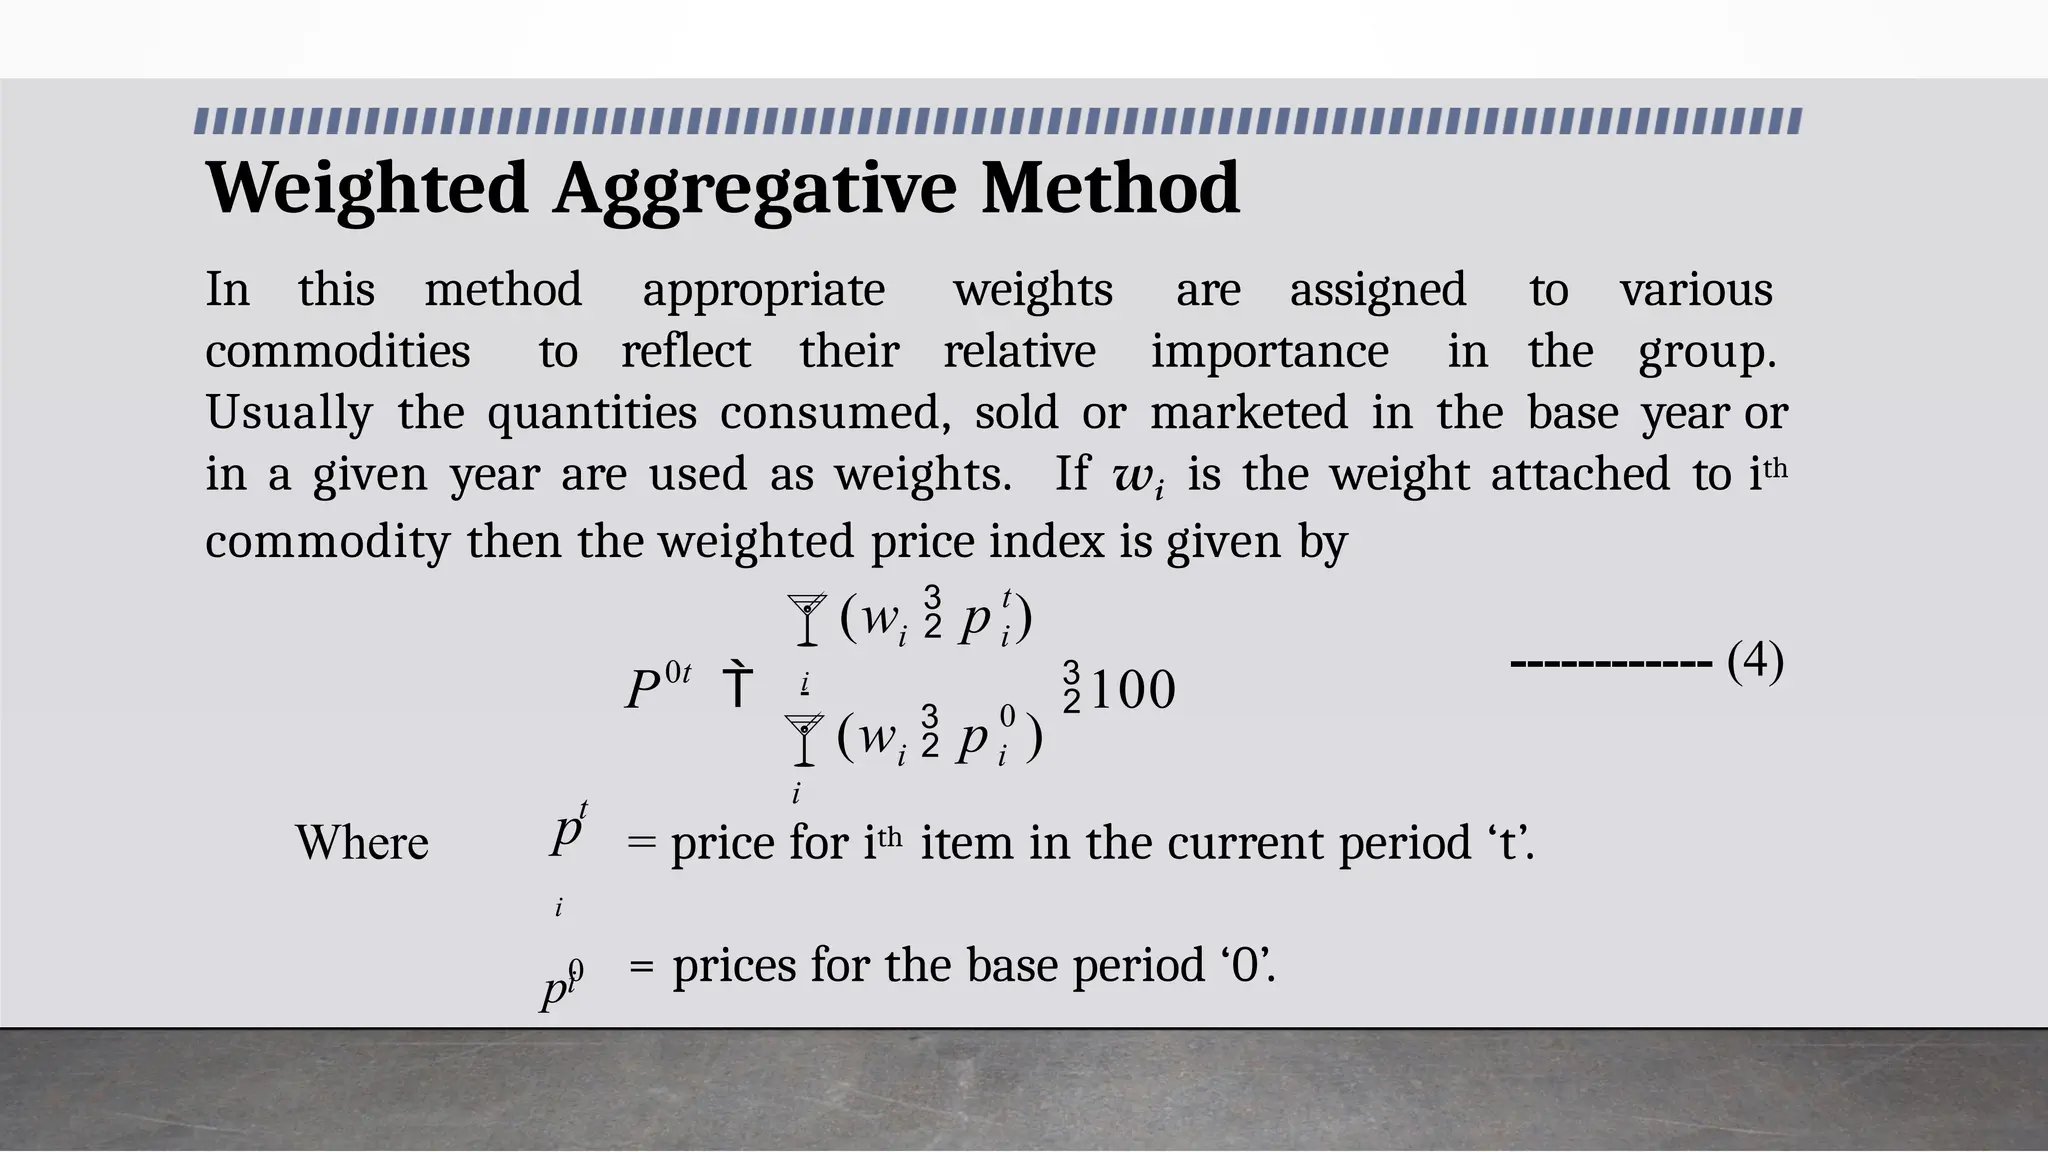
Weighted Aggregative Method
Inthis method appropriate weights are assigned
commodities to reflect their relative importance in
to various
the group.
Usually the quantities consumed, sold or marketed in the base year or
in a given year are used as weights. If wi is the weight attached to ith
commodity then the weighted price index is given by
------------ (4)
Where
= prices for the base period ‘0’.
0
i
= price for ith item in the current period ‘t’.
i i
t
i i
0t
(w p )
(w p )
P i
100
t
p
i
i
p0
18.
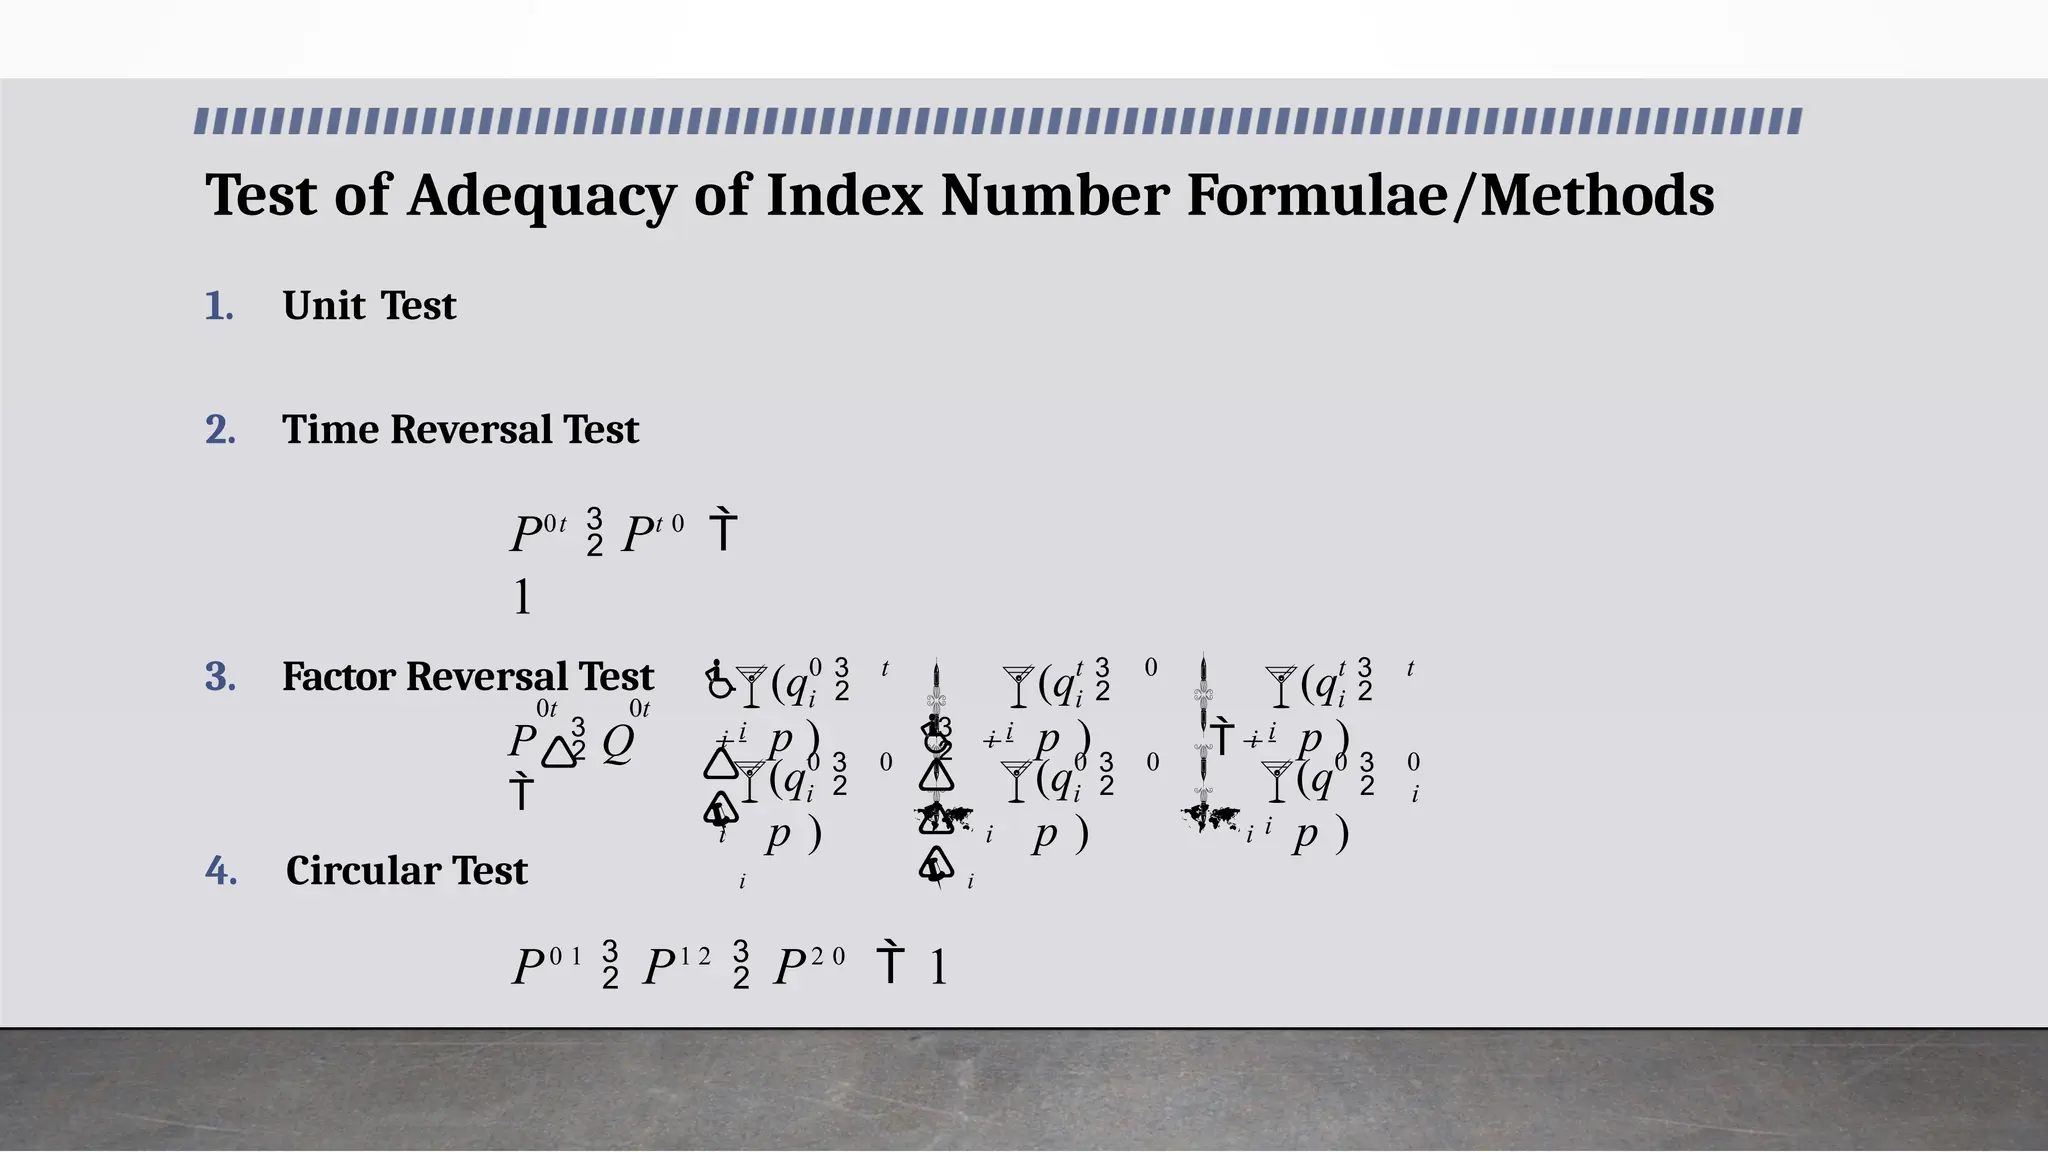
Test of Adequacyof Index Number Formulae/Methods
4. Circular Test
P0 1
P1 2
P2 0
1
i
i
i
i
t
t
i
i
i
i
i
i
t
i
i
i
i
i
i
t
i
i
P Q
(q
p )
(q
p )
(q
p )
(q
p )
(q
p )
(q
p ) 0
0
0
0
0
0
0
0
0t 0t
1. Unit Test
2. Time Reversal Test
P0t
Pt 0
1
3. Factor Reversal Test
19.
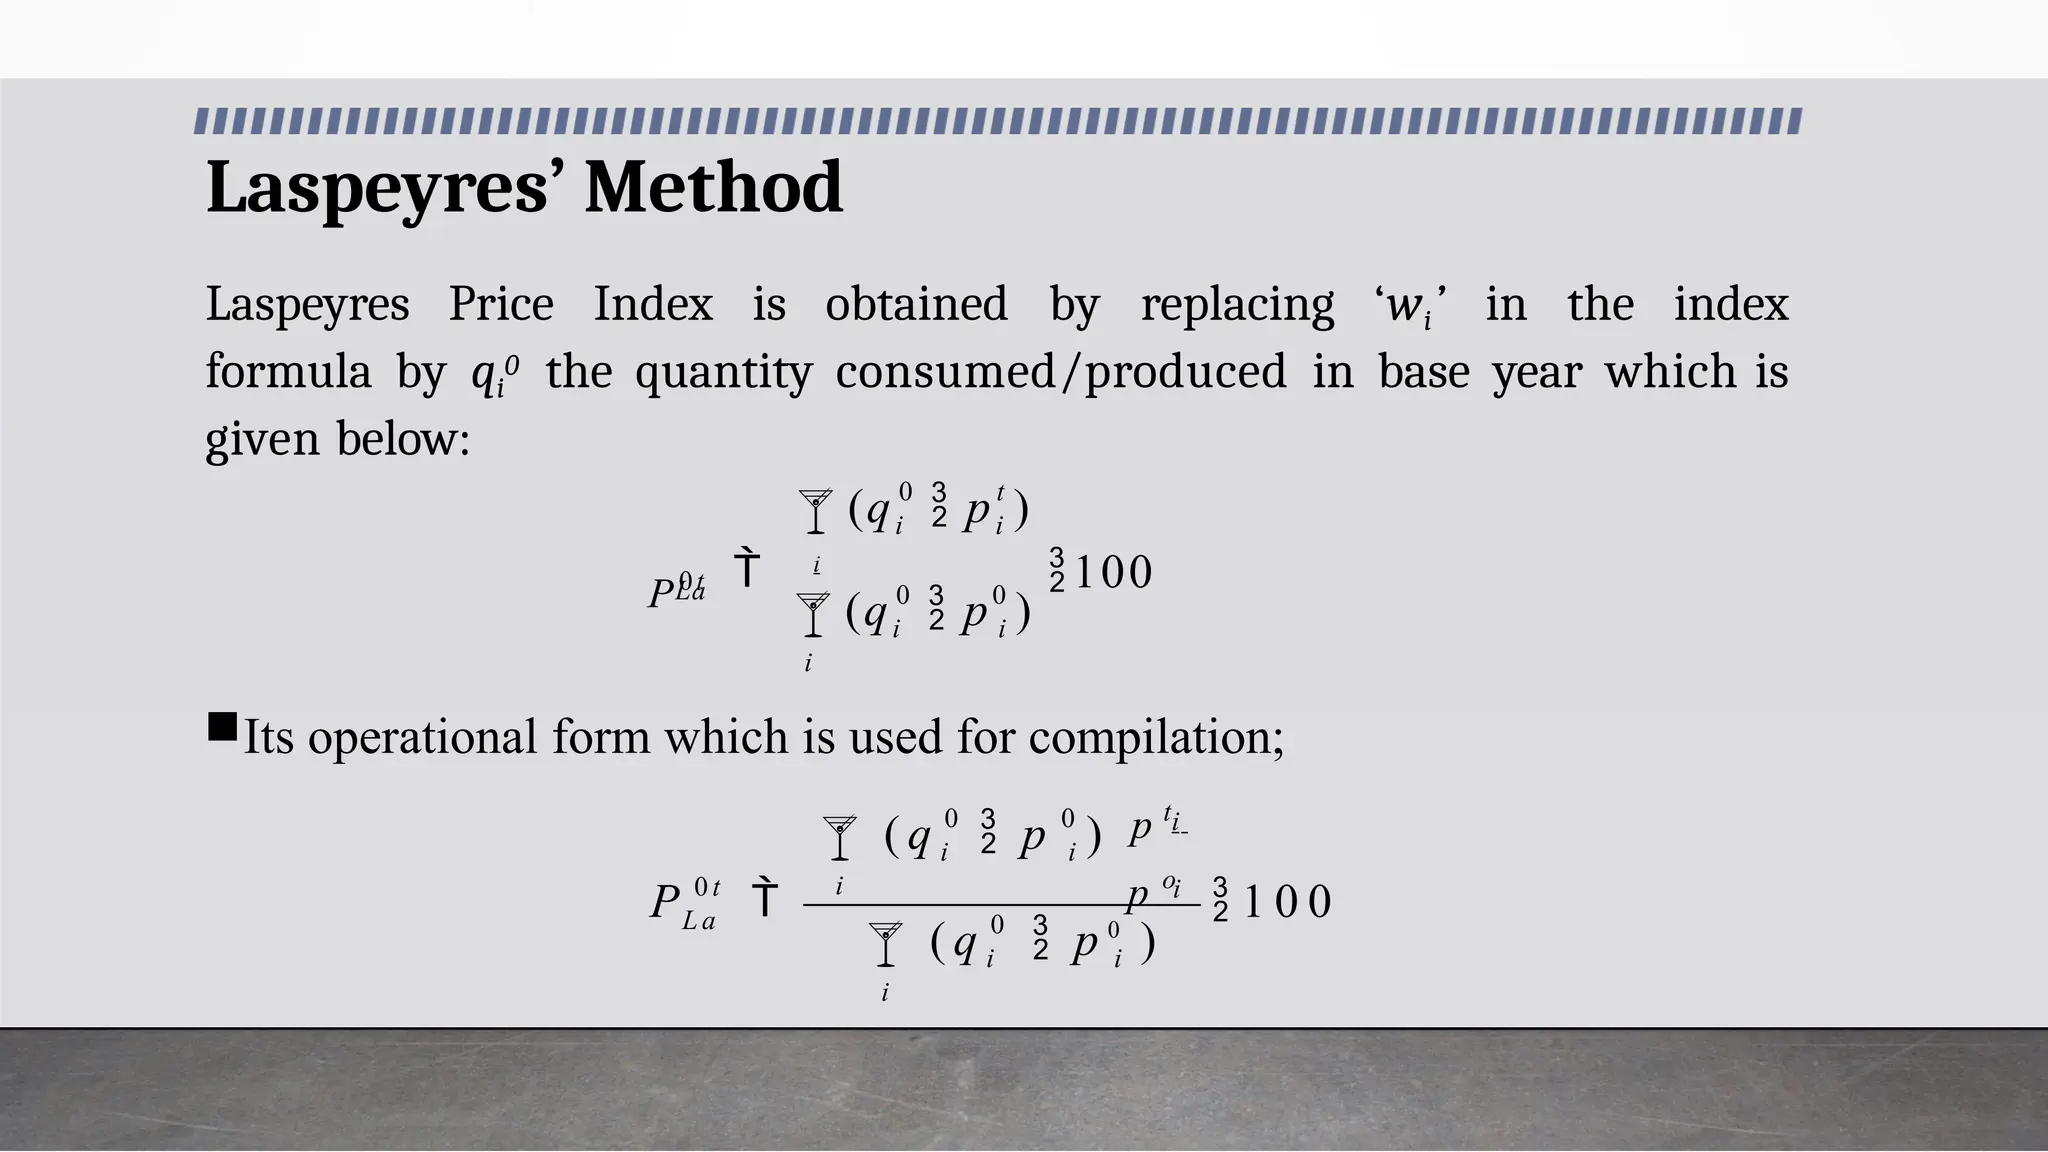
Laspeyres’ Method
Laspeyres PriceIndex is obtained by replacing ‘wi’ in the index
formula by qi
0 the quantity consumed/produced in base year which is
given below:
Its operational form which is used for compilation;
0
0
i
i
i
i
100
0 t
i
i
La
(q p )
(q p )
P0t
0
0 0
1 0 0
i
i i
i
i
i
i i
0 t
L a
( q p 0
)
p o
p t
p )
( q
P
20.
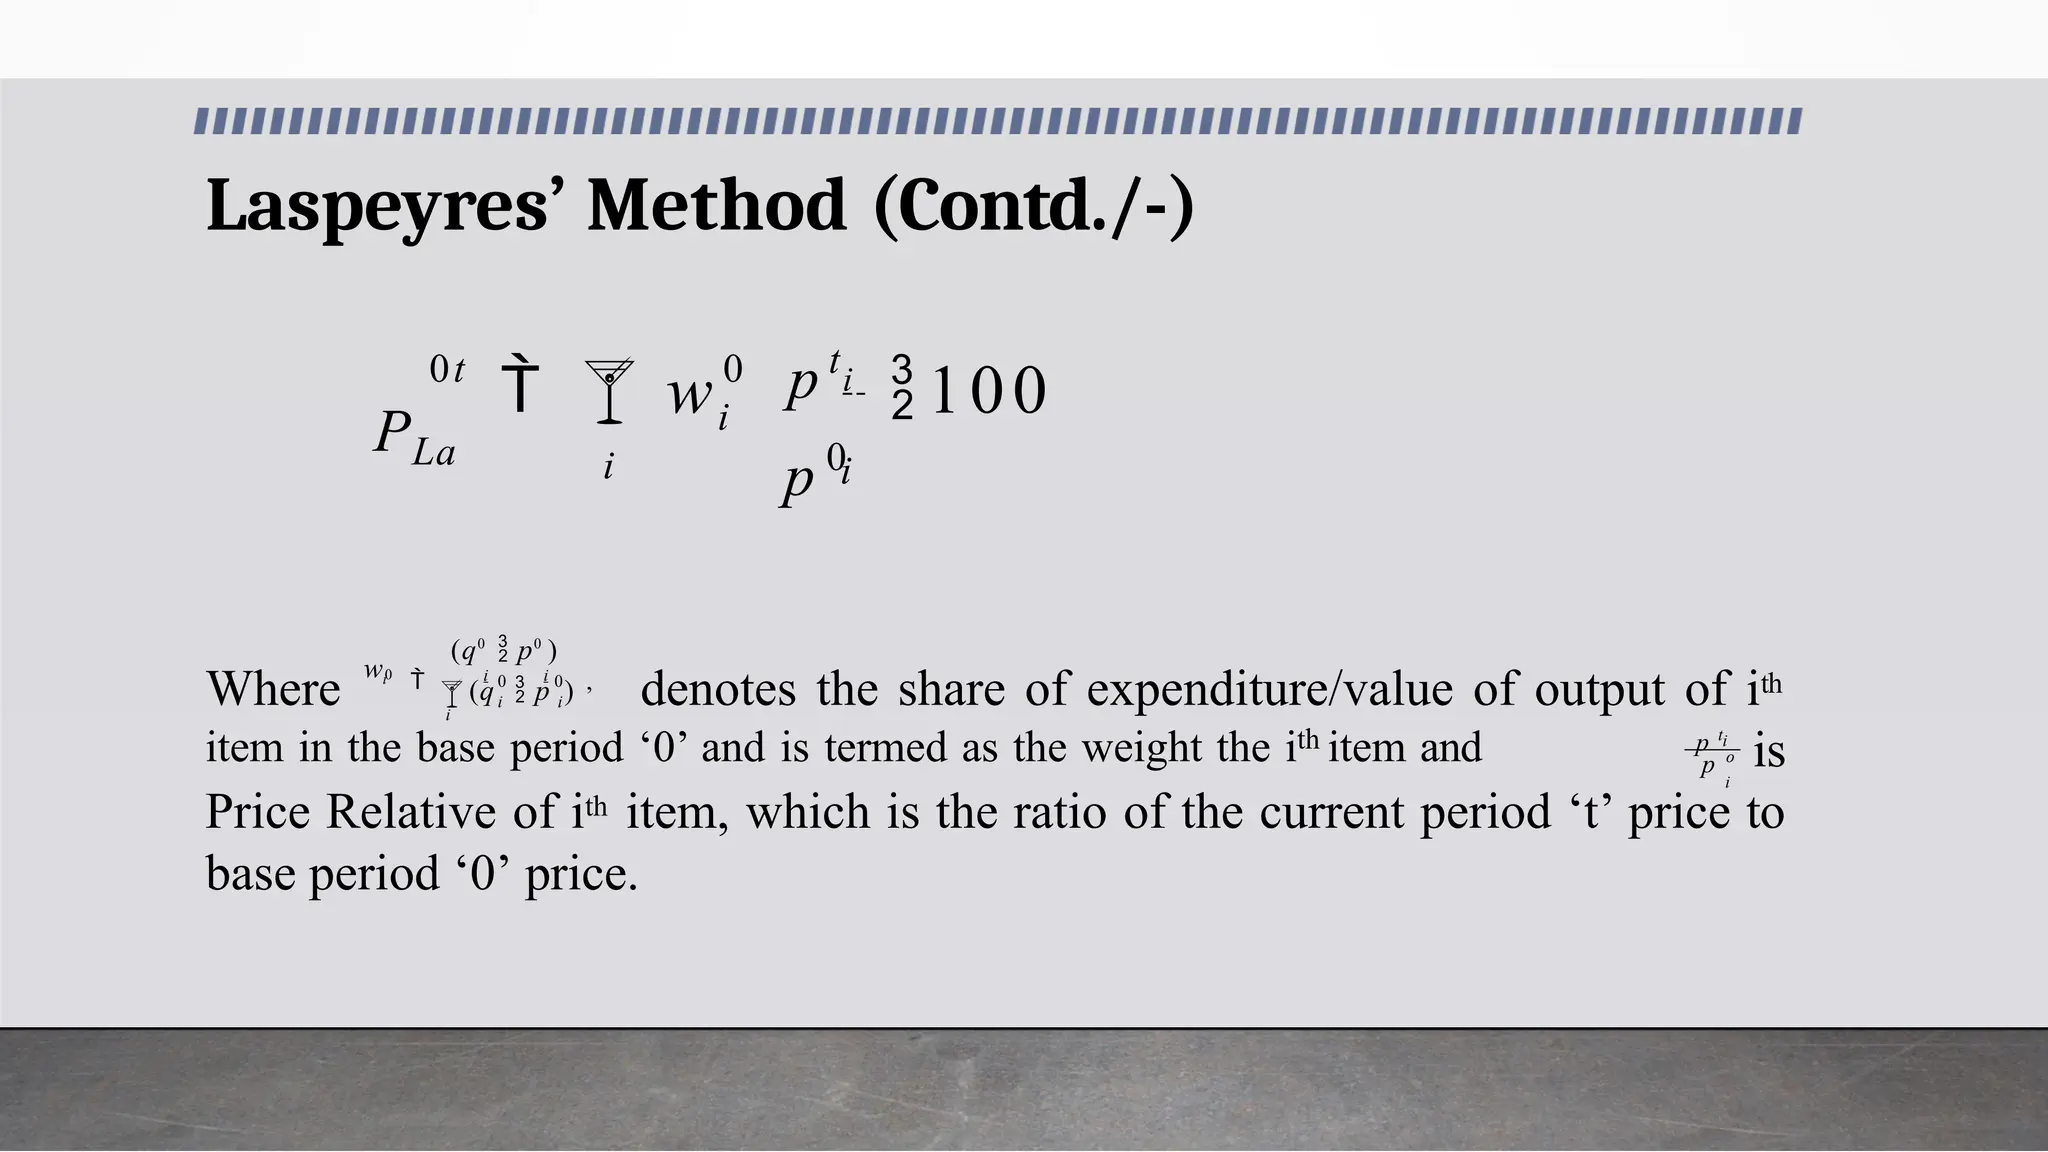
Laspeyres’ Method (Contd./-)
0
i
i
i
0t
p0
p t
w i
100
PLa
Where denotes the share of expenditure/value of output of ith
is
Price Relative of ith item, which is the ratio of the current period ‘t’ price to
base period ‘0’ price.
0 0
i i
0
i i ,
(q p )
(q0
p0
)
wi
i
i
i
item in the base period ‘0’ and is termed as the weight the ith item and p o
p t
21.
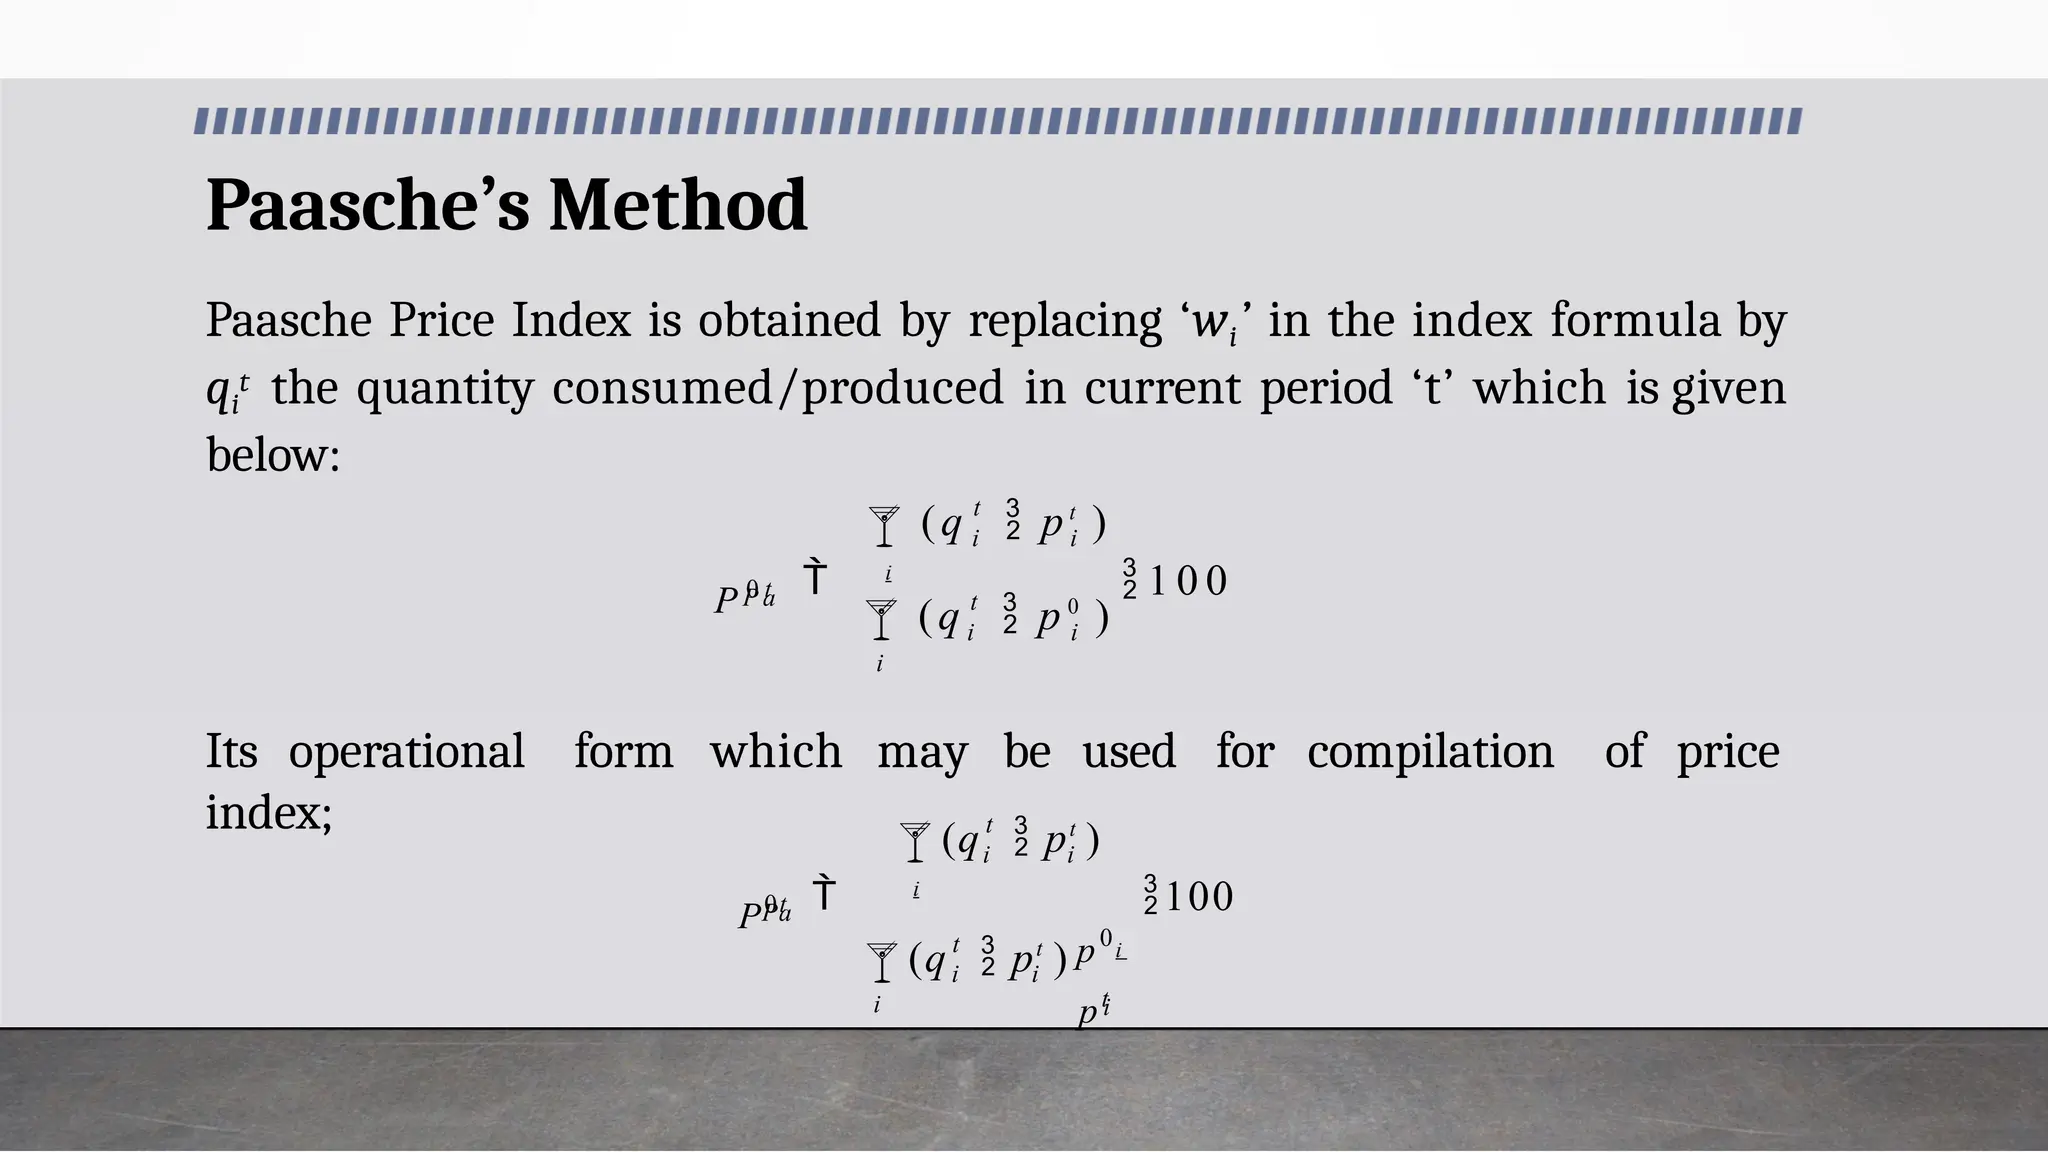
Paasche’s Method
Paasche PriceIndex is obtained by replacing ‘wi’ in the index formula by
qi
t the quantity consumed/produced in current period ‘t’ which is given
below:
Its operational form which may be used for compilation of price
index;
i
i
t
i
i
1 0 0
t
i i
P a
(q p 0
)
(q pt
)
P 0 t
i i
i
t
i
i
100
t
i i
Pa
pt
p0
(q pt
) i
(q pt
)
P0t
22.
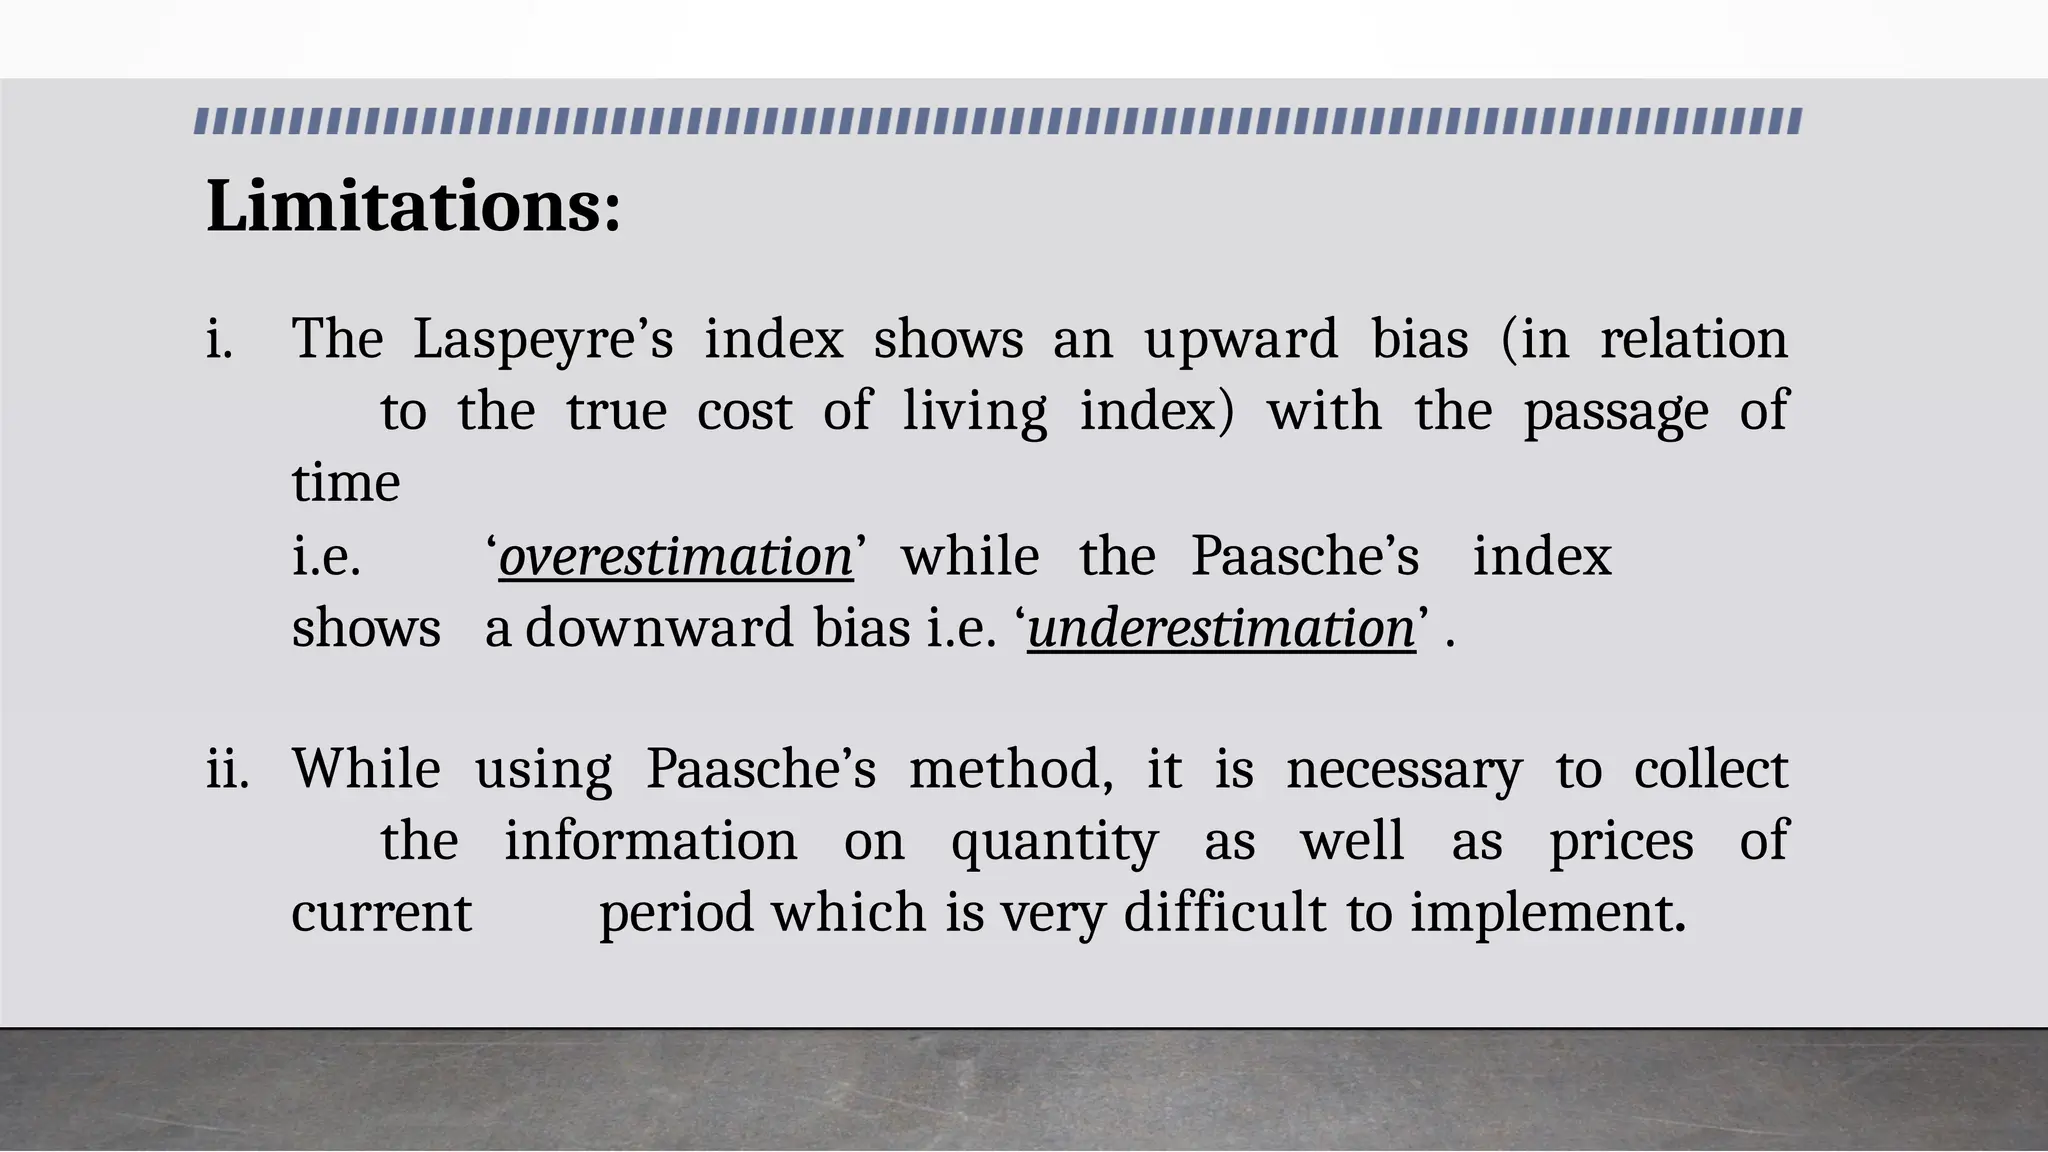
Limitations:
i. The Laspeyre’sindex shows an upward bias (in relation
to the true cost of living index) with the passage of
time
i.e. ‘overestimation’ while the Paasche’s index
shows a downward bias i.e. ‘underestimation’ .
ii. While using Paasche’s method, it is necessary to collect
the information on quantity as well as prices of
current period which is very difficult to implement.
23.
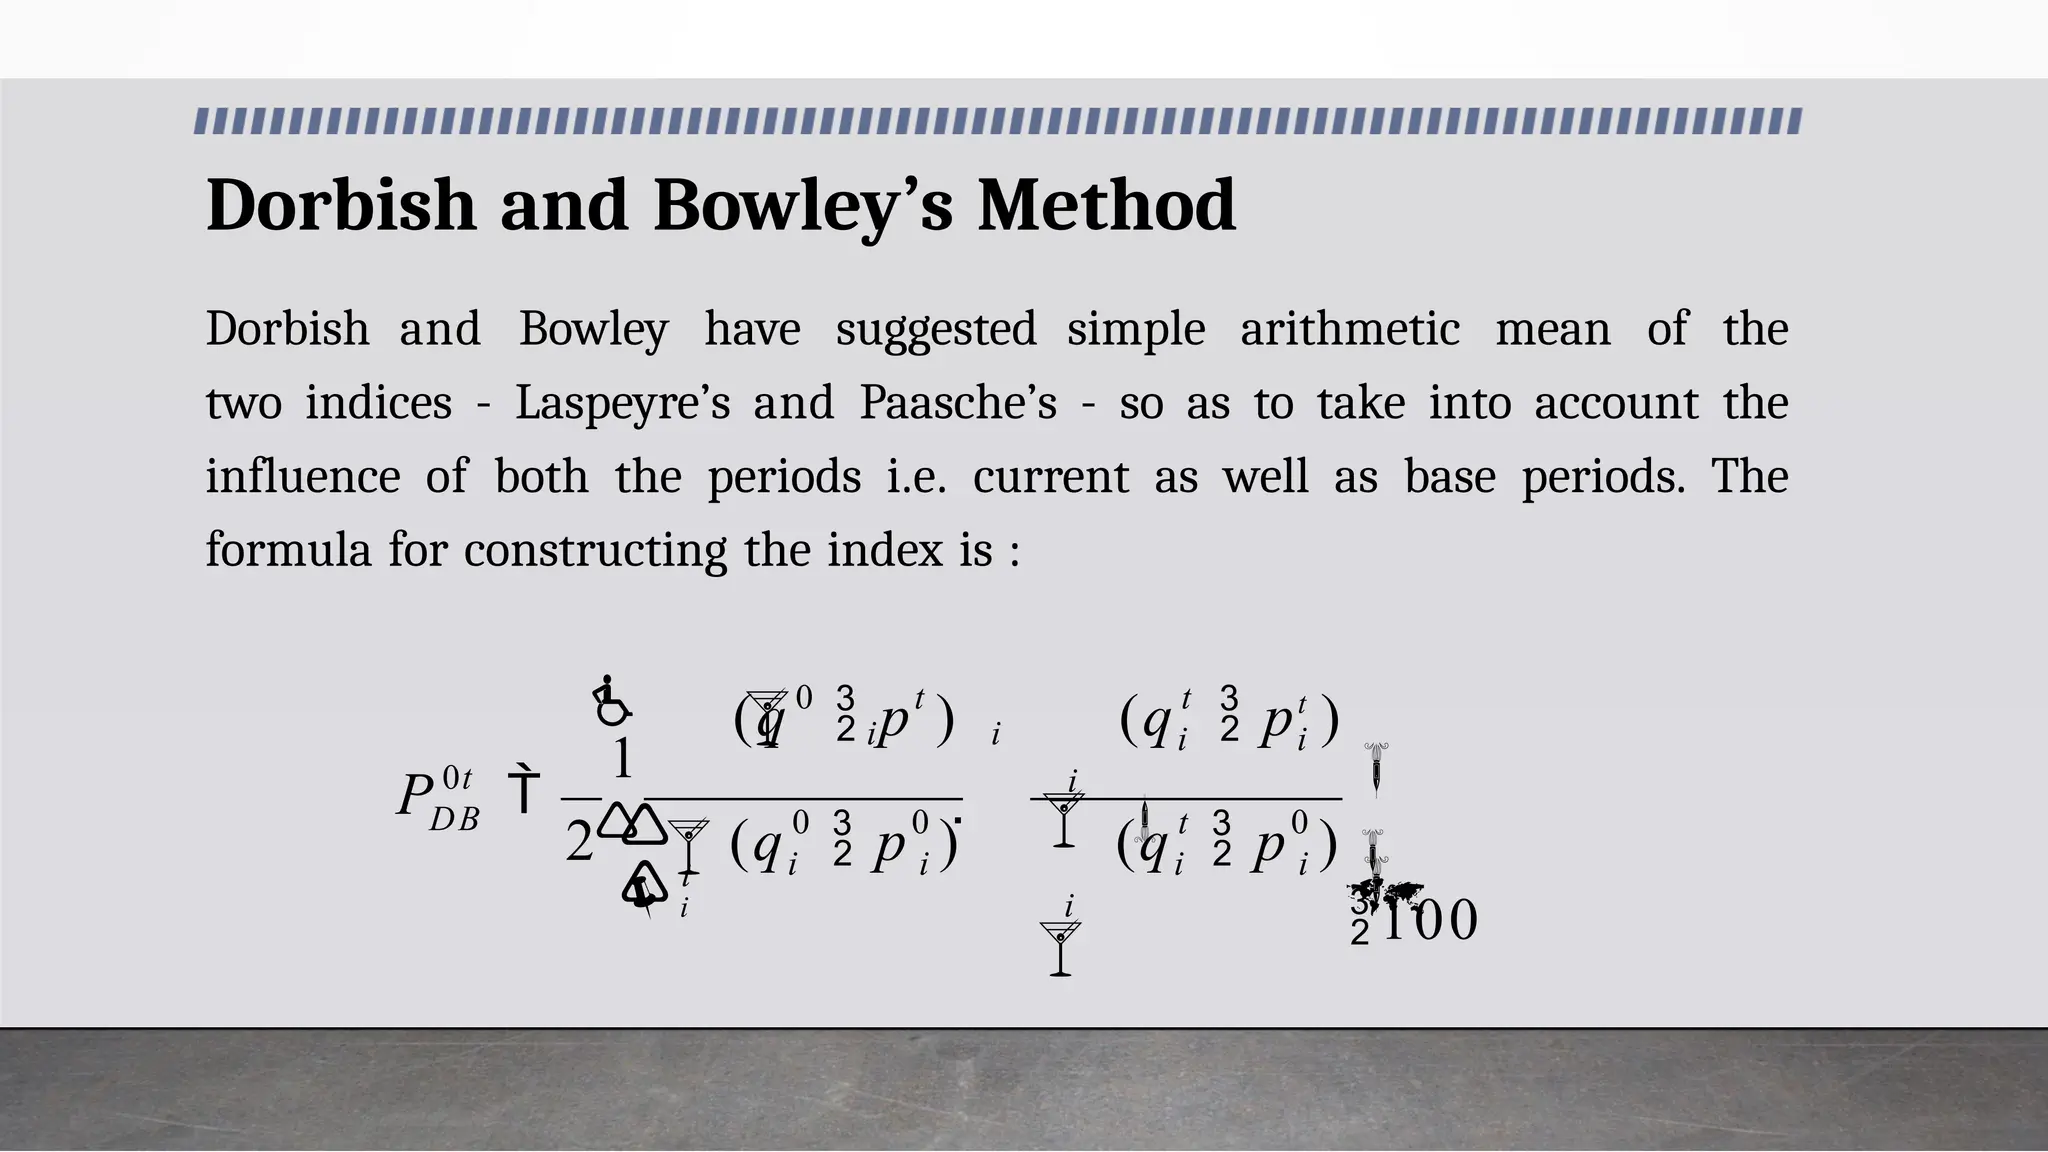
Dorbish and Bowley’sMethod
Dorbish and Bowley have suggested simple arithmetic mean of the
two indices - Laspeyre’s and Paasche’s - so as to take into account the
influence of both the periods i.e. current as well as base periods. The
formula for constructing the index is :
2 0
0
0
0
100
1
i
i
t
i
i
t
i i
i
i
i
t
i i
i
0t
DB
(q p )
(q pt
)
(q p )
(q p )
P
24.
Fisher’s Method
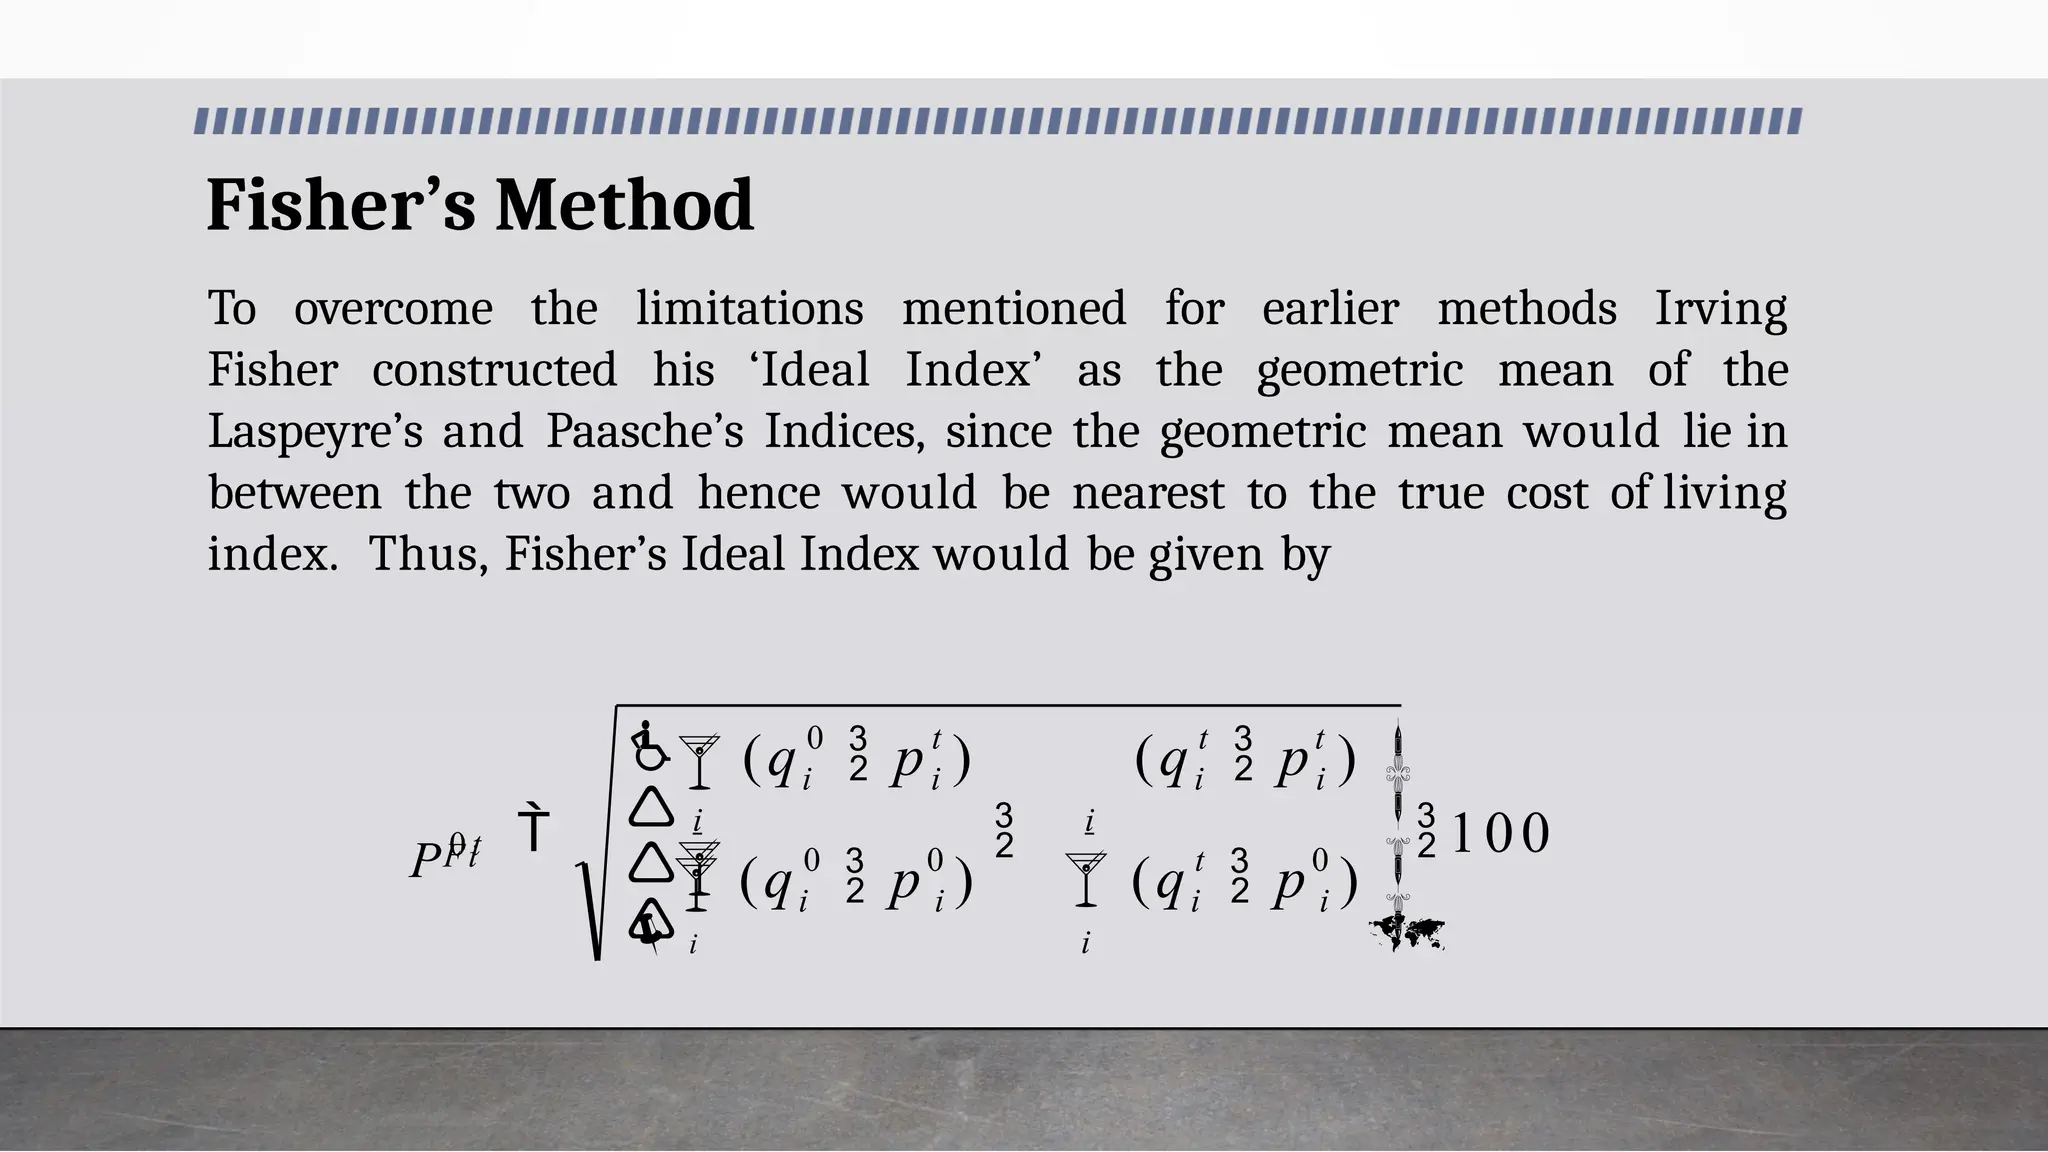
To overcomethe limitations mentioned for earlier methods Irving
Fisher constructed his ‘Ideal Index’ as the geometric mean of the
Laspeyre’s and Paasche’s Indices, since the geometric mean would lie in
between the two and hence would be nearest to the true cost of living
index. Thus, Fisher’s Ideal Index would be given by
0
0
0
100
i
i
t
i
i
t
i
t
i
i
i
i
i
0 t
i
i
Fi
(q p )
(q p )
(q p )
(q p )
P 0 t
25.
Fisher’s Method
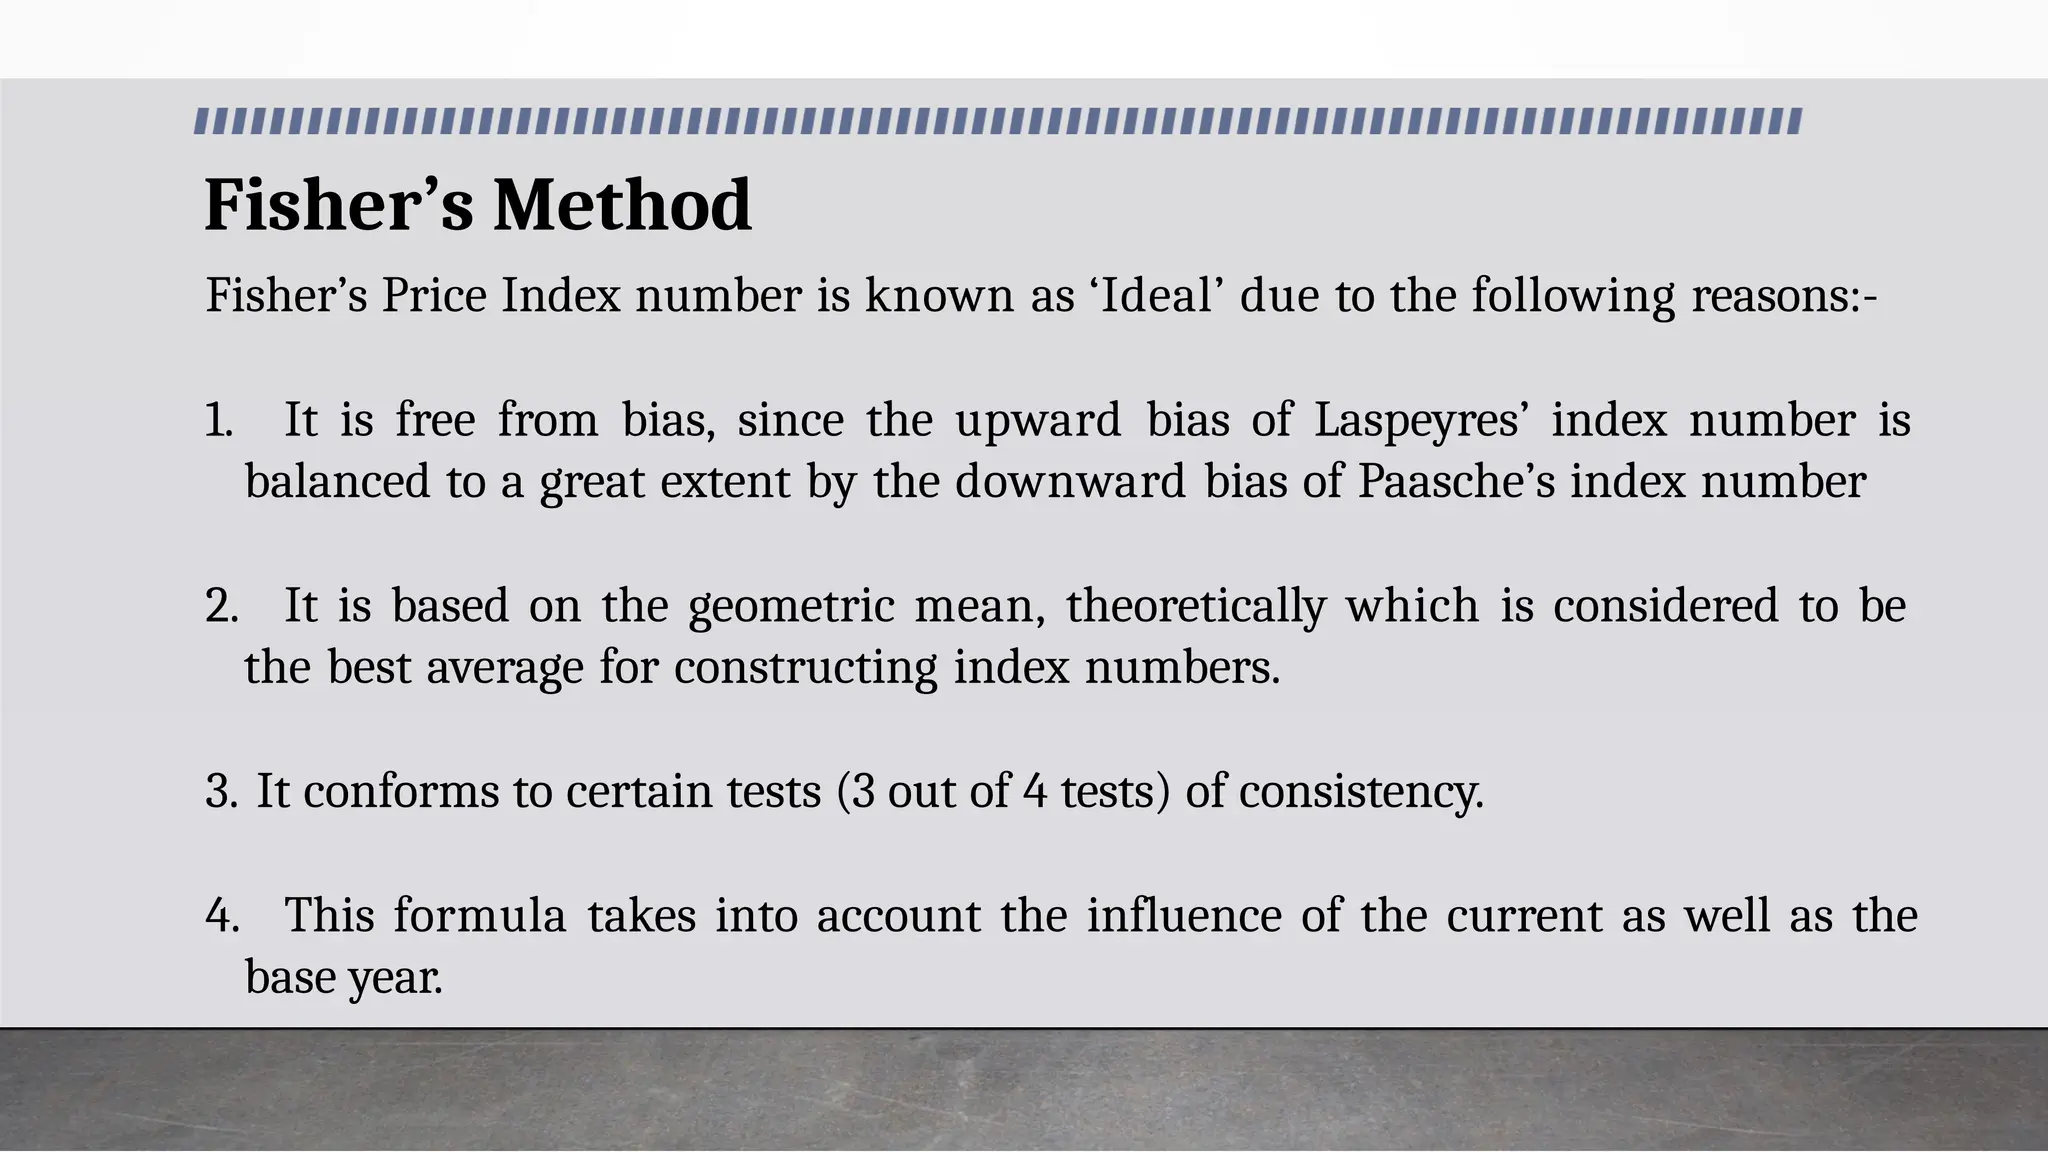
Fisher’s PriceIndex number is known as ‘Ideal’ due to the following reasons:-
1. It is free from bias, since the upward bias of Laspeyres’ index number is
balanced to a great extent by the downward bias of Paasche’s index number
2. It is based on the geometric mean, theoretically which is considered to be
the best average for constructing index numbers.
3. It conforms to certain tests (3 out of 4 tests) of consistency.
4. This formula takes into account the influence of the current as well as the
base year.
26.
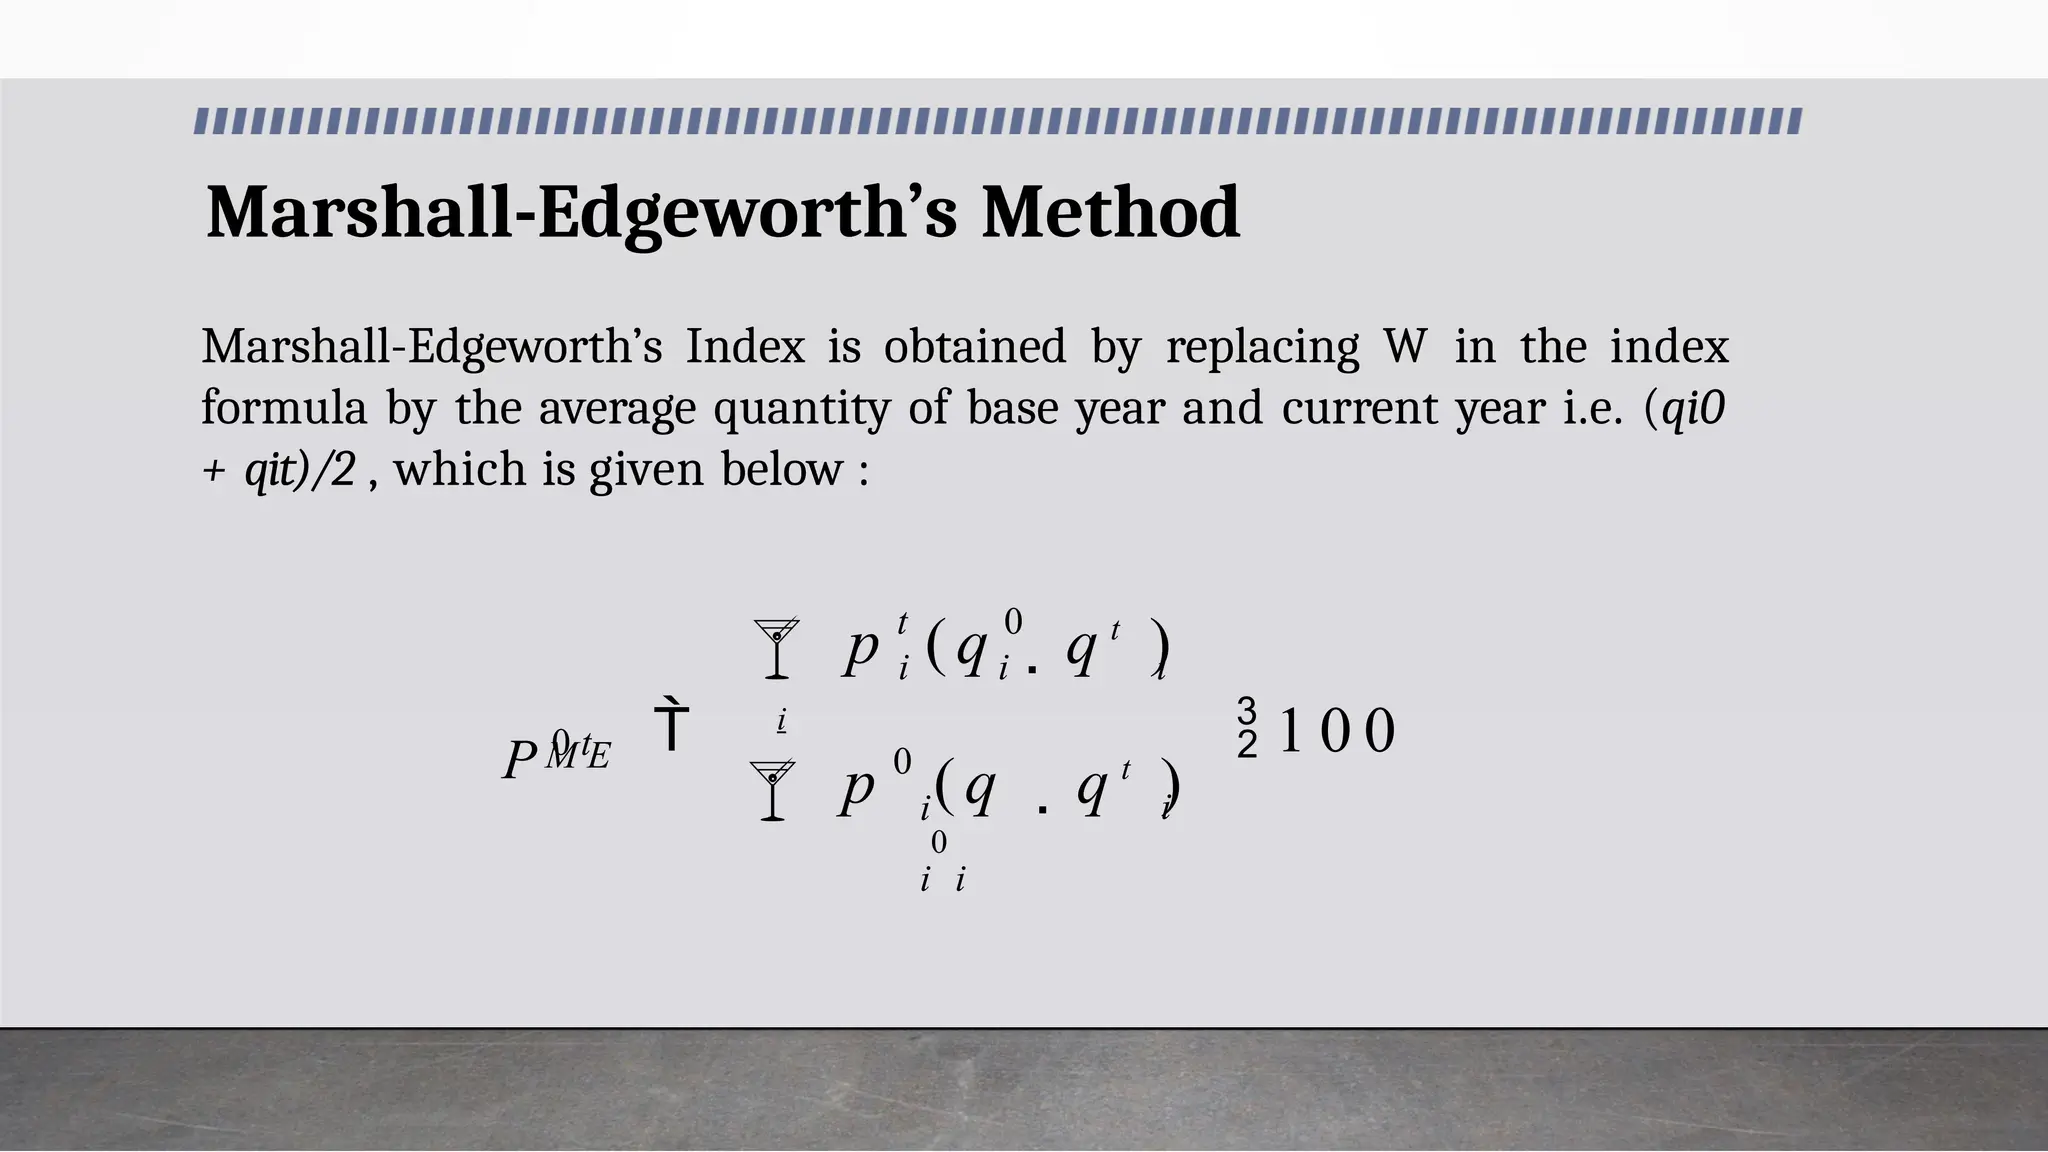
Marshall-Edgeworth’s Method
Marshall-Edgeworth’s Indexis obtained by replacing W in the index
formula by the average quantity of base year and current year i.e. (qi0
+ qit)/2 , which is given below :
0
0
i
i
i
0
i
i
1 0 0
i
i
t
i
M E
p (q q t
)
q t
)
p (q
P 0 t
27.
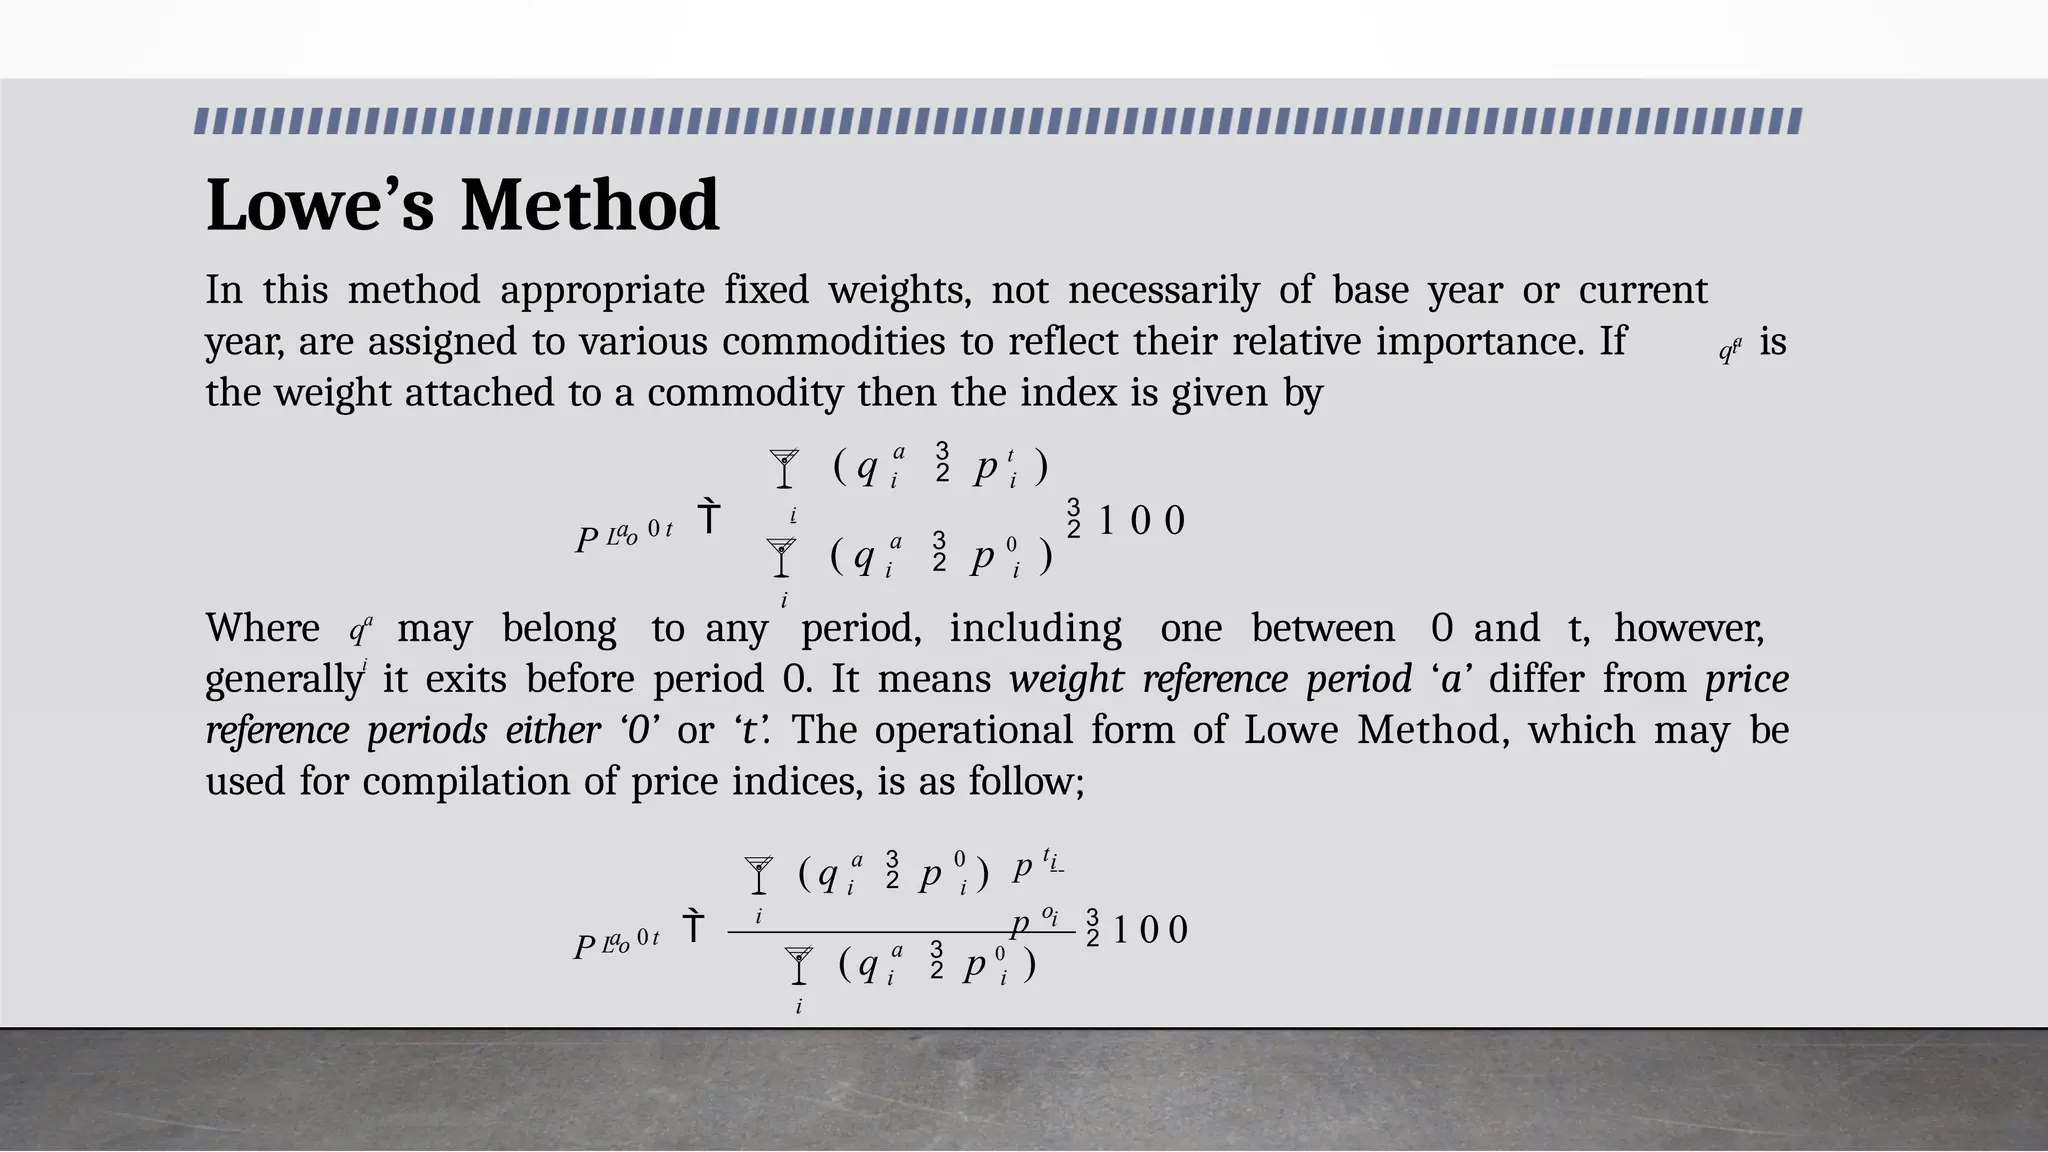
Lowe’s Method
In thismethod appropriate fixed weights, not necessarily of base year or current
year, are assigned to various commodities to reflect their relative importance. If is
the weight attached to a commodity then the index is given by
Where may belong to any period, including one between 0 and t, however,
generally it exits before period 0. It means weight reference period ‘a’ differ from price
reference periods either ‘0’ or ‘t’. The operational form of Lowe Method, which may be
used for compilation of price indices, is as follow;
i
a
i i
i
1 0 0
a
i i
L o
( q p 0
)
( q p t
)
P a 0 t
i
qa
a
i
q
1 0 0
i
a
i i
i
i
i
a 0
i i
L o
( q p 0
)
p o
p t
( q p )
P a 0 t
28.
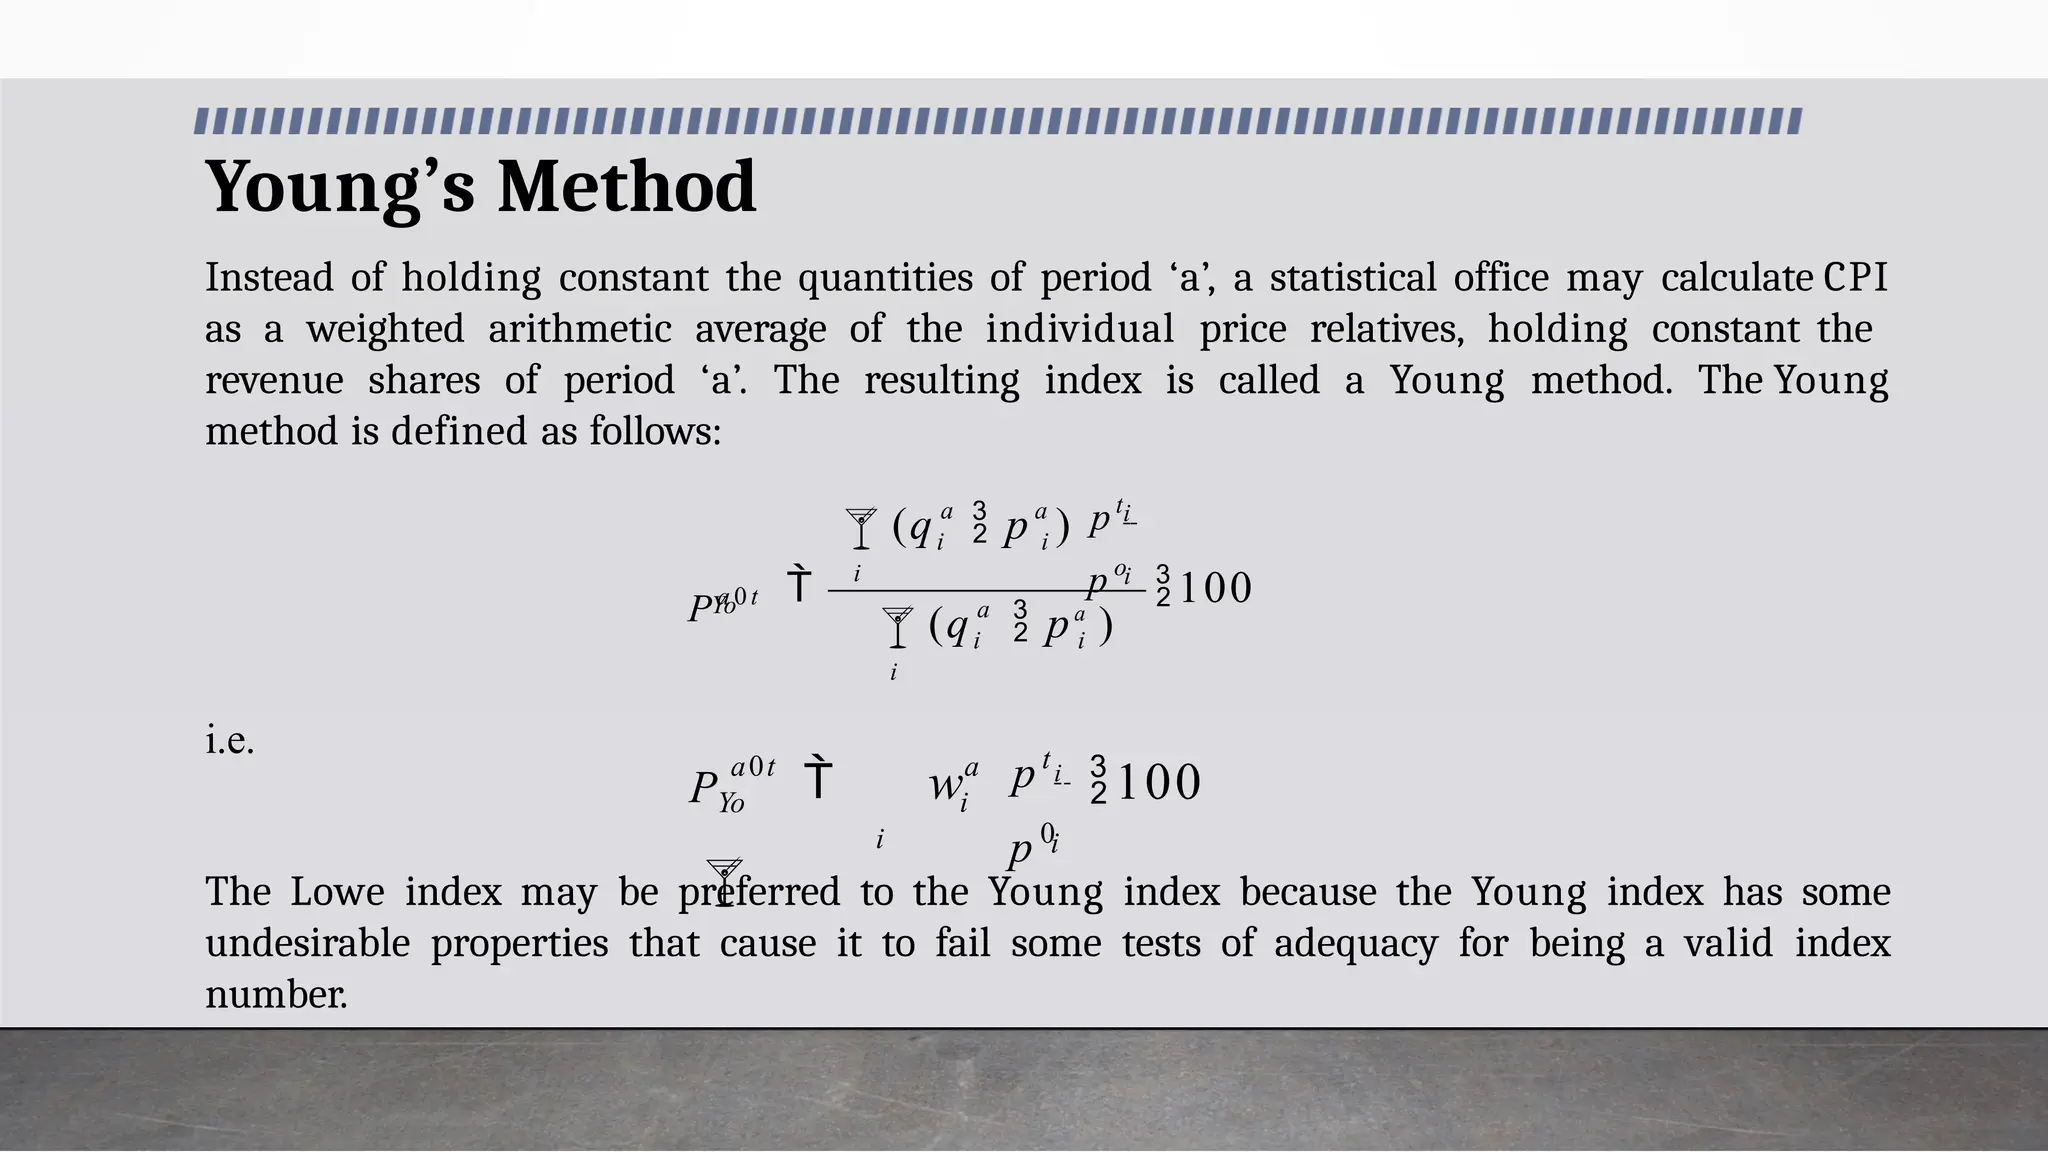
Young’s Method
Instead ofholding constant the quantities of period ‘a’, a statistical office may calculate CPI
as a weighted arithmetic average of the individual price relatives, holding constant the
revenue shares of period ‘a’. The resulting index is called a Young method. The Young
method is defined as follows:
i.e.
The Lowe index may be preferred to the Young index because the Young index has some
undesirable properties that cause it to fail some tests of adequacy for being a valid index
number.
100
i
a
i i
i
i
i
a a
i i
Yo
(q pa
)
p o
pt
(q p )
Pa 0 t
i
i
a
i
a0t
p 0
pt
w i
100
PYo
29.
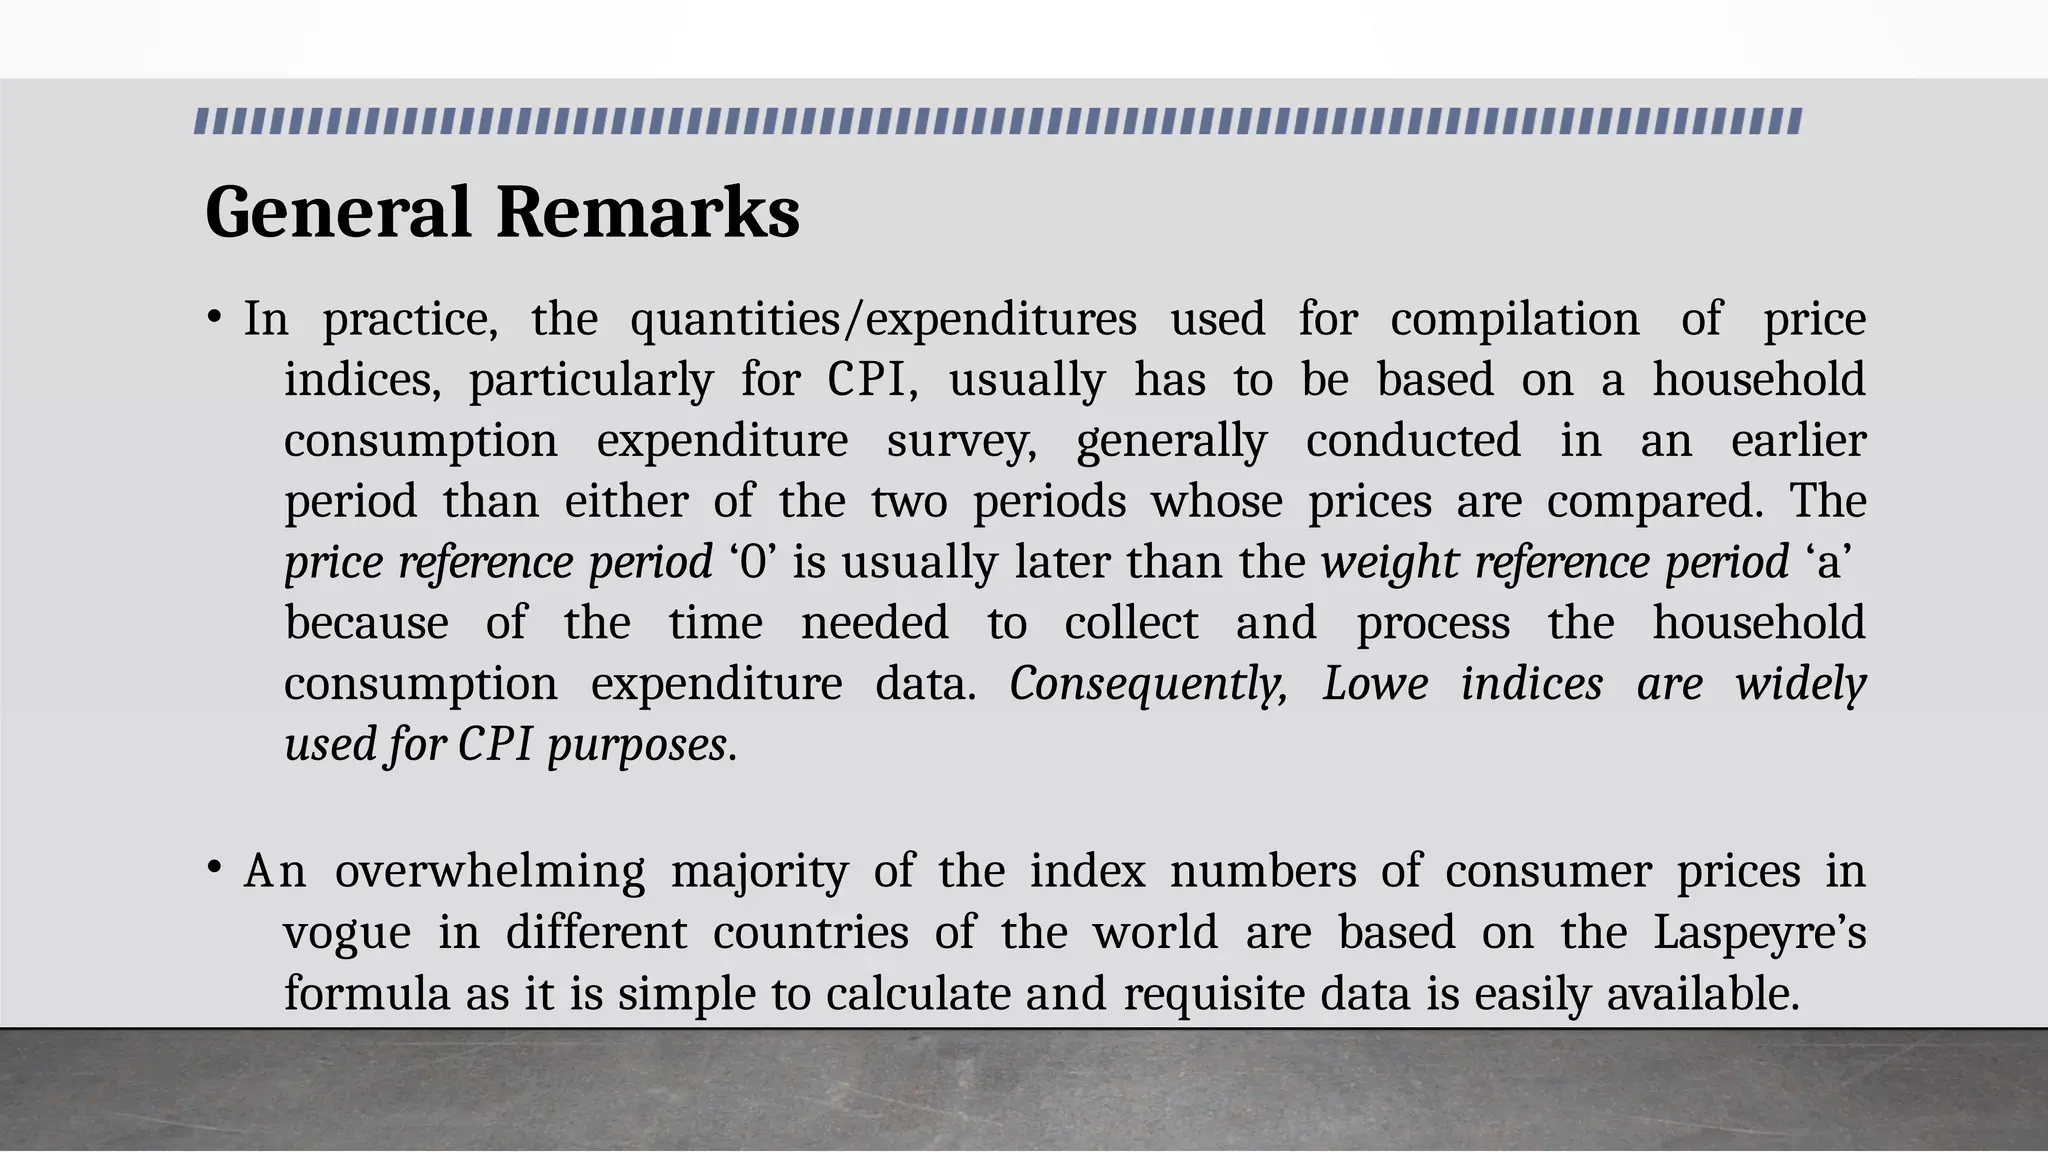
General Remarks
• Inpractice, the quantities/expenditures used for compilation of price
indices, particularly for CPI, usually has to be based on a household
consumption expenditure survey, generally conducted in an earlier
period than either of the two periods whose prices are compared. The
price reference period ‘0’ is usually later than the weight reference period ‘a’
because of the time needed to collect and process the household
consumption expenditure data. Consequently, Lowe indices are widely
used for CPI purposes.
• An overwhelming majority of the index numbers of consumer prices in
vogue in different countries of the world are based on the Laspeyre’s
formula as it is simple to calculate and requisite data is easily available.
Chain Index Numbers
Inthis method, the comparison are not made with fixed base, the base
changes from year to year. For example, for 2018, 2017 will be the base and
for 2019, 2018 will be base, and so on.
Chain Index for current year = [(Average link relative of current year)
x (Chain Index for previous year)]/100 i.e.
100
0 2
p1
LR1 2
p 2 100
L R 1 2 C I P 0 1 , where
CI P
32.
Conversion of ChainIndex to Fixed Base Index
• Current Year F.B.I. = (Chain Index for current
year) x (Fixed Base Index for previous year)]/100 i.e.
100
02
FBIP
CI P12FBIP01
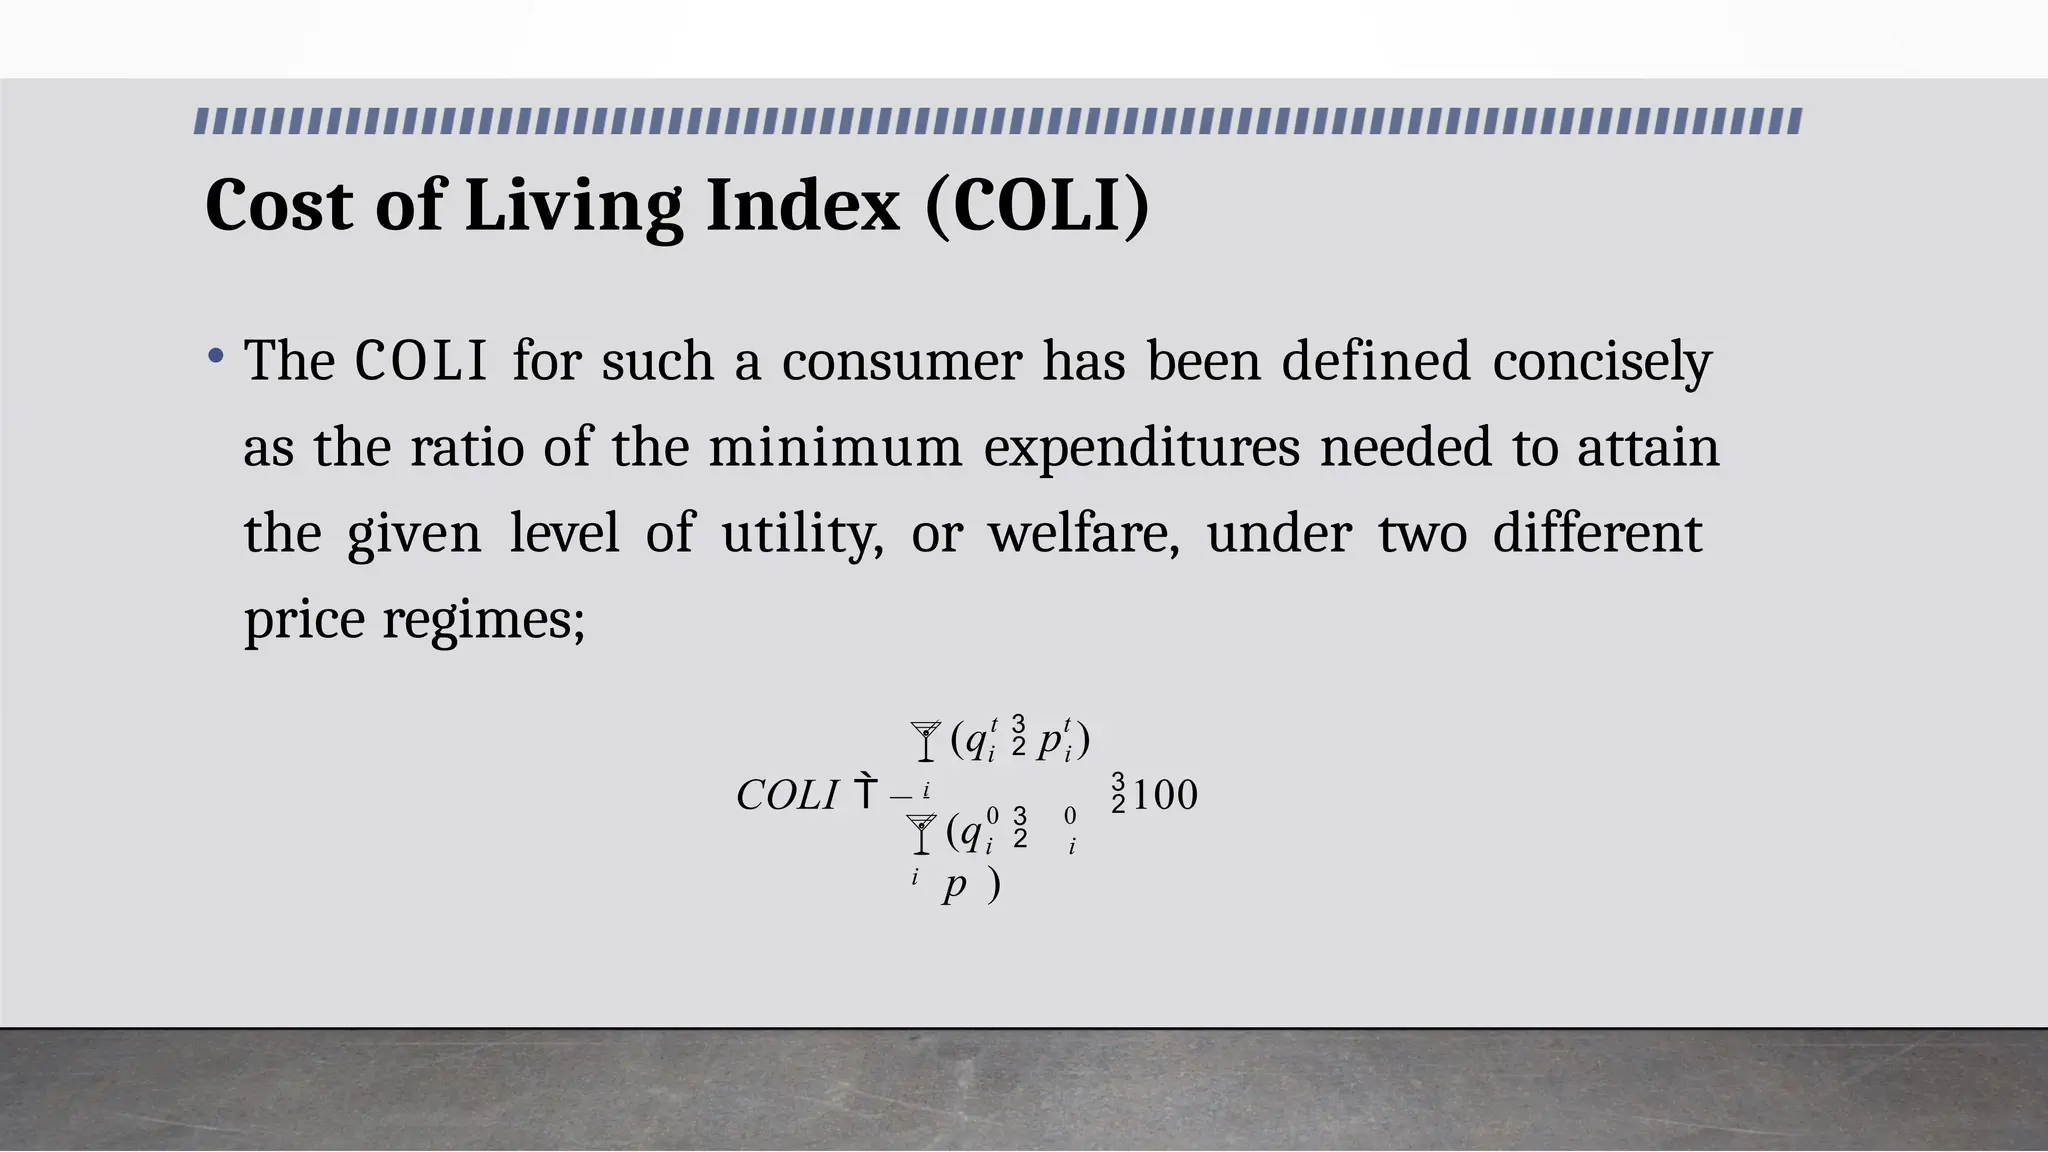
Cost of LivingIndex (COLI)
• The COLI for such a consumer has been defined concisely
as the ratio of the minimum expenditures needed to attain
the given level of utility, or welfare, under two different
price regimes;
0
0
i
i
i
t
i
t
i
(q
p )
(q p )
COLI i
100
35.
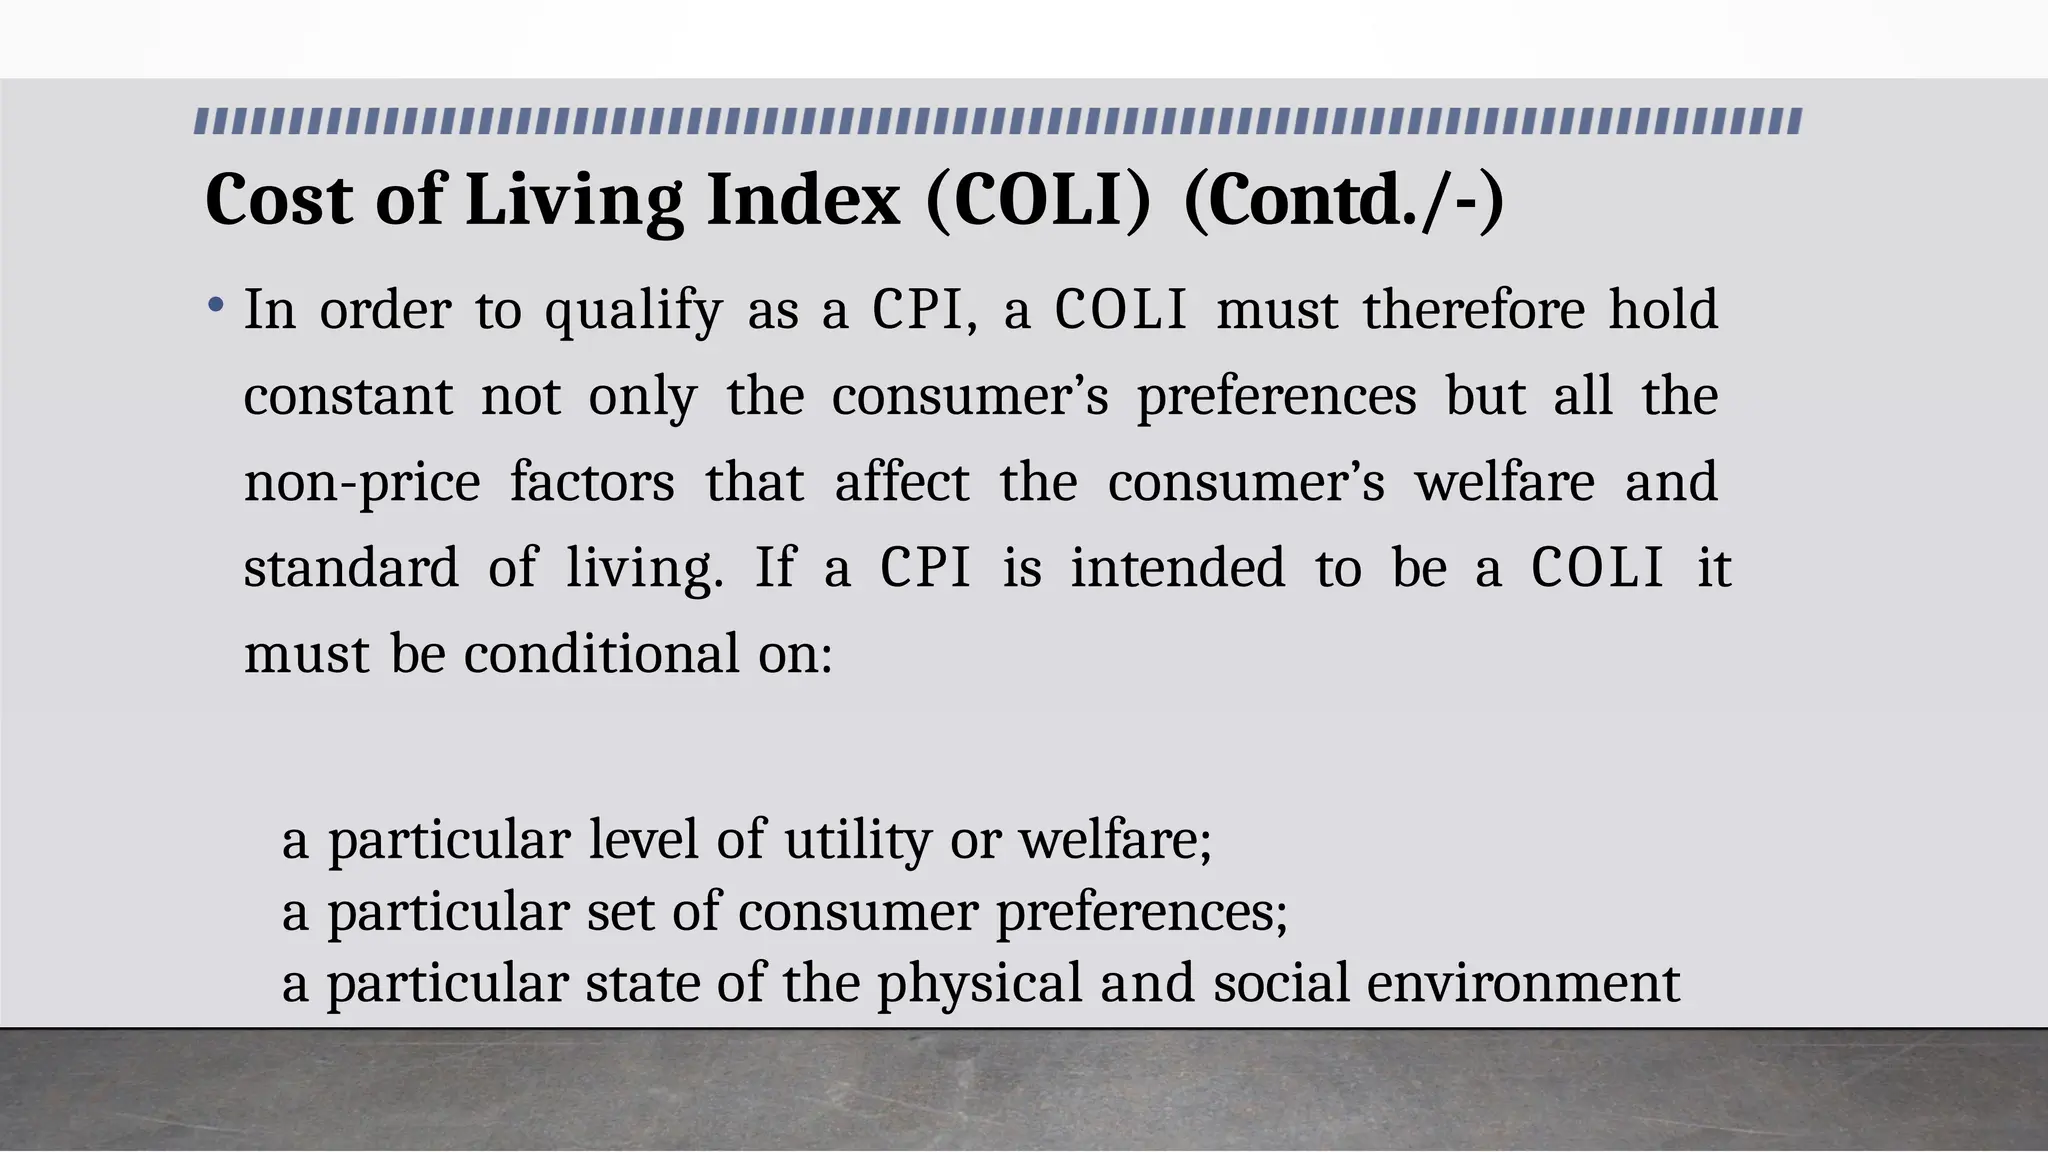
Cost of LivingIndex (COLI) (Contd./-)
• In order to qualify as a CPI, a COLI must therefore hold
constant not only the consumer’s preferences but all the
non-price factors that affect the consumer’s welfare and
standard of living. If a CPI is intended to be a COLI it
must be conditional on:
a particular level of utility or welfare;
a particular set of consumer preferences;
a particular state of the physical and social environment
36.
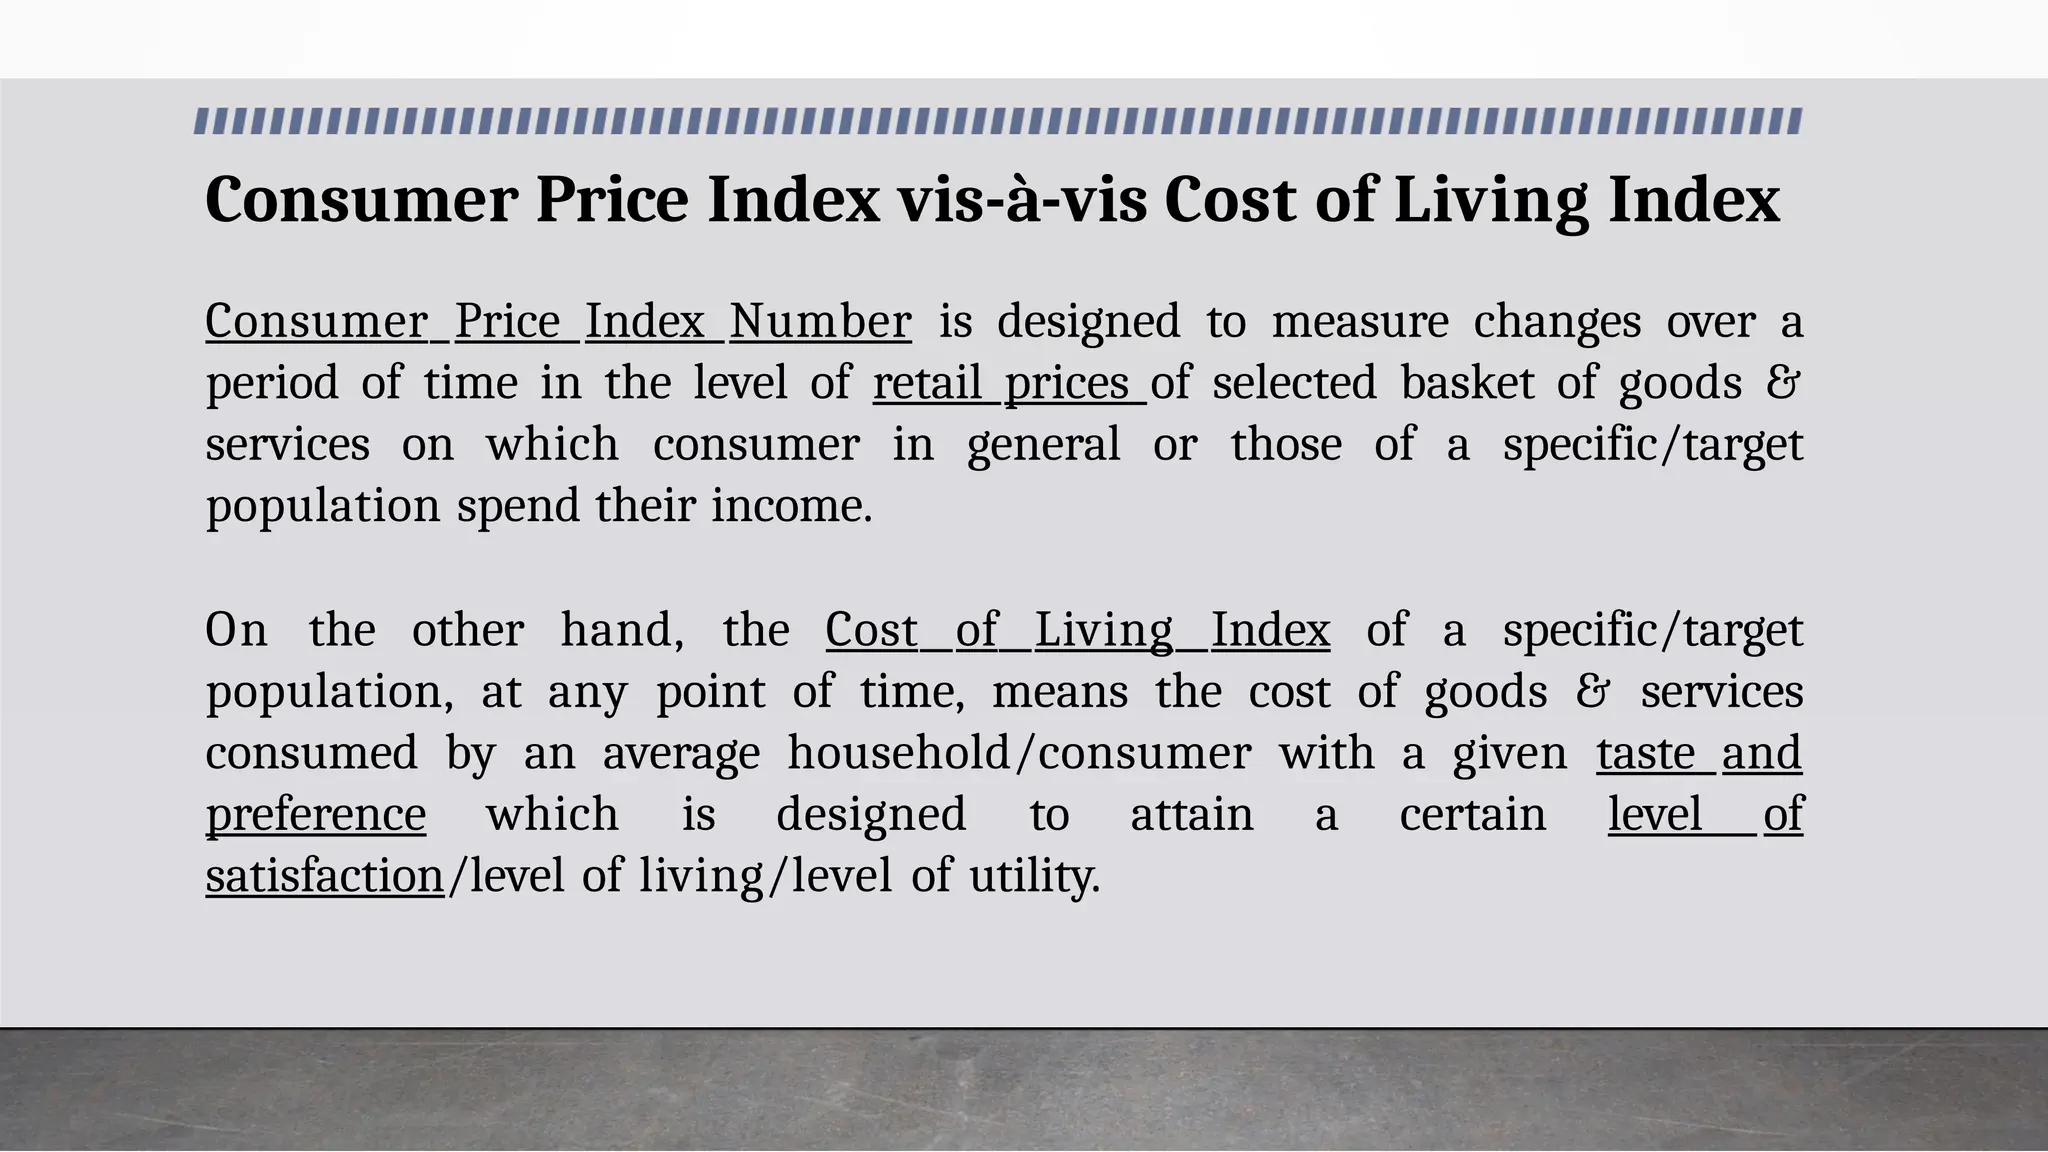
Consumer Price Indexvis-à-vis Cost of Living Index
Consumer Price Index Number is designed to measure changes over a
period of time in the level of retail prices of selected basket of goods &
services on which consumer in general or those of a specific/target
population spend their income.
On the other hand, the Cost of Living Index of a specific/target
population, at any point of time, means the cost of goods & services
consumed by an average household/consumer with a given taste and
preference which is designed to attain a certain level of
satisfaction/level of living/level of utility.
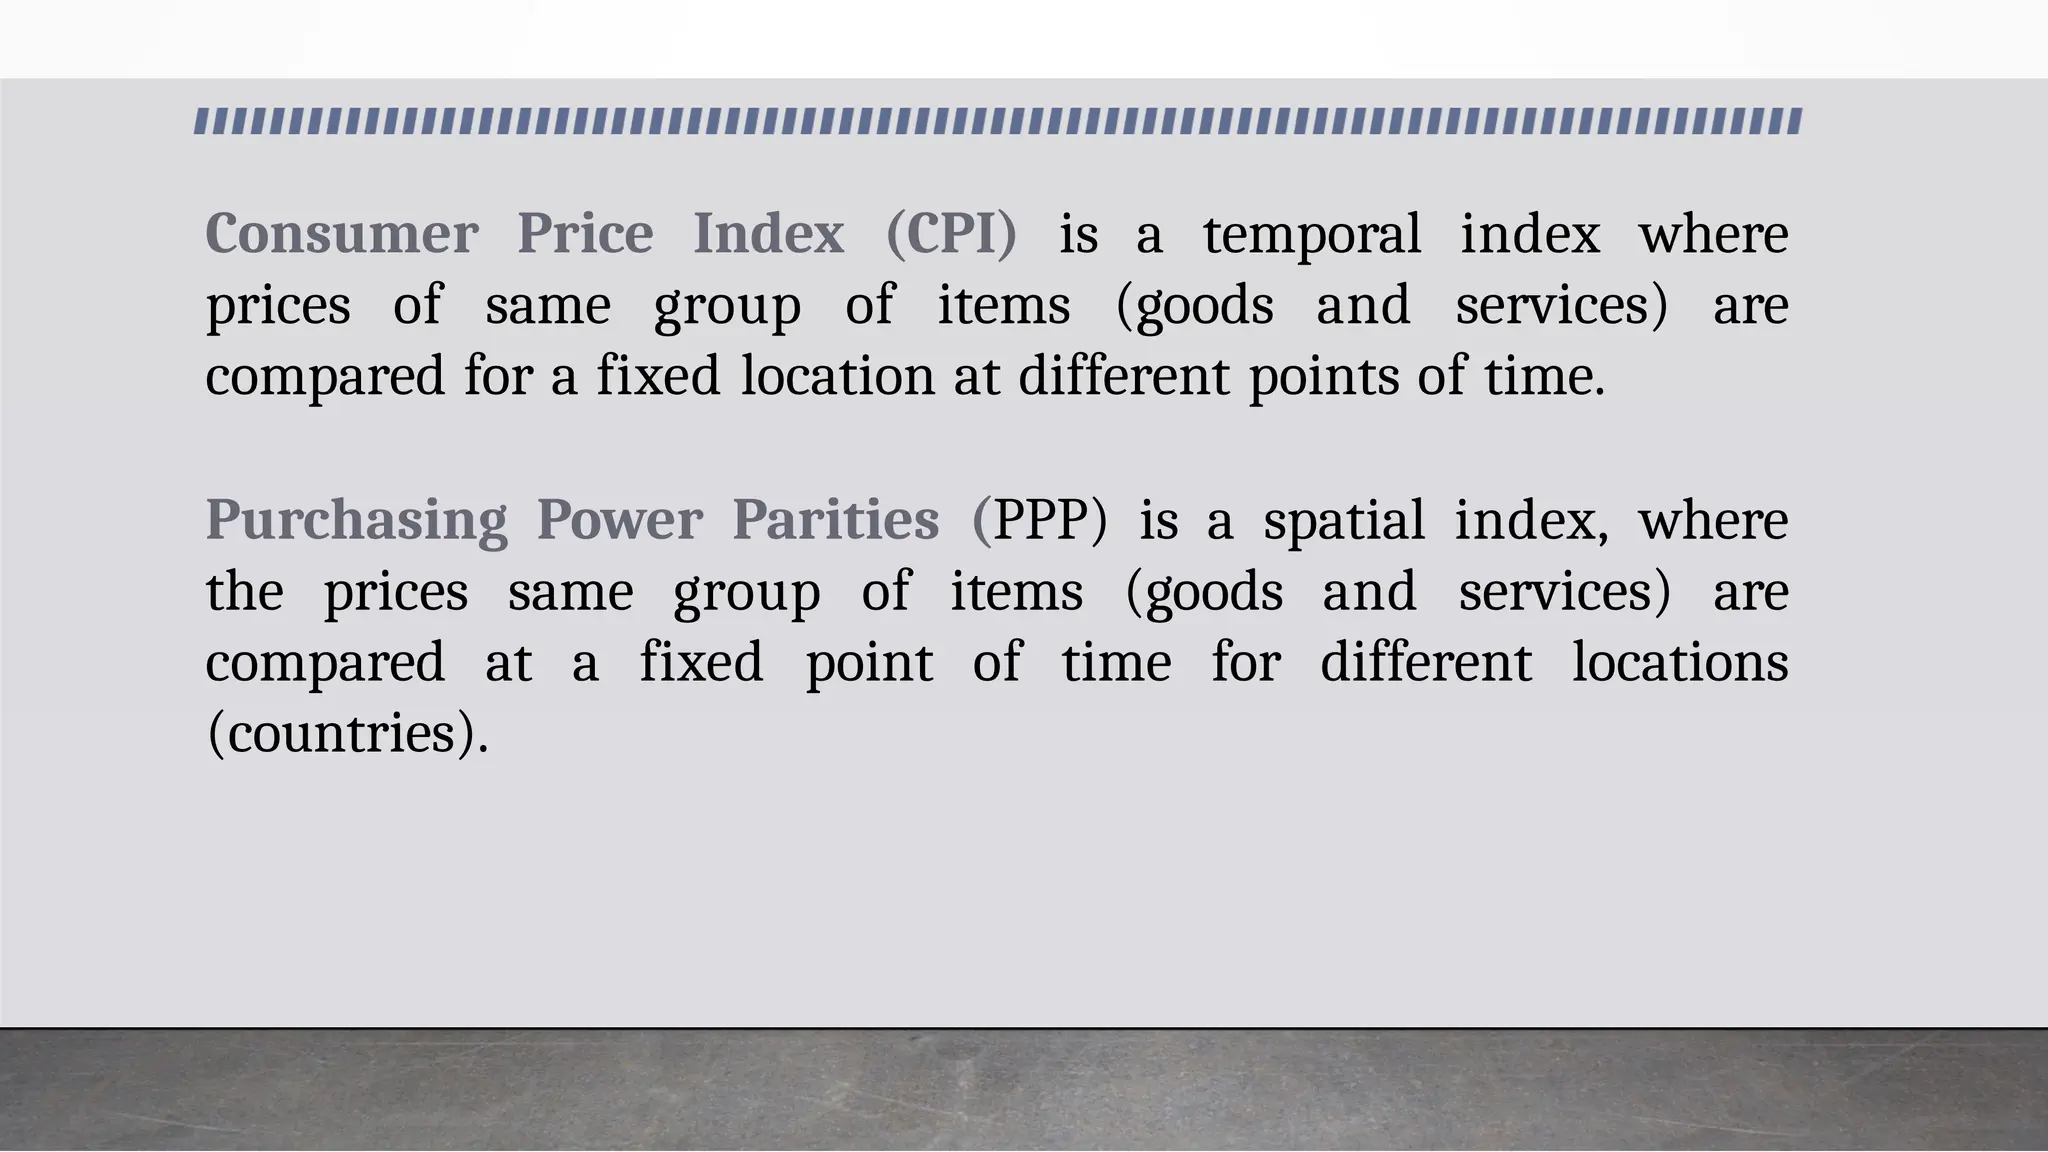
Consumer Price Index(CPI) is a temporal index where
prices of same group of items (goods and services) are
compared for a fixed location at different points of time.
Purchasing Power Parities (PPP) is a spatial index, where
the prices same group of items (goods and services) are
compared at a fixed point of time for different locations
(countries).
39.
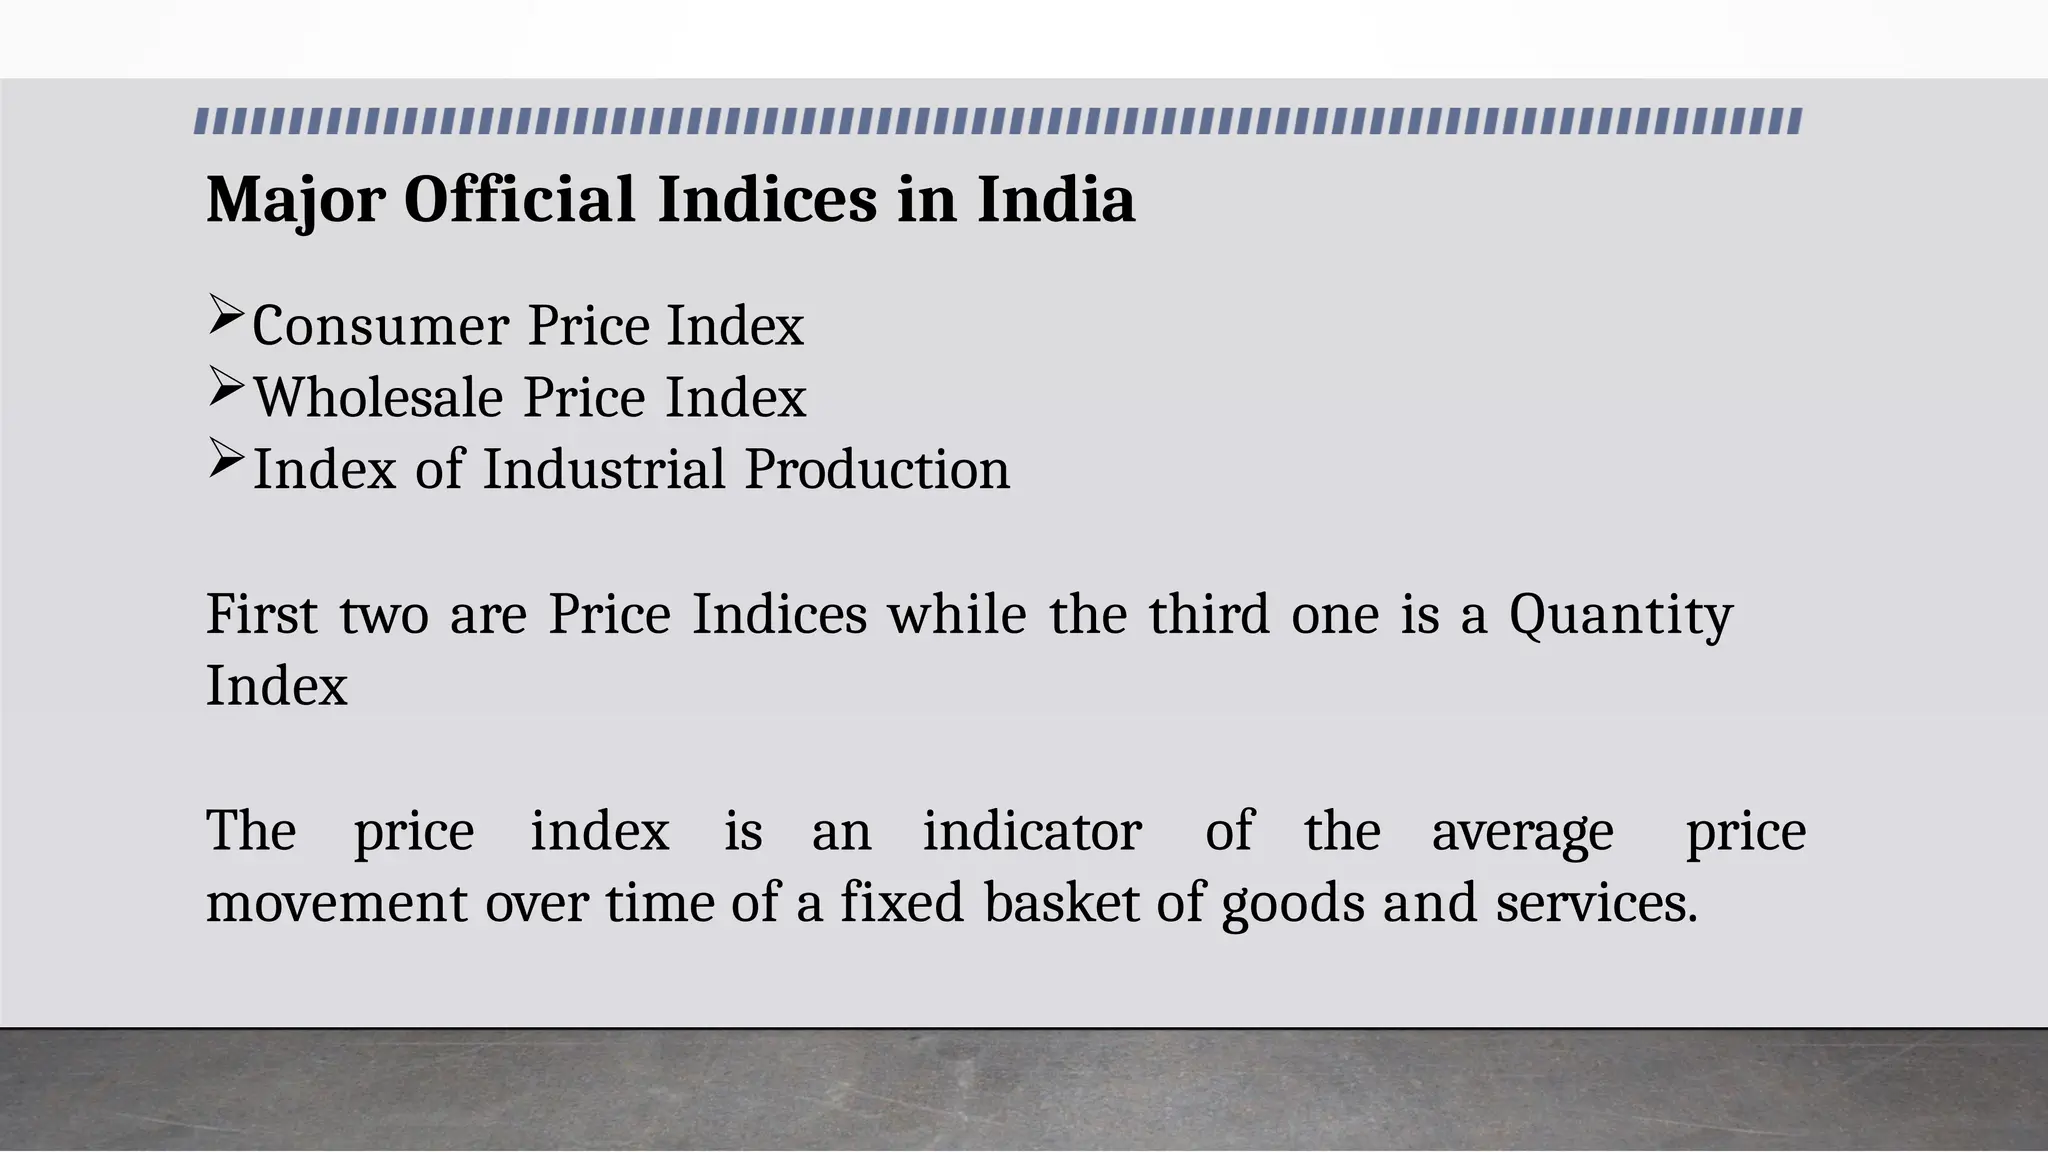
Major Official Indicesin India
Consumer Price Index
Wholesale Price Index
Index of Industrial Production
First two are Price Indices while the third one is a Quantity
Index
The price index is an indicator of the average price
movement over time of a fixed basket of goods and services.
40.
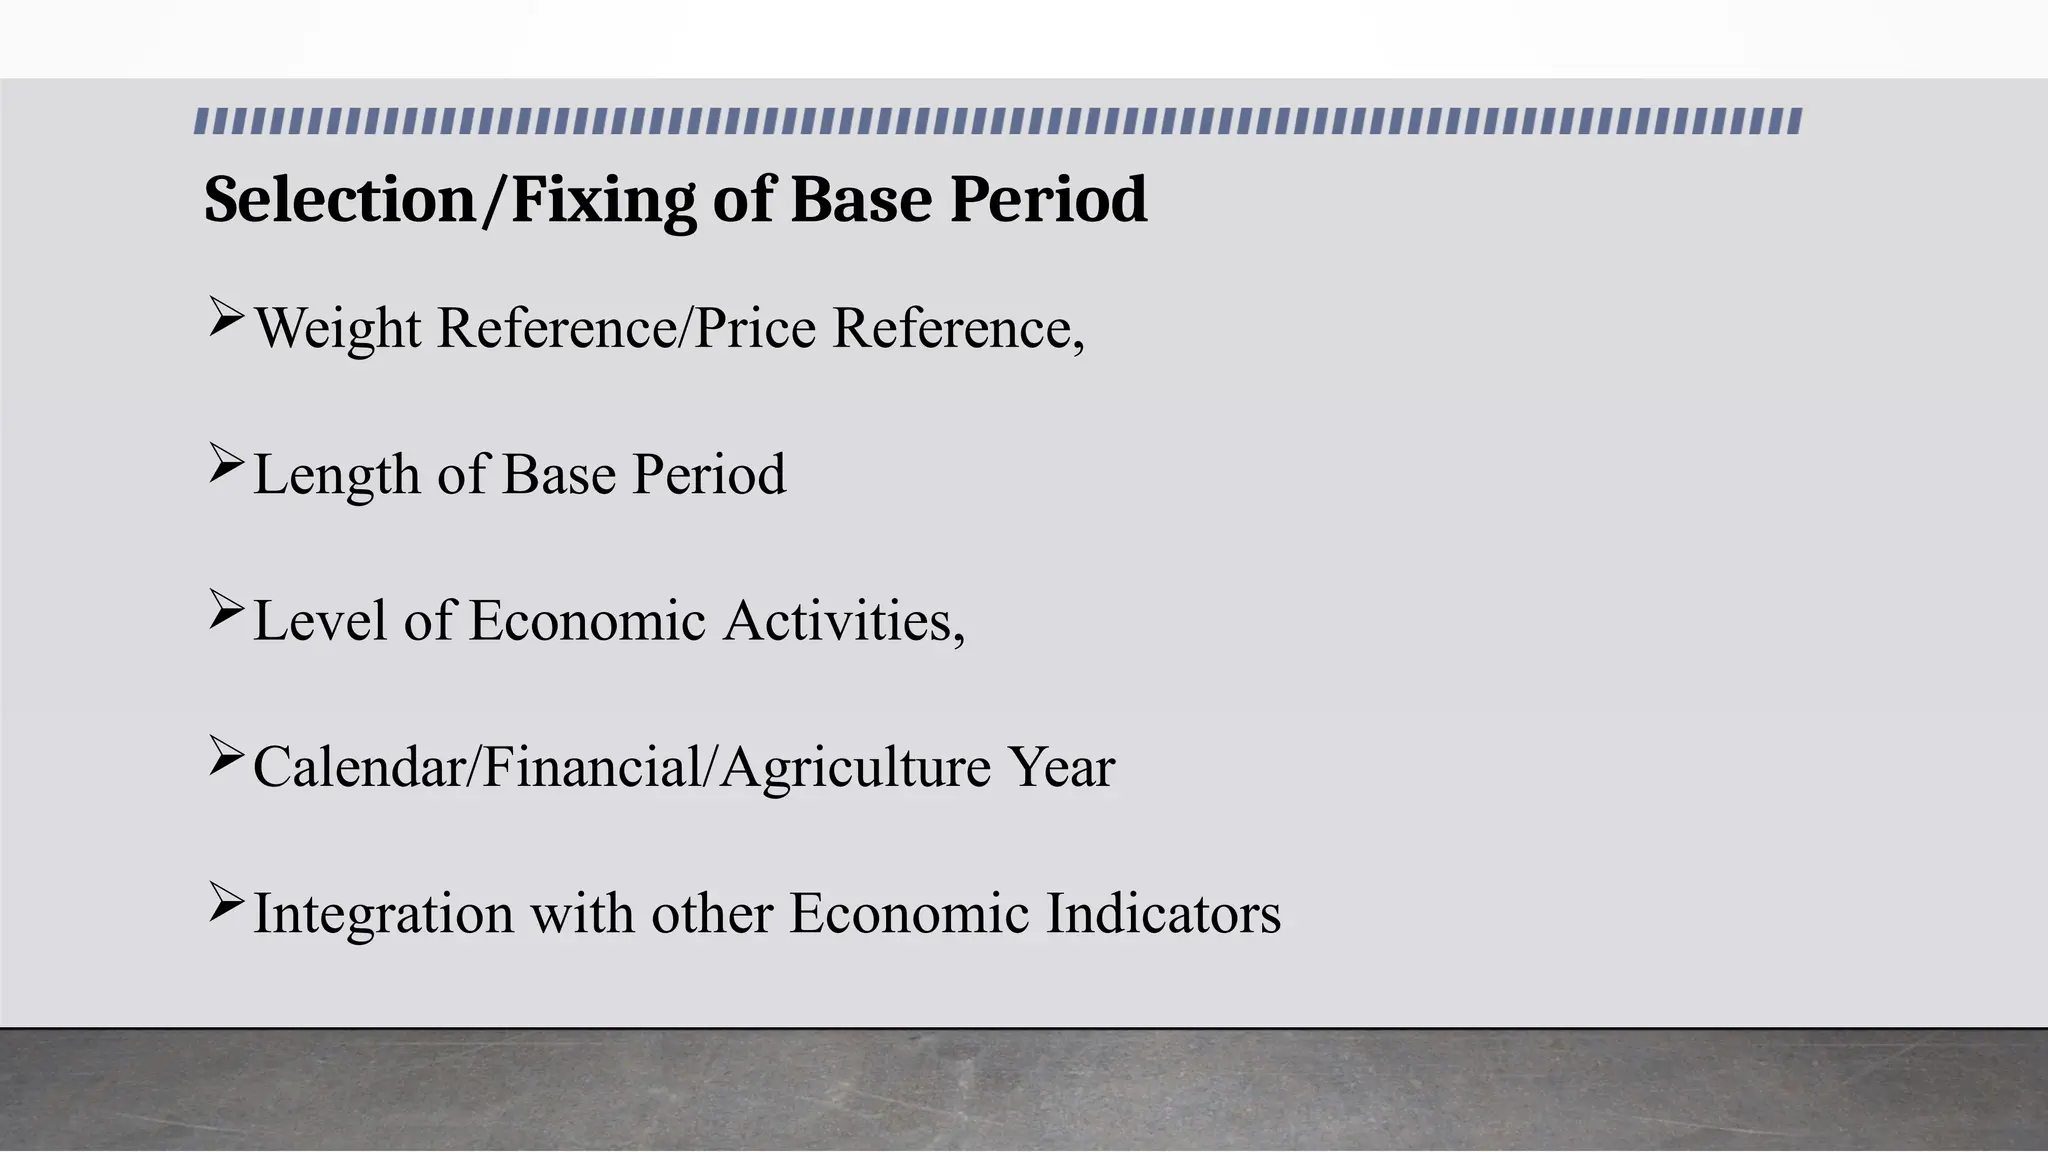
Selection/Fixing of BasePeriod
Weight Reference/Price Reference,
Length of Base Period
Level of Economic Activities,
Calendar/Financial/Agriculture Year
Integration with other Economic Indicators
41.
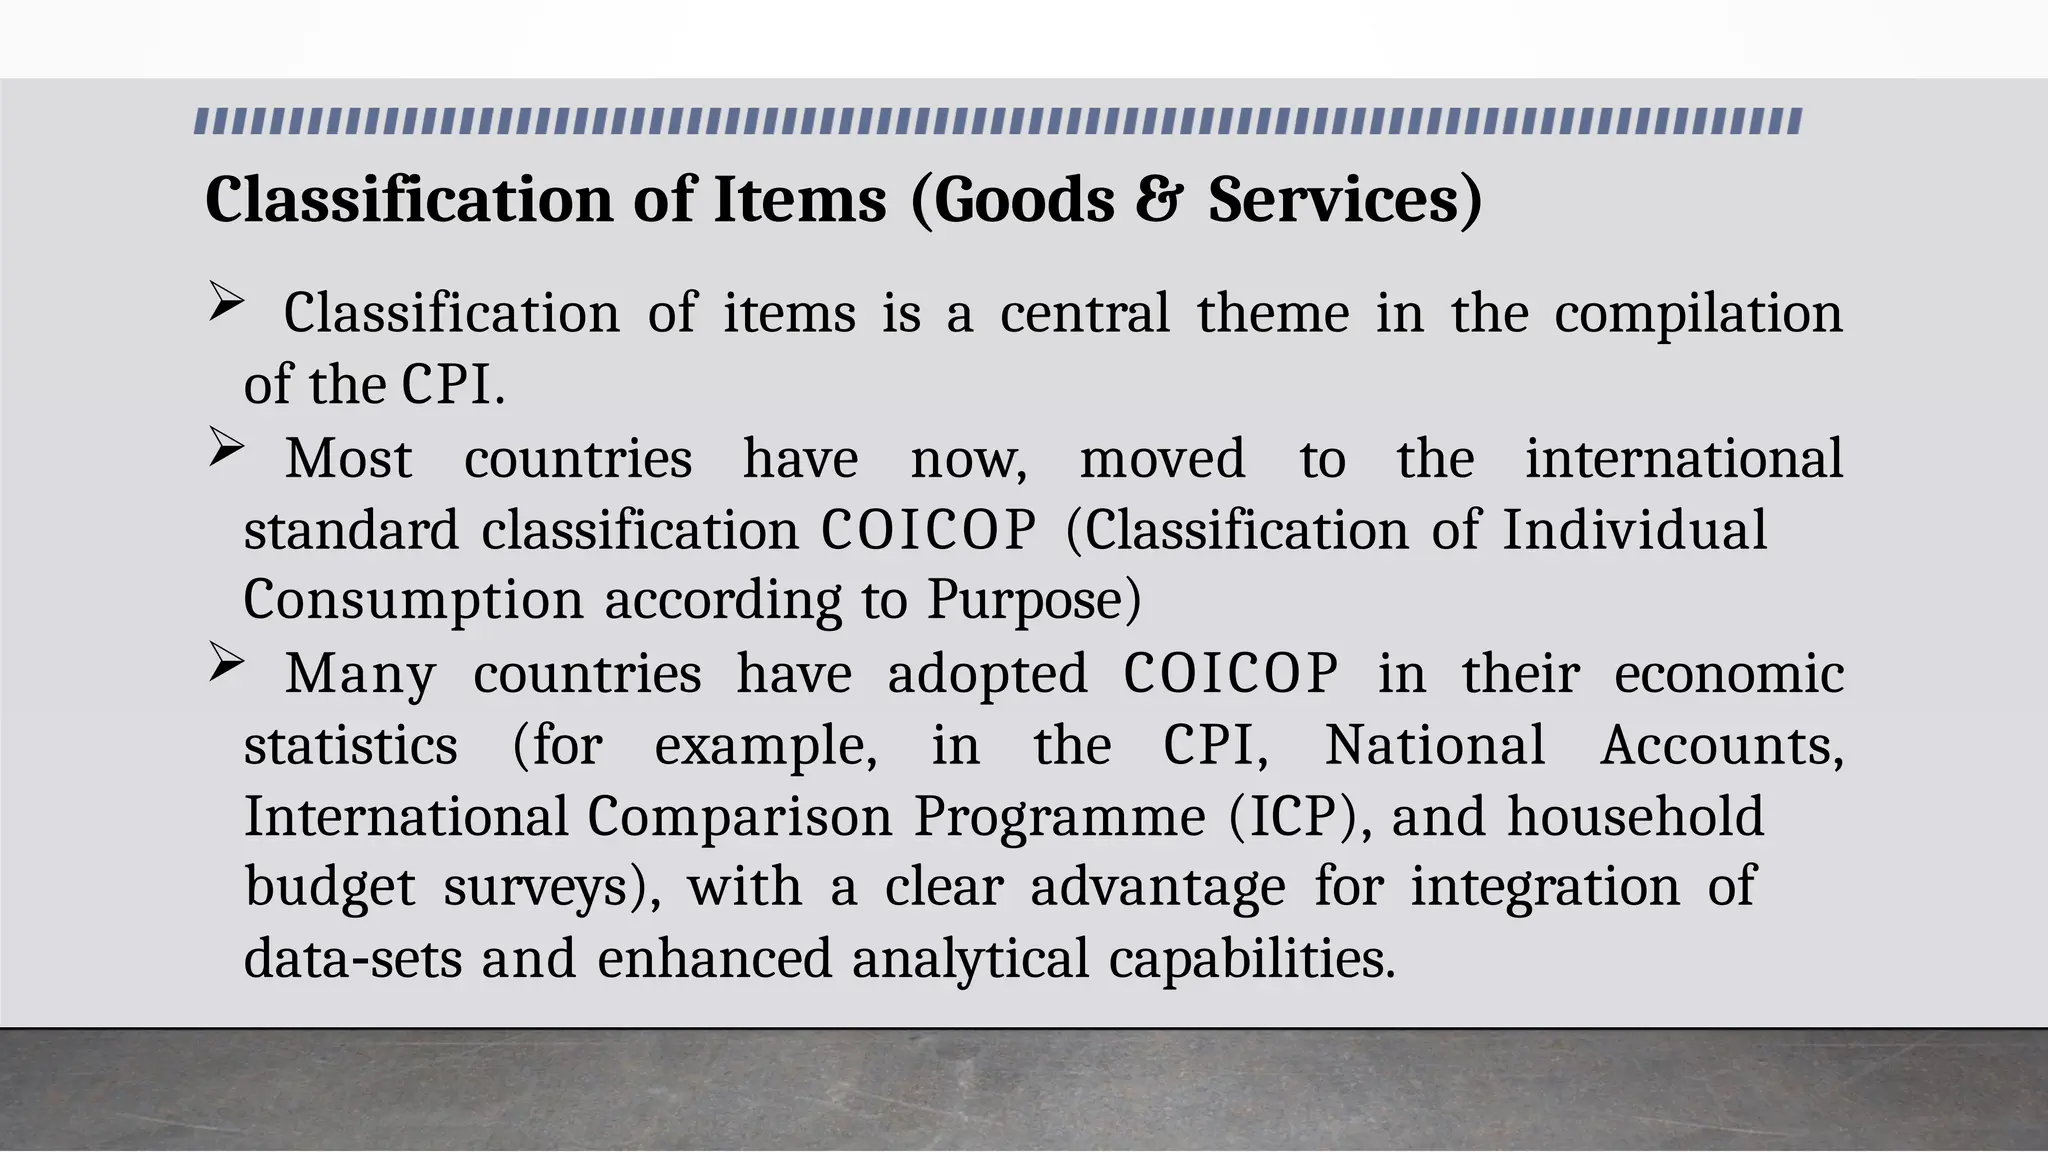
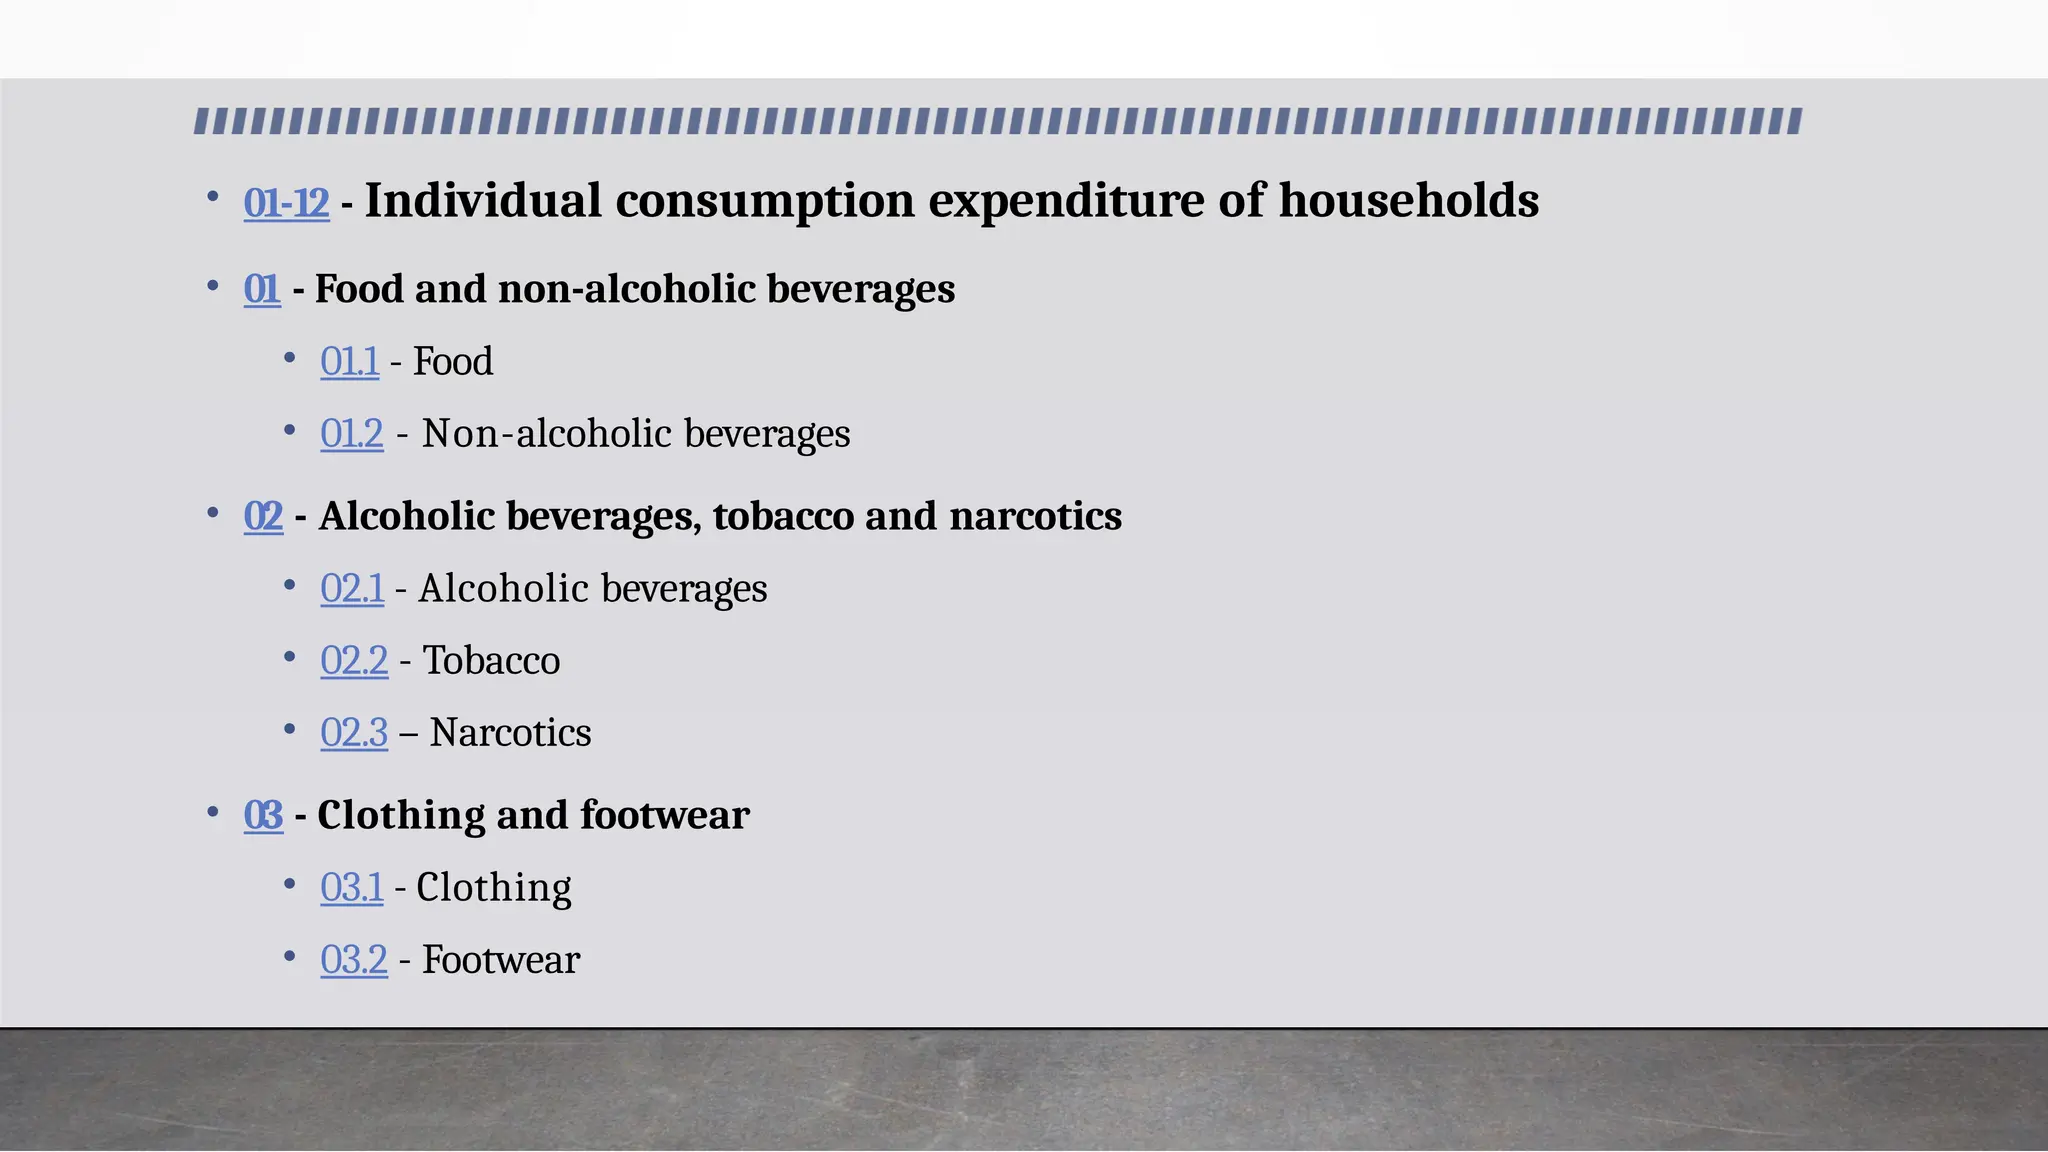
Classification of Items(Goods & Services)
Classification of items is a central theme in the compilation
of the CPI.
Most countries have now, moved to the international
standard classification COICOP (Classification of Individual
Consumption according to Purpose)
Many countries have adopted COICOP in their economic
statistics (for example, in the CPI, National Accounts,
International Comparison Programme (ICP), and household
budget surveys), with a clear advantage for integration of
data‐sets and enhanced analytical capabilities.
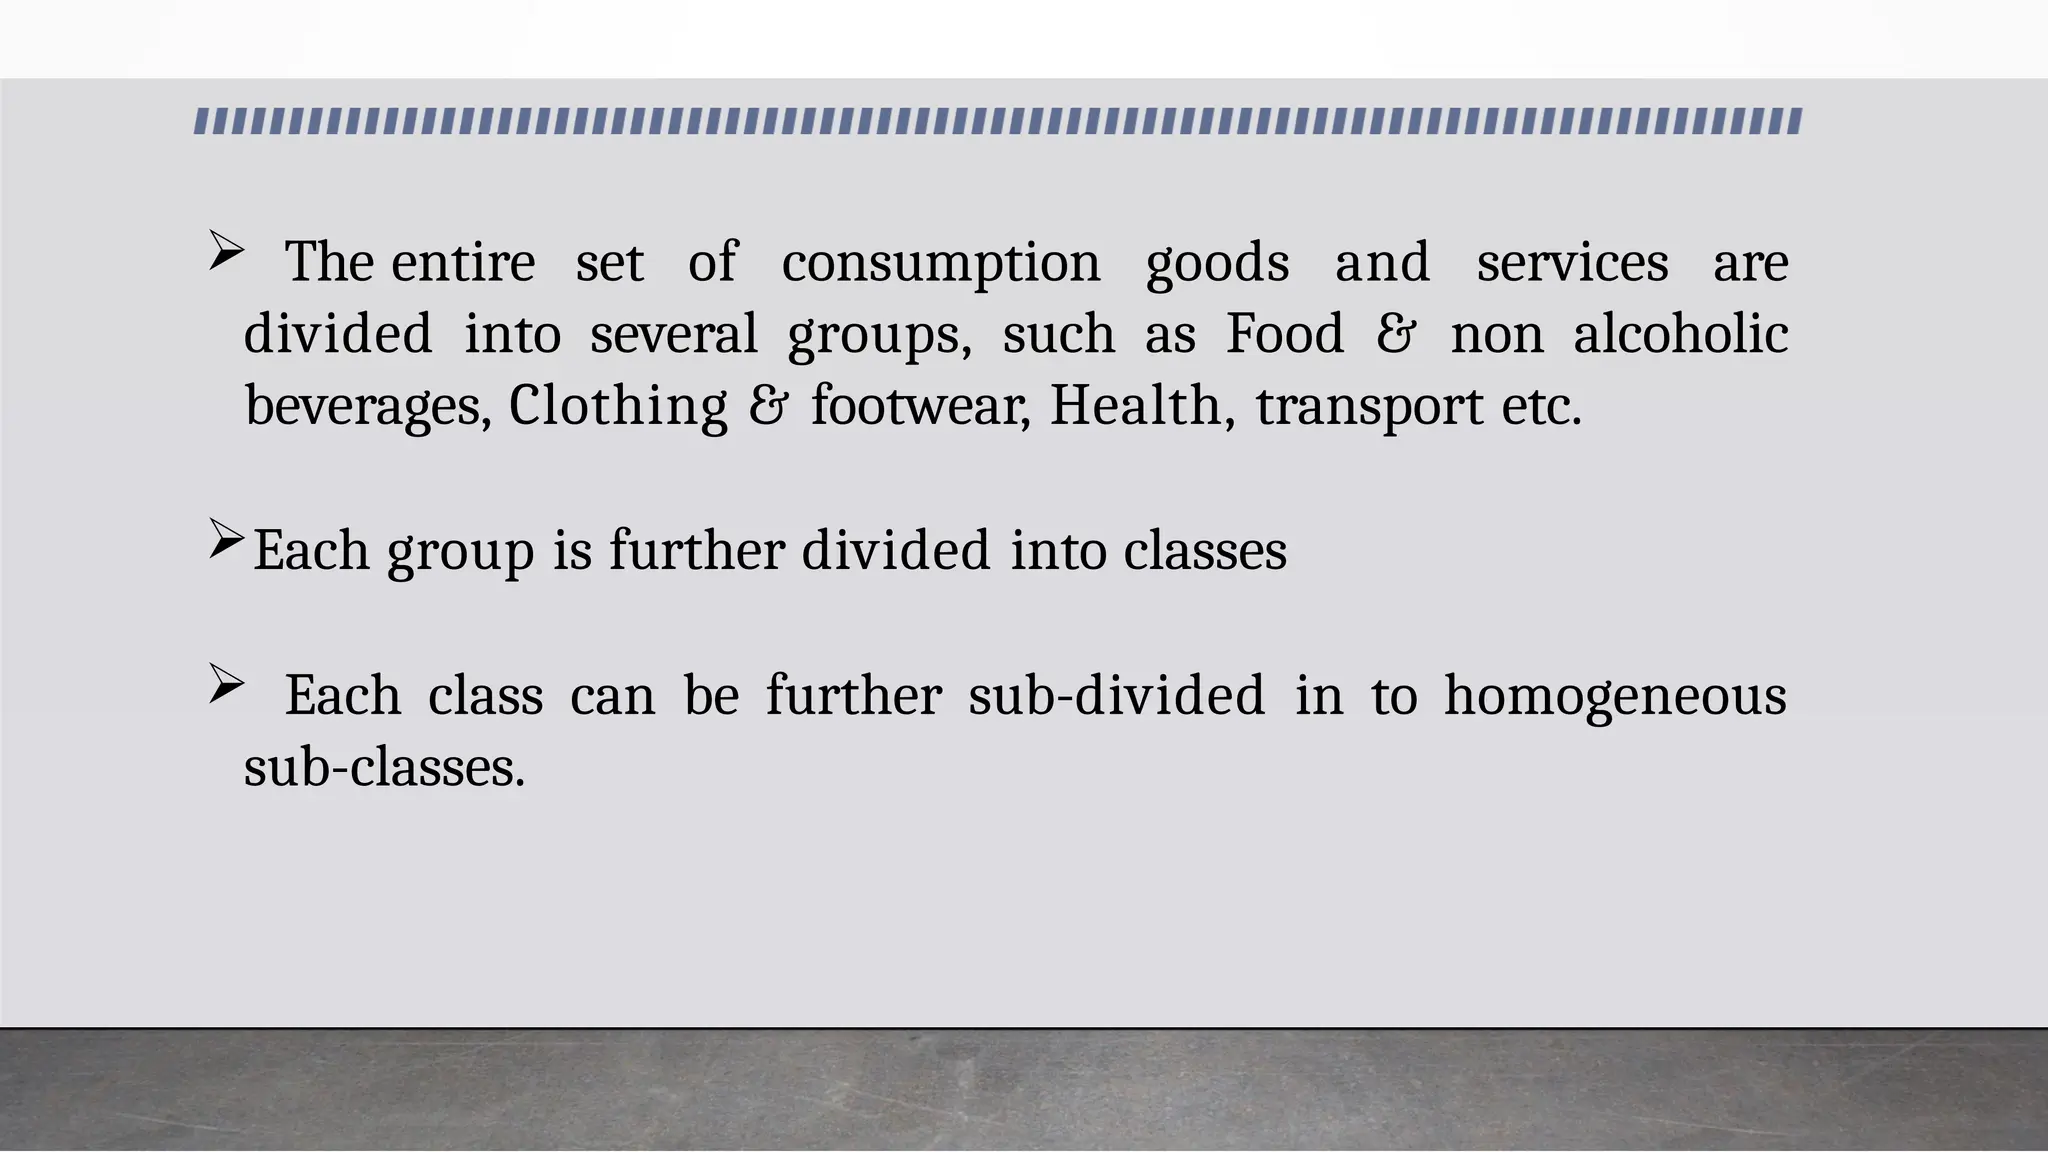
The entireset of consumption goods and services are
divided into several groups, such as Food & non alcoholic
beverages, Clothing & footwear, Health, transport etc.
Each group is further divided into classes
Each class can be further sub-divided in to homogeneous
sub-classes.
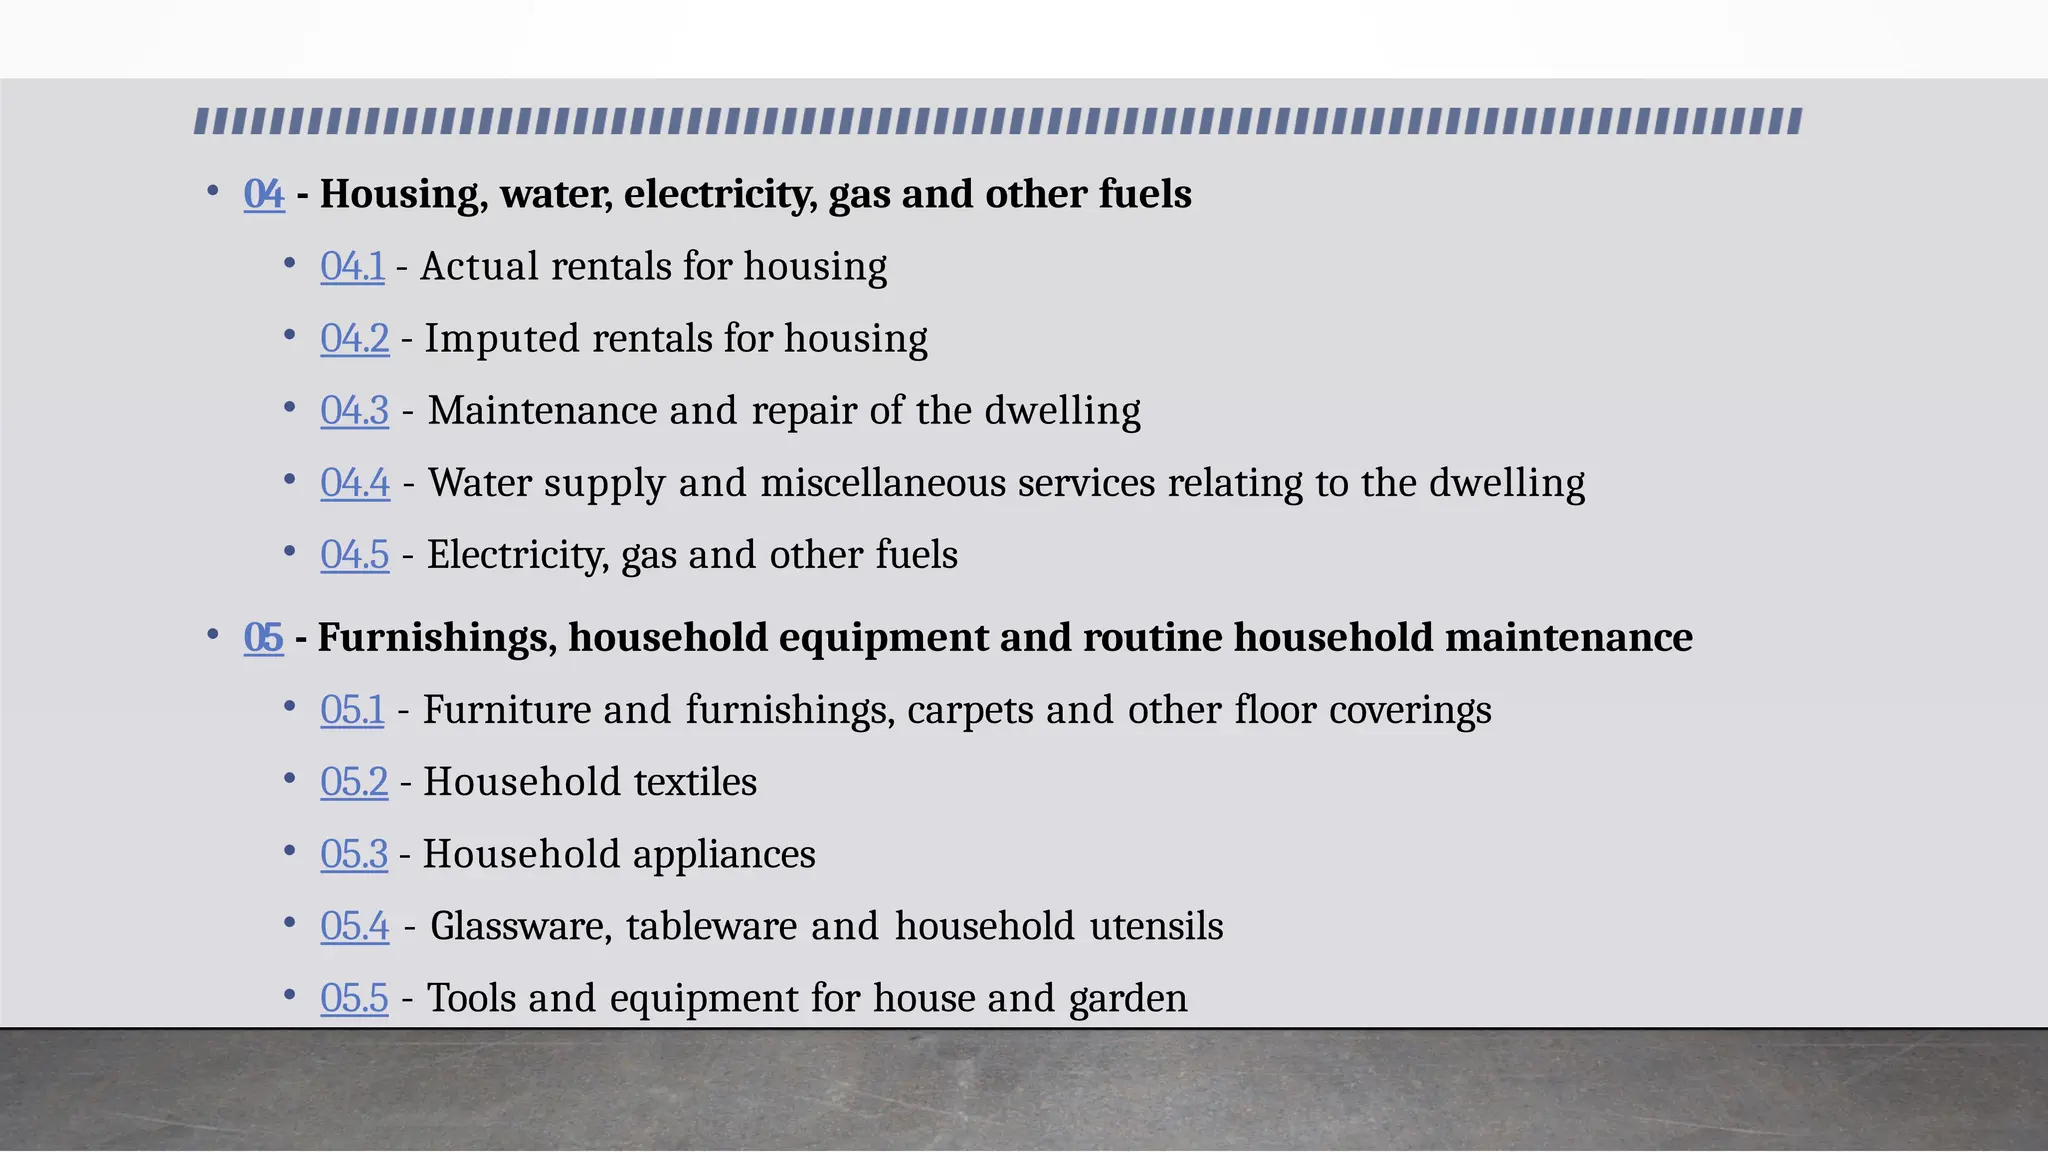
• 04 -Housing, water, electricity, gas and other fuels
• 04.1 - Actual rentals for housing
• 04.2 - Imputed rentals for housing
• 04.3 - Maintenance and repair of the dwelling
• 04.4 - Water supply and miscellaneous services relating to the dwelling
• 04.5 - Electricity, gas and other fuels
• 05 - Furnishings, household equipment and routine household maintenance
• 05.1 - Furniture and furnishings, carpets and other floor coverings
• 05.2 - Household textiles
• 05.3 - Household appliances
• 05.4 - Glassware, tableware and household utensils
• 05.5 - Tools and equipment for house and garden
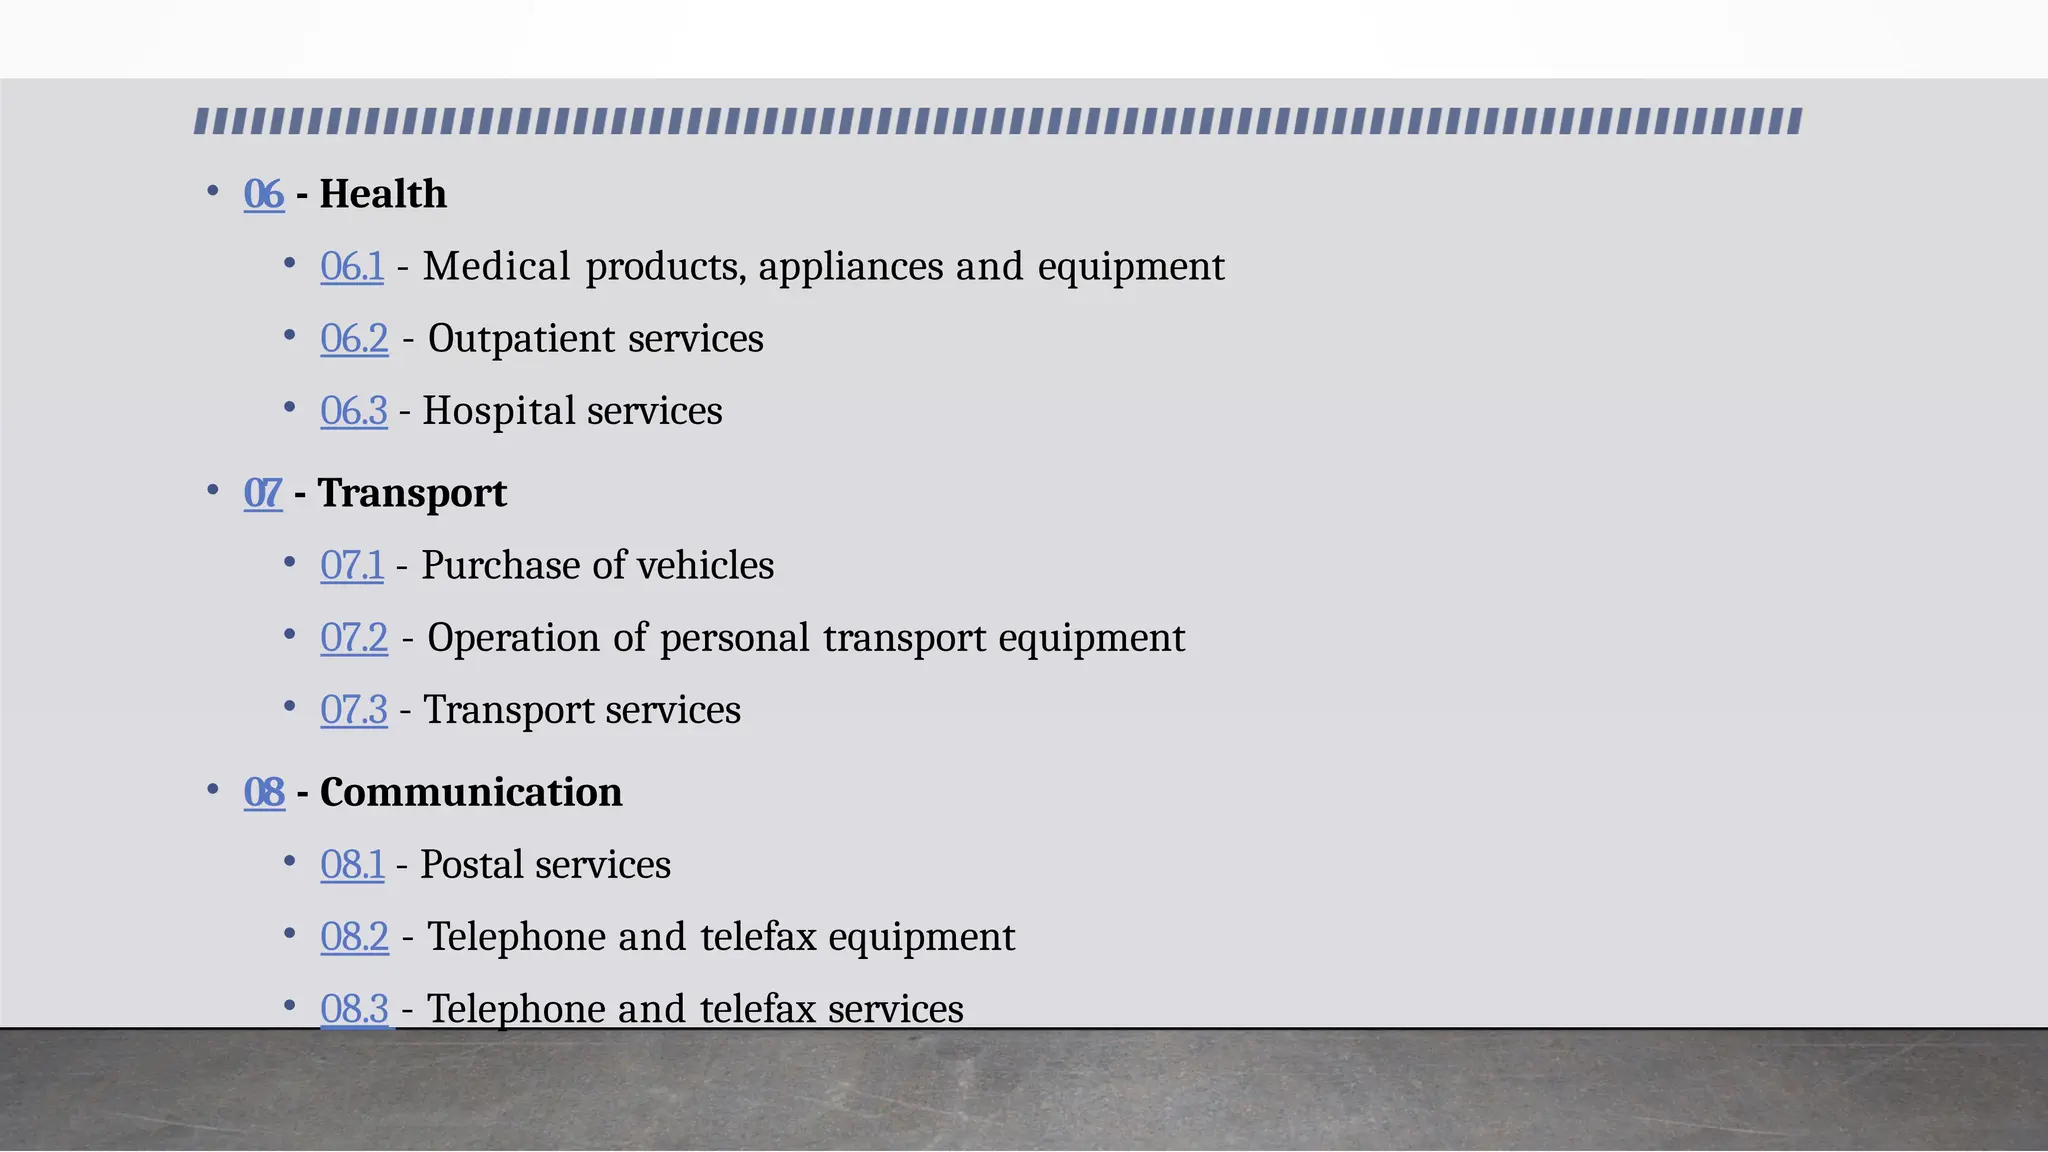
46.
• 06 -Health
• 06.1 - Medical products, appliances and equipment
• 06.2 - Outpatient services
• 06.3 - Hospital services
• 07 - Transport
• 07.1 - Purchase of vehicles
• 07.2 - Operation of personal transport equipment
• 07.3 - Transport services
• 08 - Communication
• 08.1 - Postal services
• 08.2 - Telephone and telefax equipment
• 08.3 - Telephone and telefax services
47.
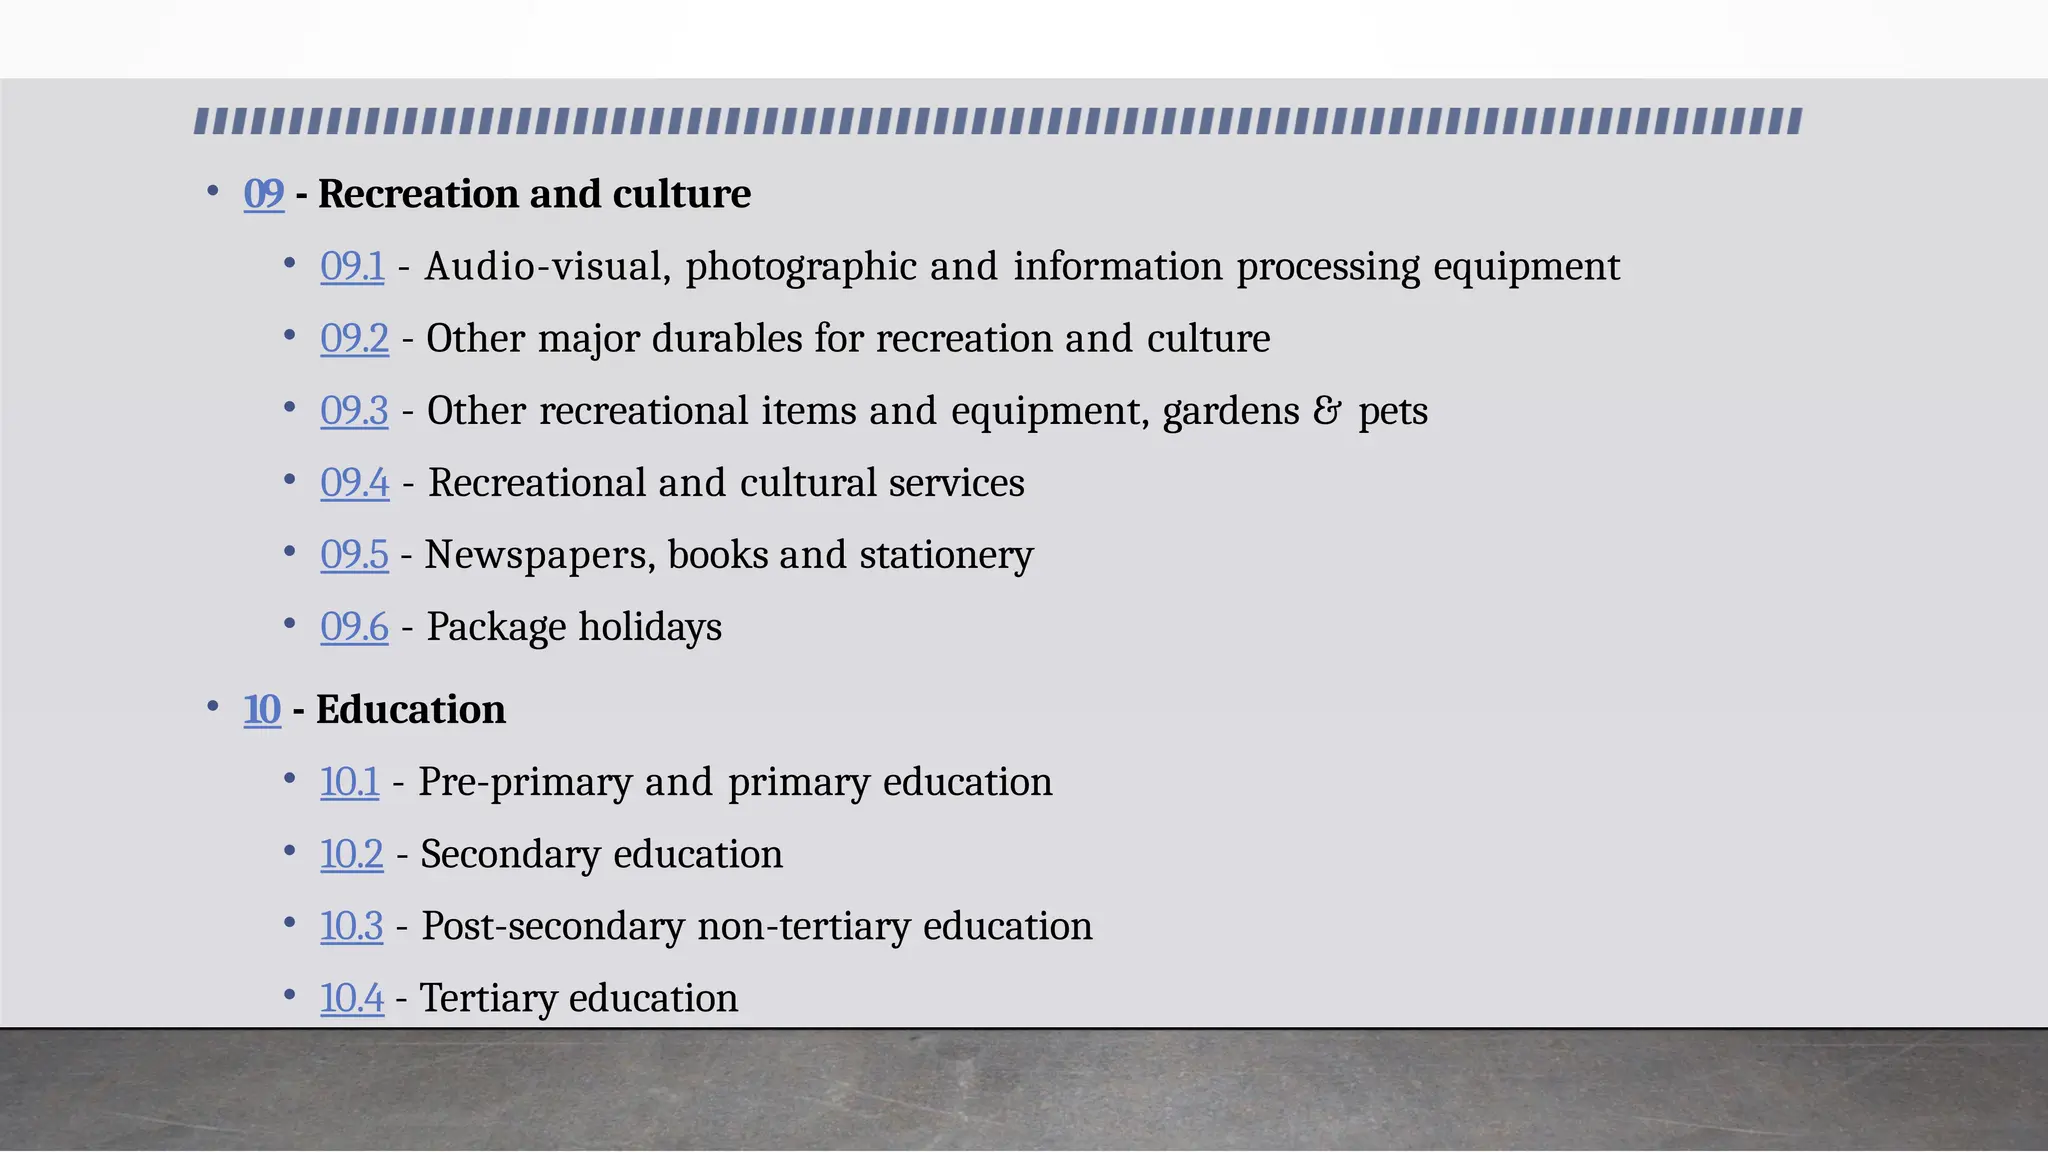
• 09 -Recreation and culture
• 09.1 - Audio-visual, photographic and information processing equipment
• 09.2 - Other major durables for recreation and culture
• 09.3 - Other recreational items and equipment, gardens & pets
• 09.4 - Recreational and cultural services
• 09.5 - Newspapers, books and stationery
• 09.6 - Package holidays
• 10 - Education
• 10.1 - Pre-primary and primary education
• 10.2 - Secondary education
• 10.3 - Post-secondary non-tertiary education
• 10.4 - Tertiary education
48.
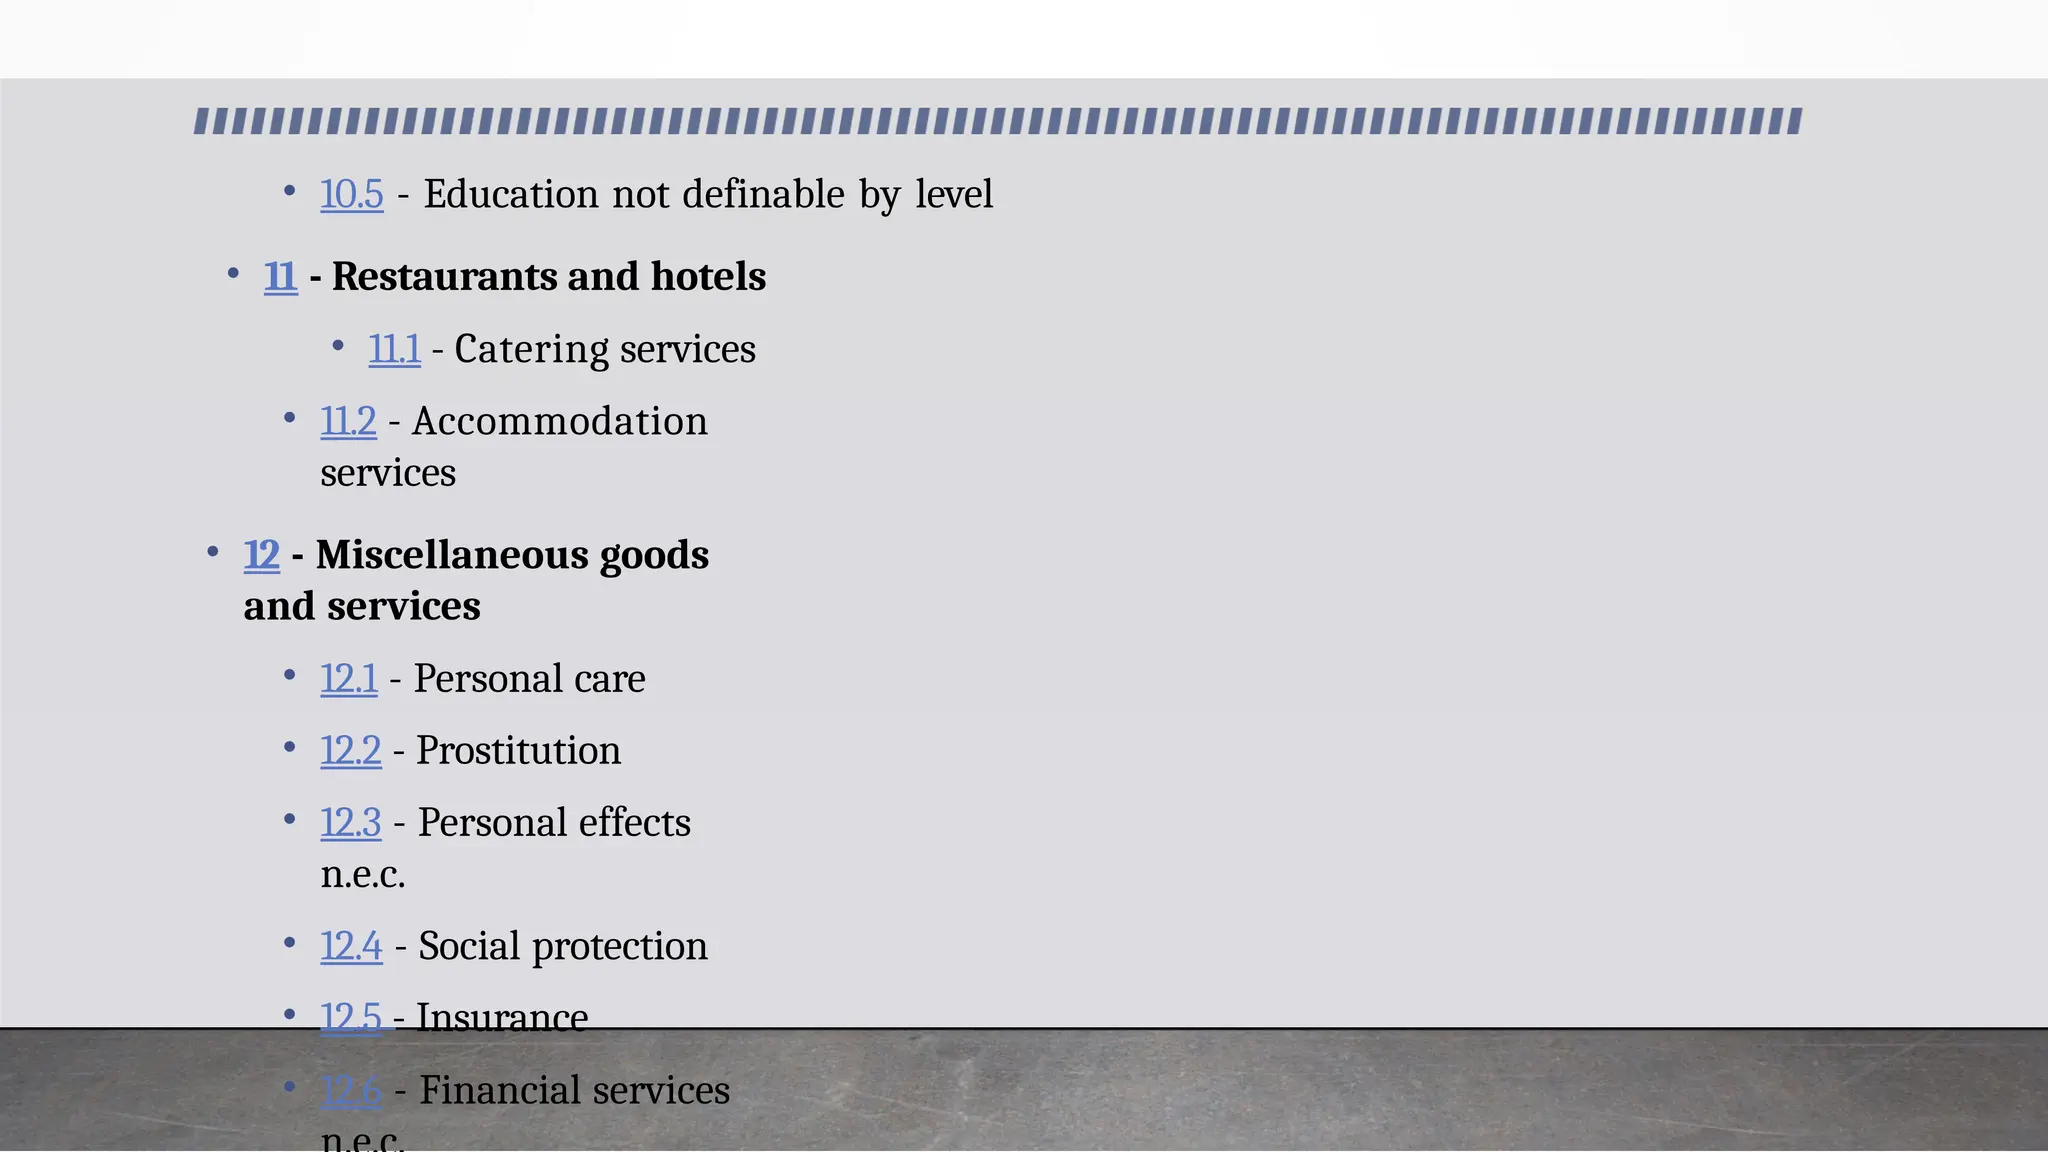
• 10.5 -Education not definable by level
• 11 - Restaurants and hotels
• 11.1 - Catering services
• 11.2 - Accommodation
services
• 12 - Miscellaneous goods
and services
• 12.1 - Personal care
• 12.2 - Prostitution
• 12.3 - Personal effects
n.e.c.
• 12.4 - Social protection
• 12.5 - Insurance
• 12.6 - Financial services
49.
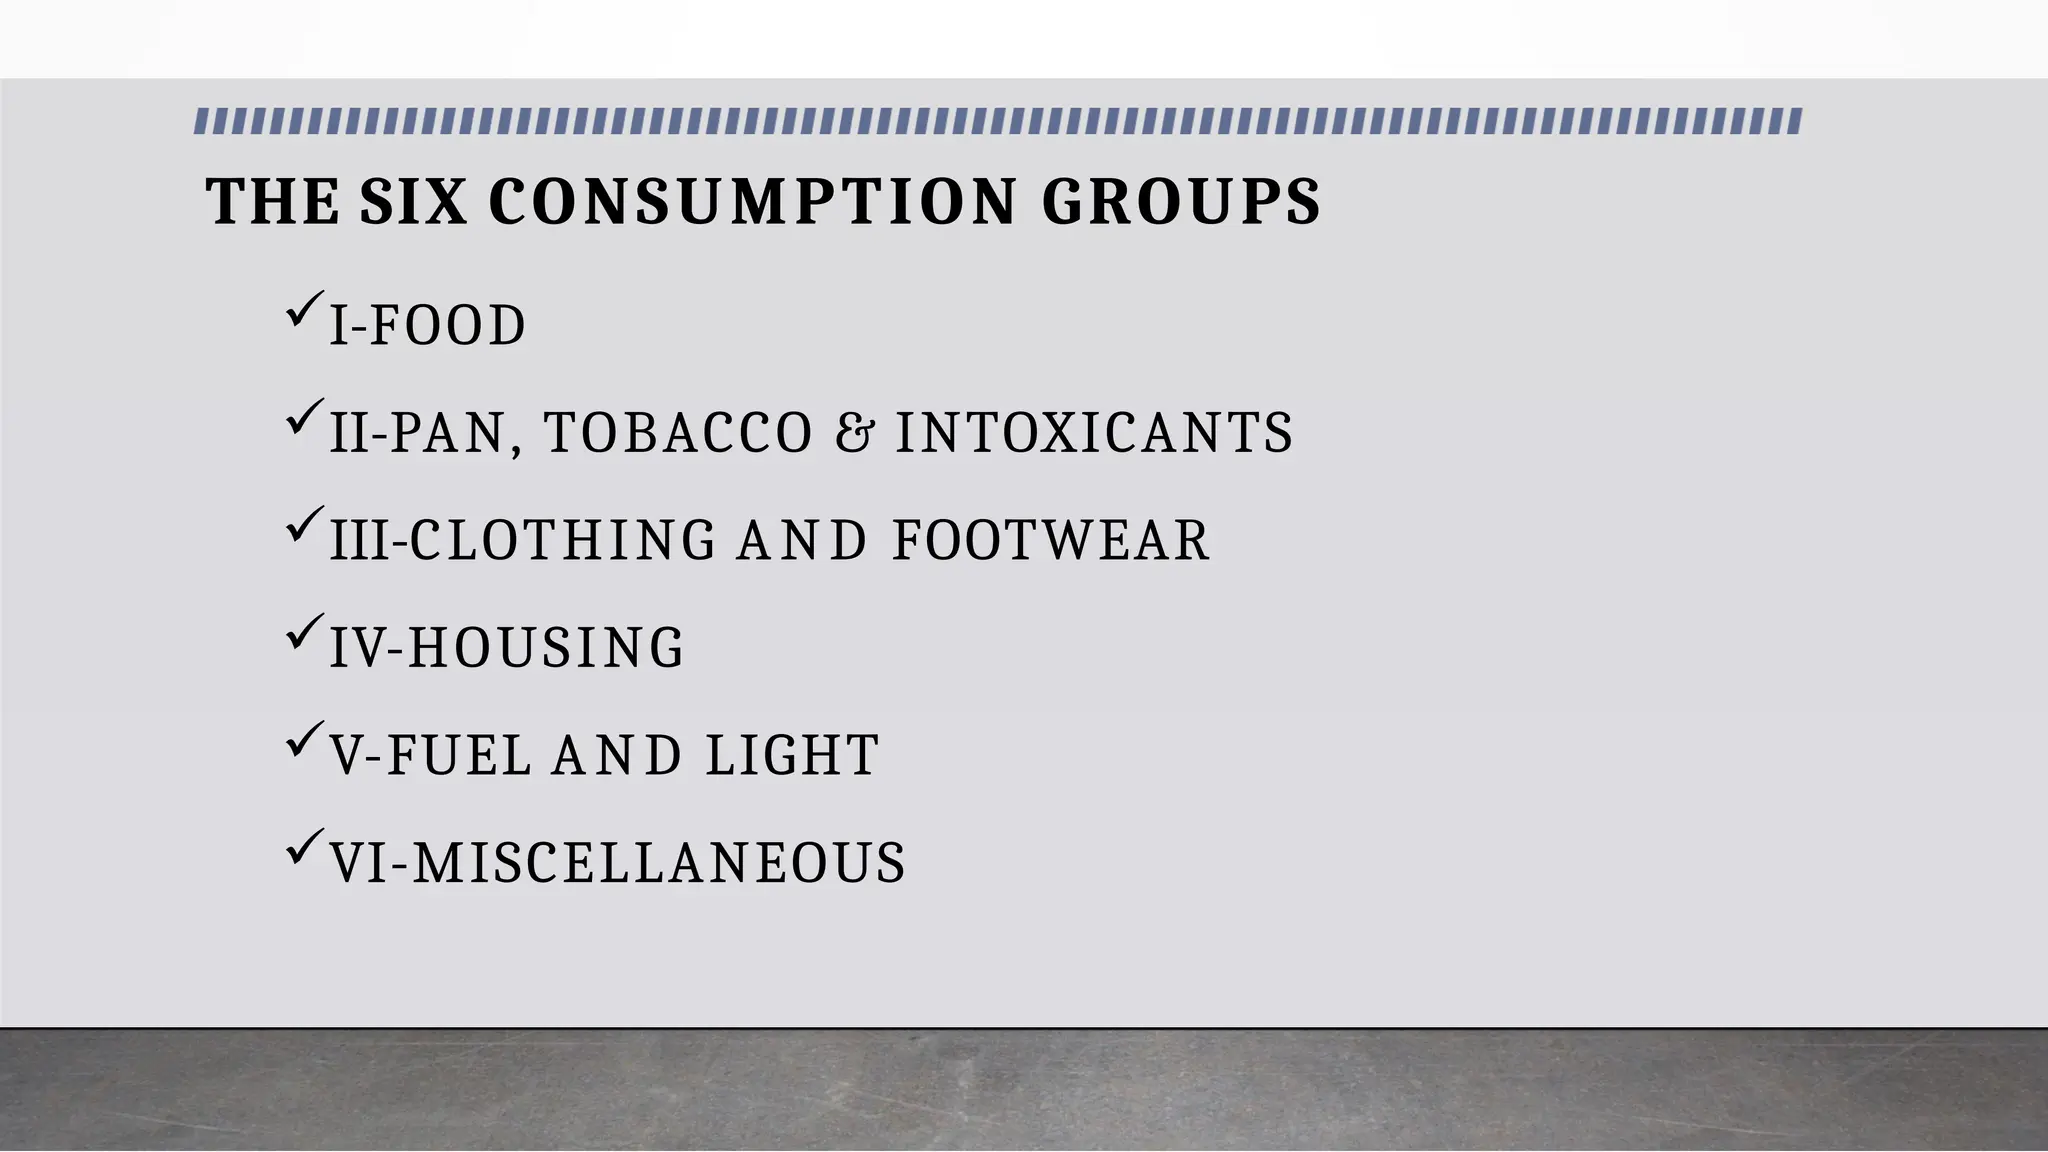
THE SIX CONSUMPTIONGROUPS
I-FOOD
II-PAN, TOBACCO & INTOXICANTS
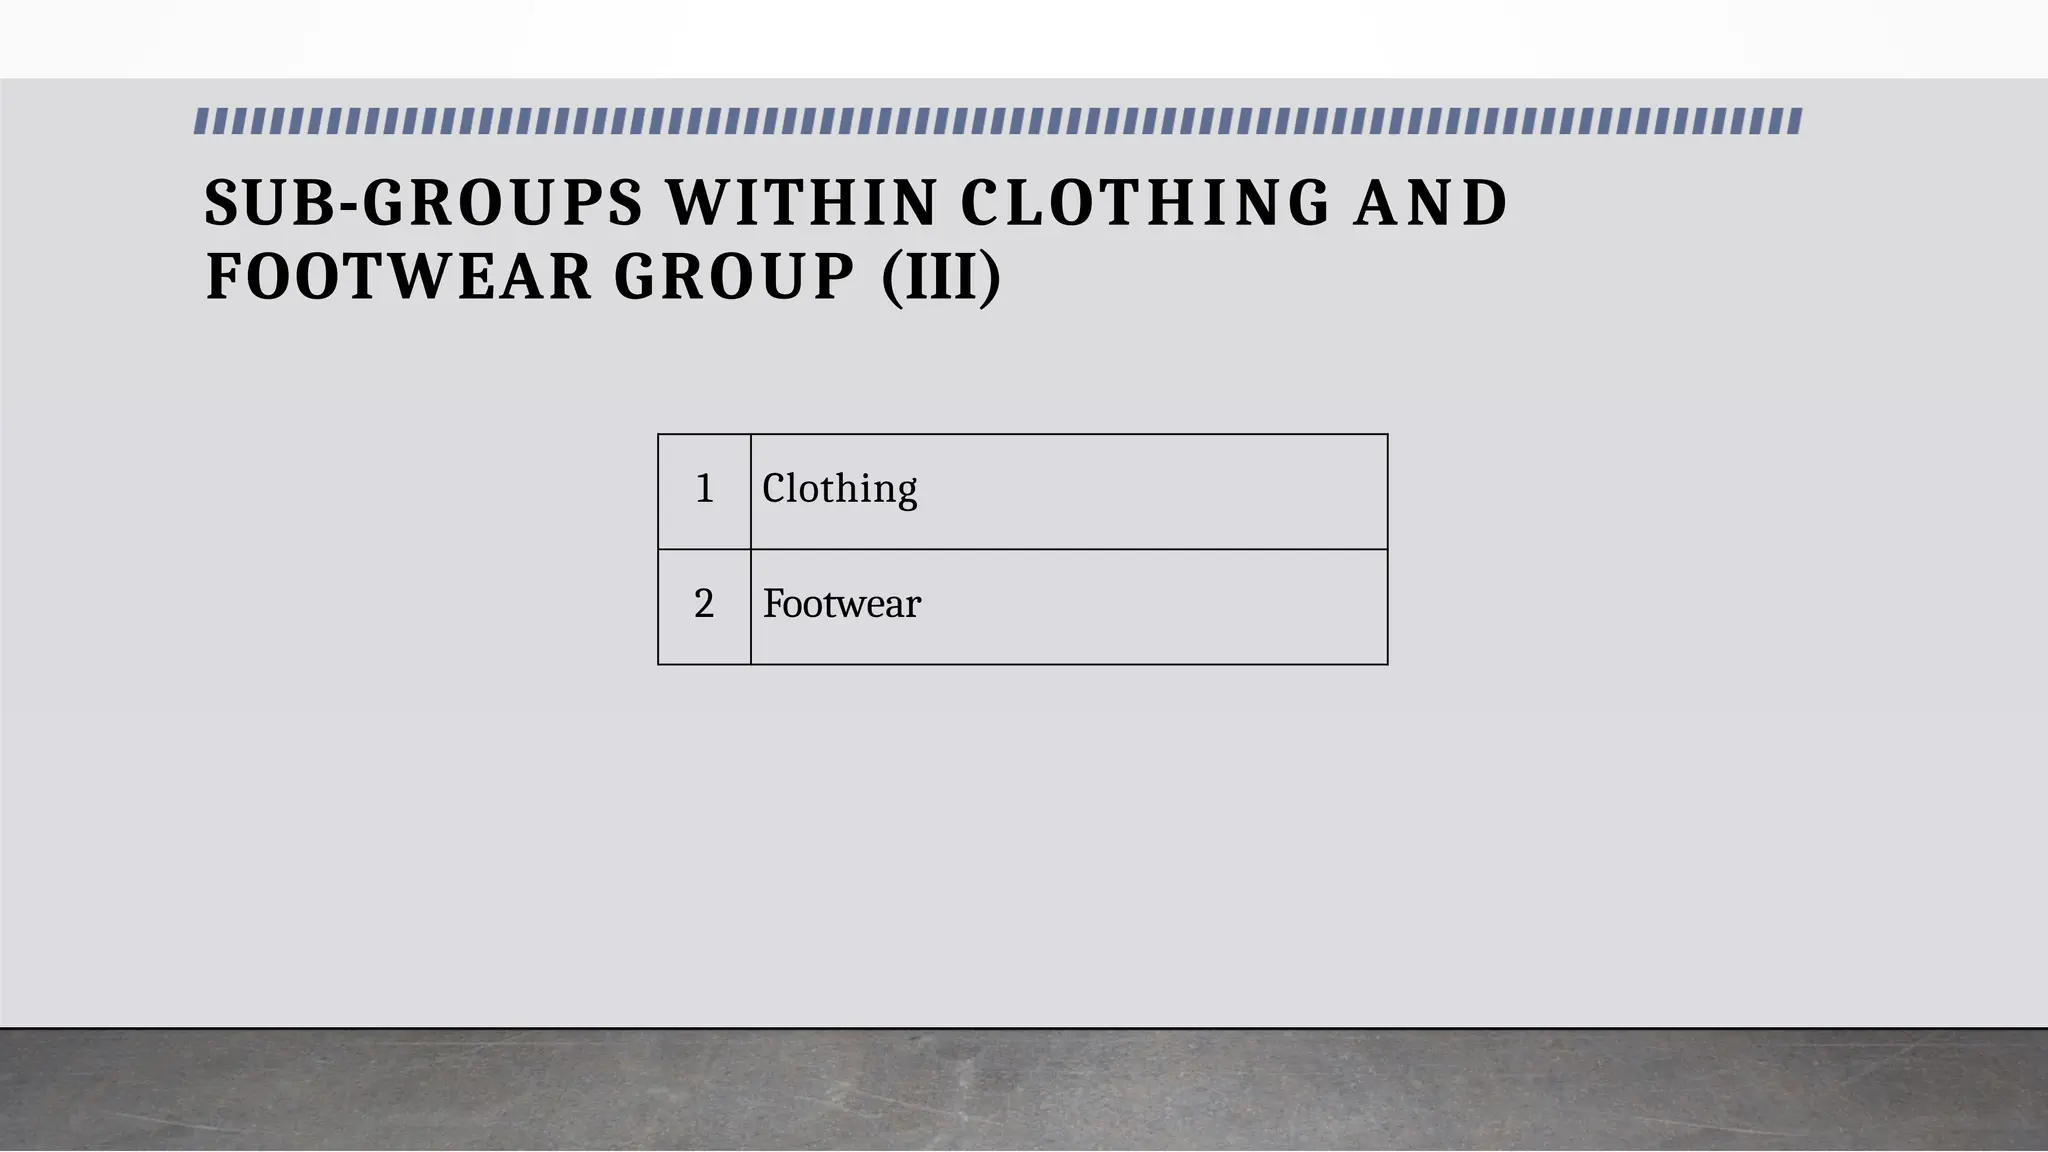
III-CLOTHING AND FOOTWEAR
IV-HOUSING
V-FUEL AND LIGHT
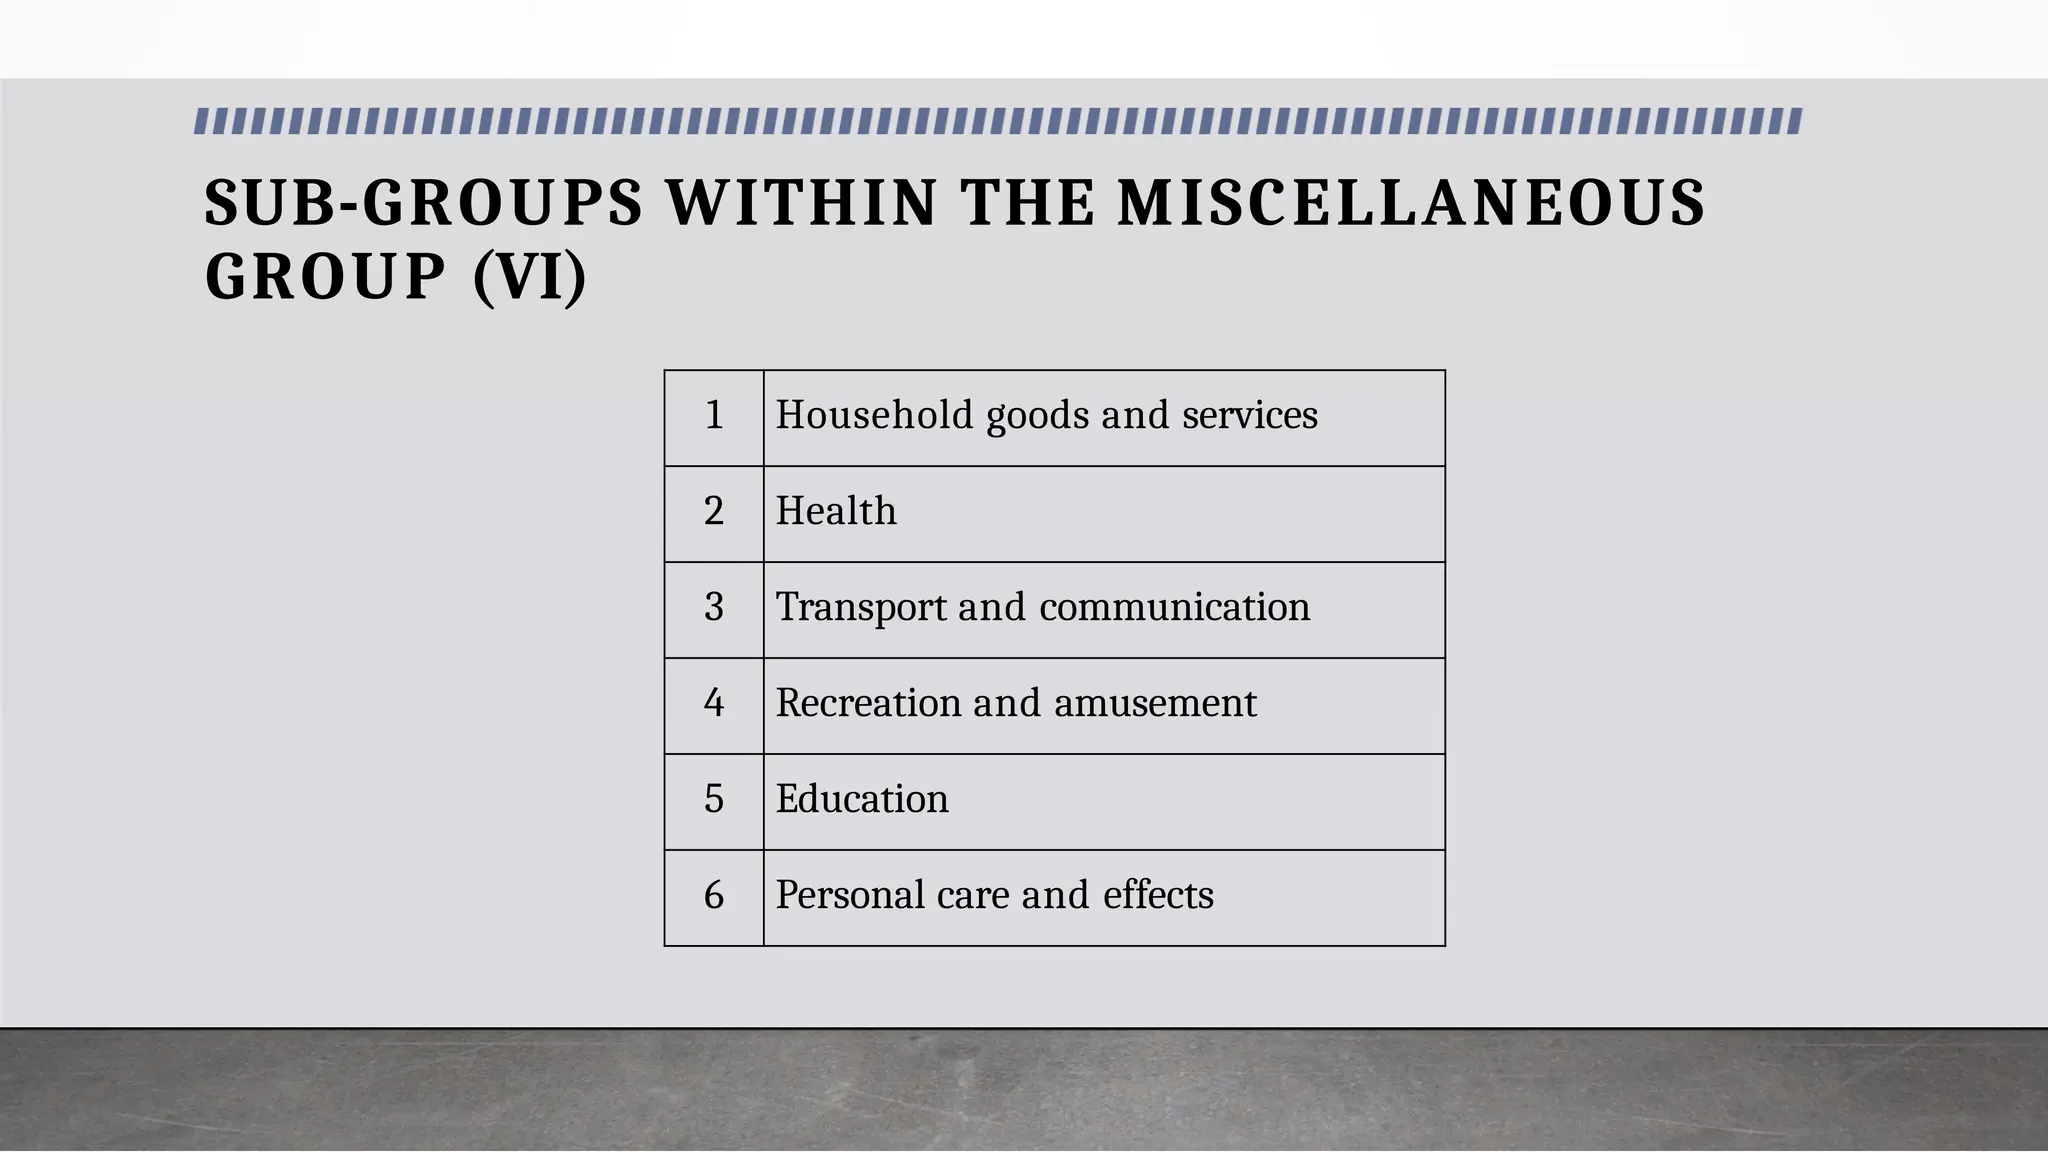
VI-MISCELLANEOUS
50.
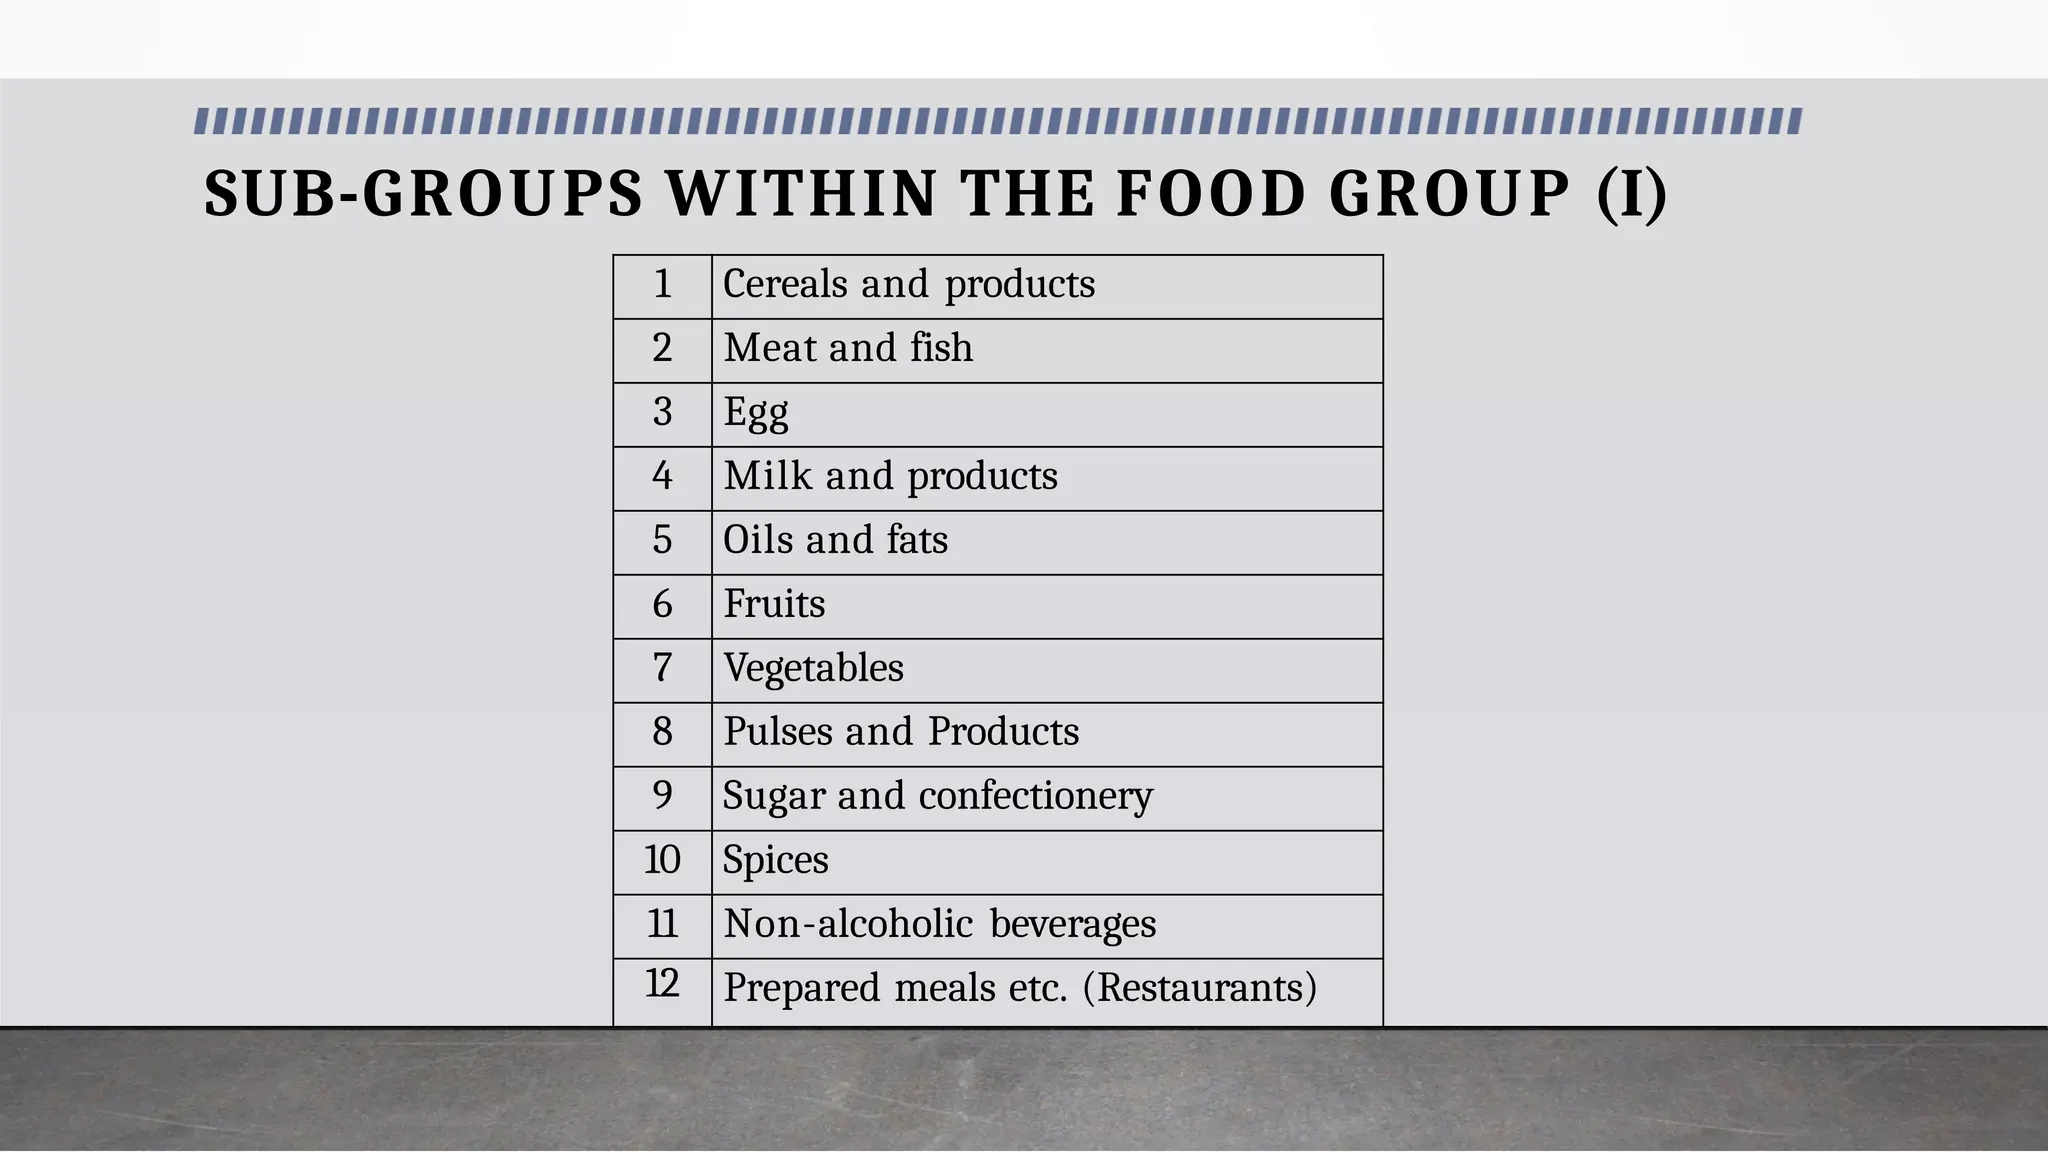
SUB-GROUPS WITHIN THEFOOD GROUP (I)
1 Cereals and products
2 Meat and fish
3 Egg
4 Milk and products
5 Oils and fats
6 Fruits
7 Vegetables
8 Pulses and Products
9 Sugar and confectionery
10 Spices
11 Non-alcoholic beverages
12 Prepared meals etc. (Restaurants)
SUB-GROUPS WITHIN THEMISCELLANEOUS
GROUP (VI)
1 Household goods and services
2 Health
3 Transport and communication
4 Recreation and amusement
5 Education
6 Personal care and effects
53.
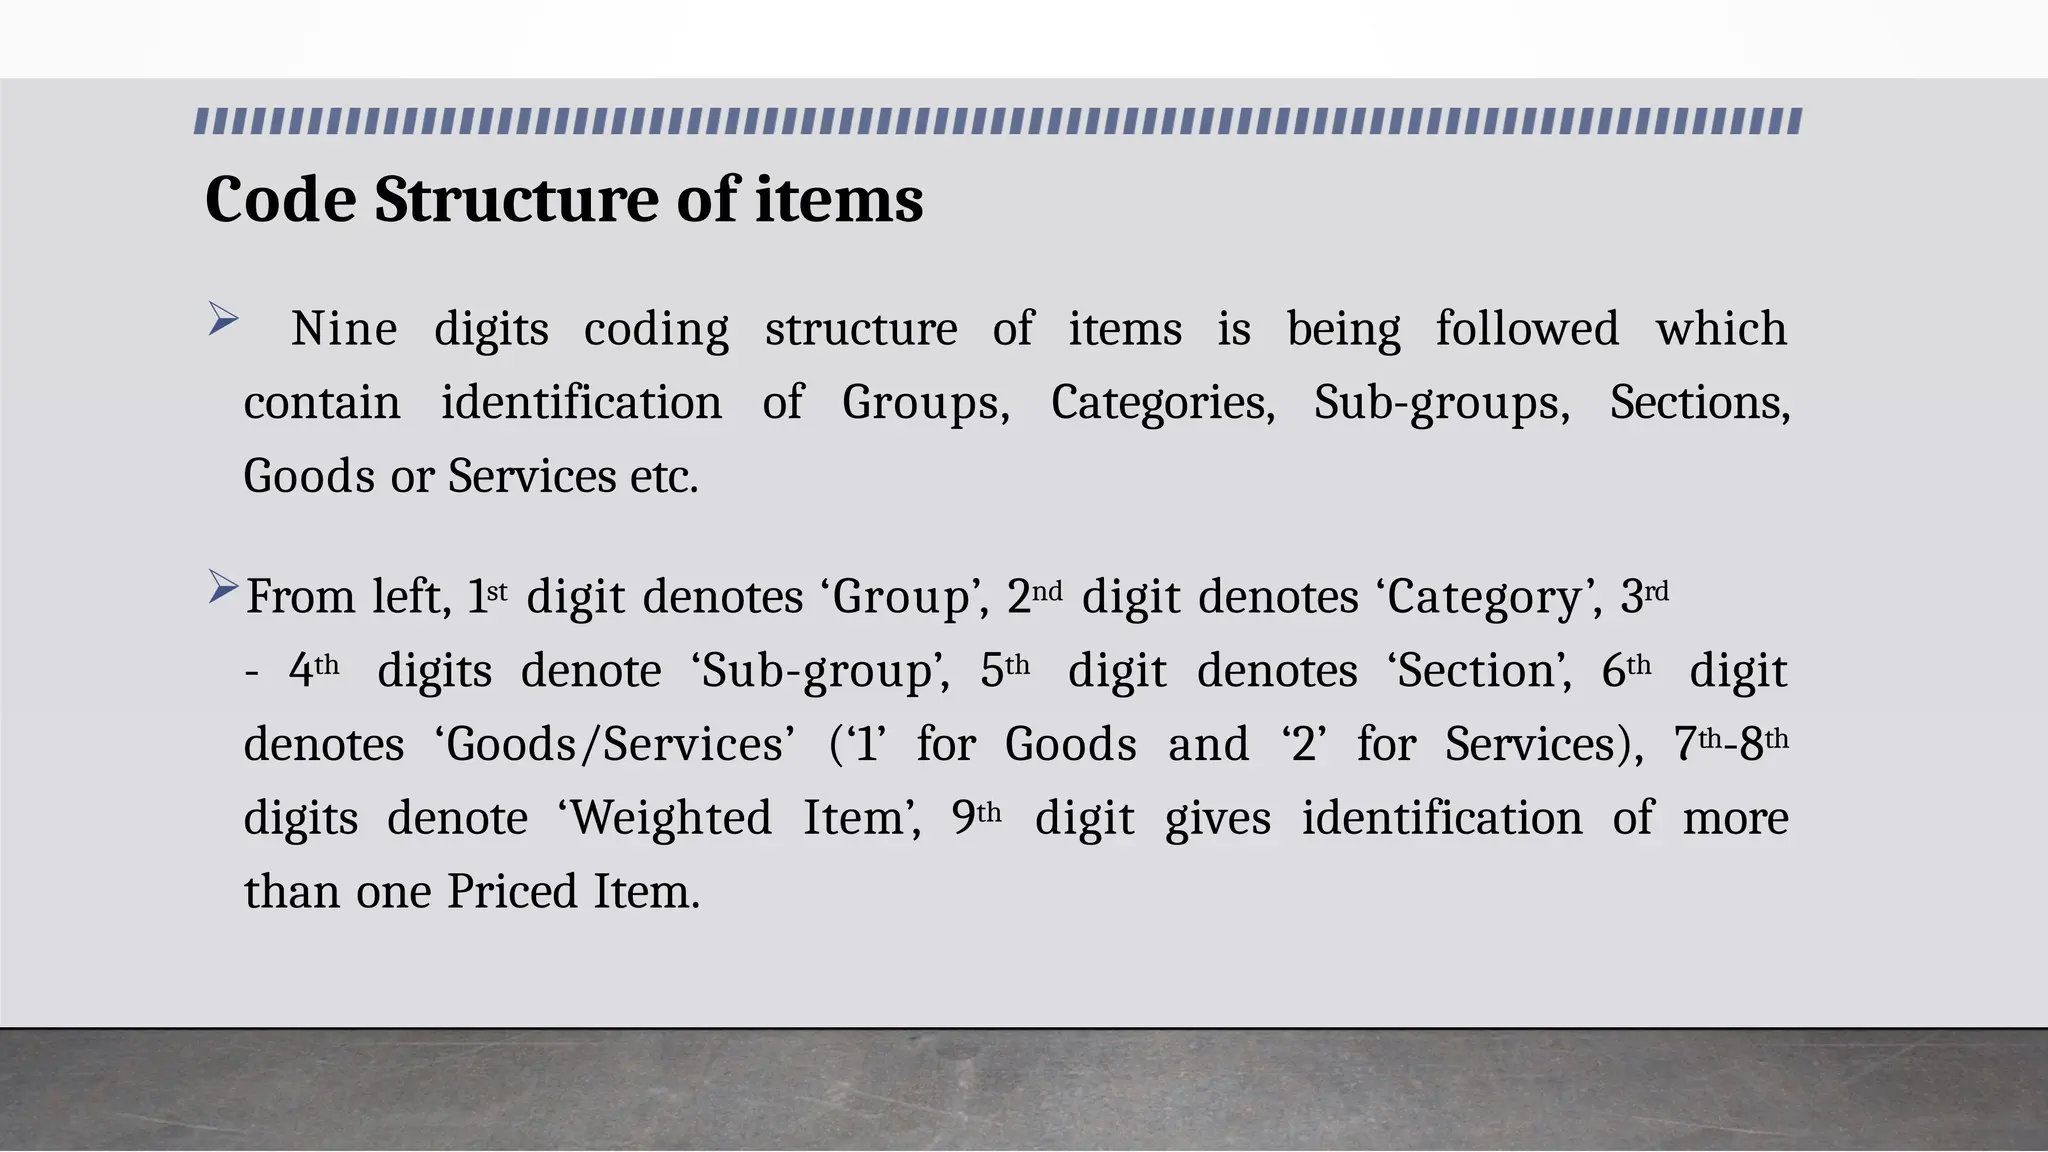
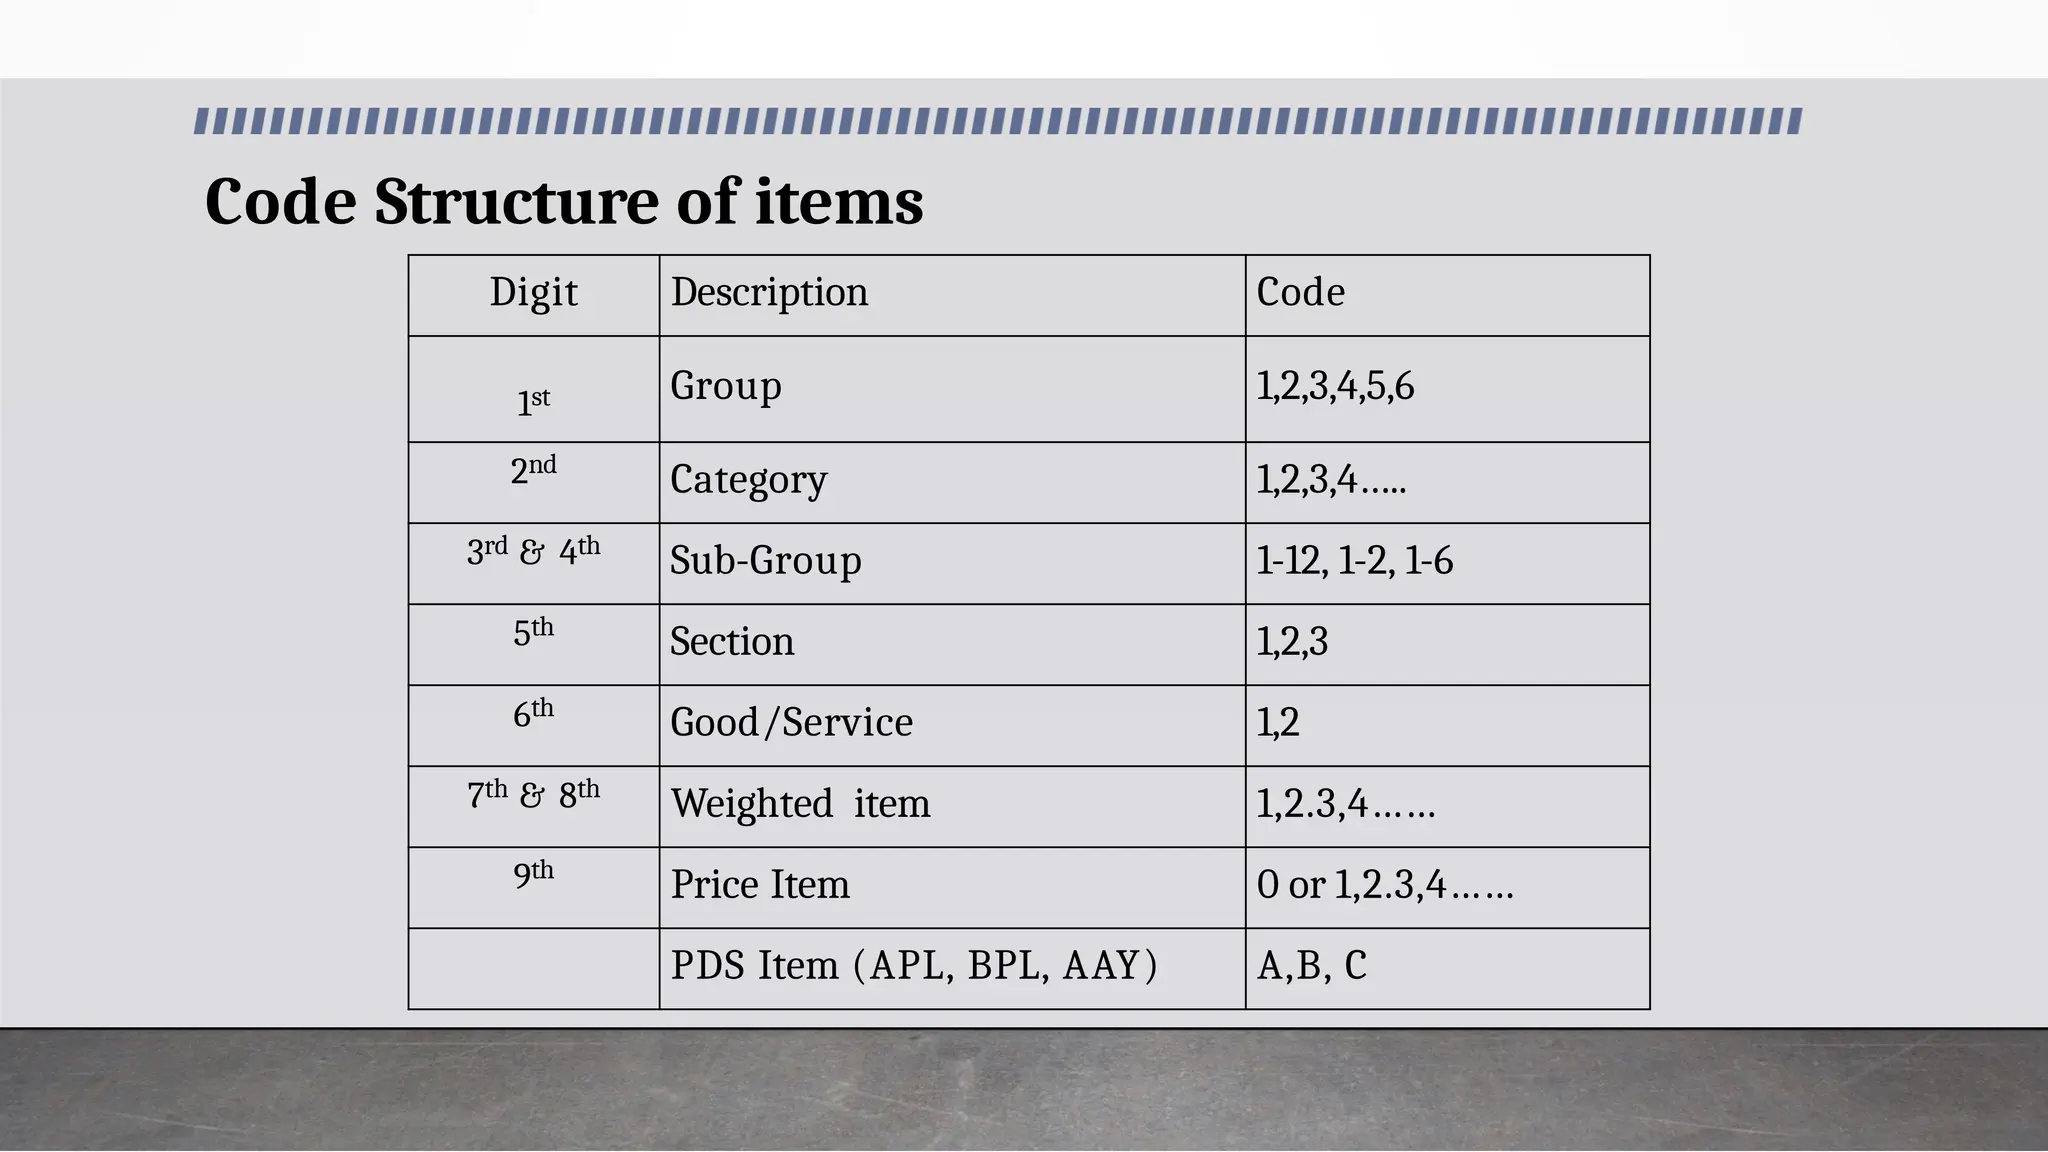
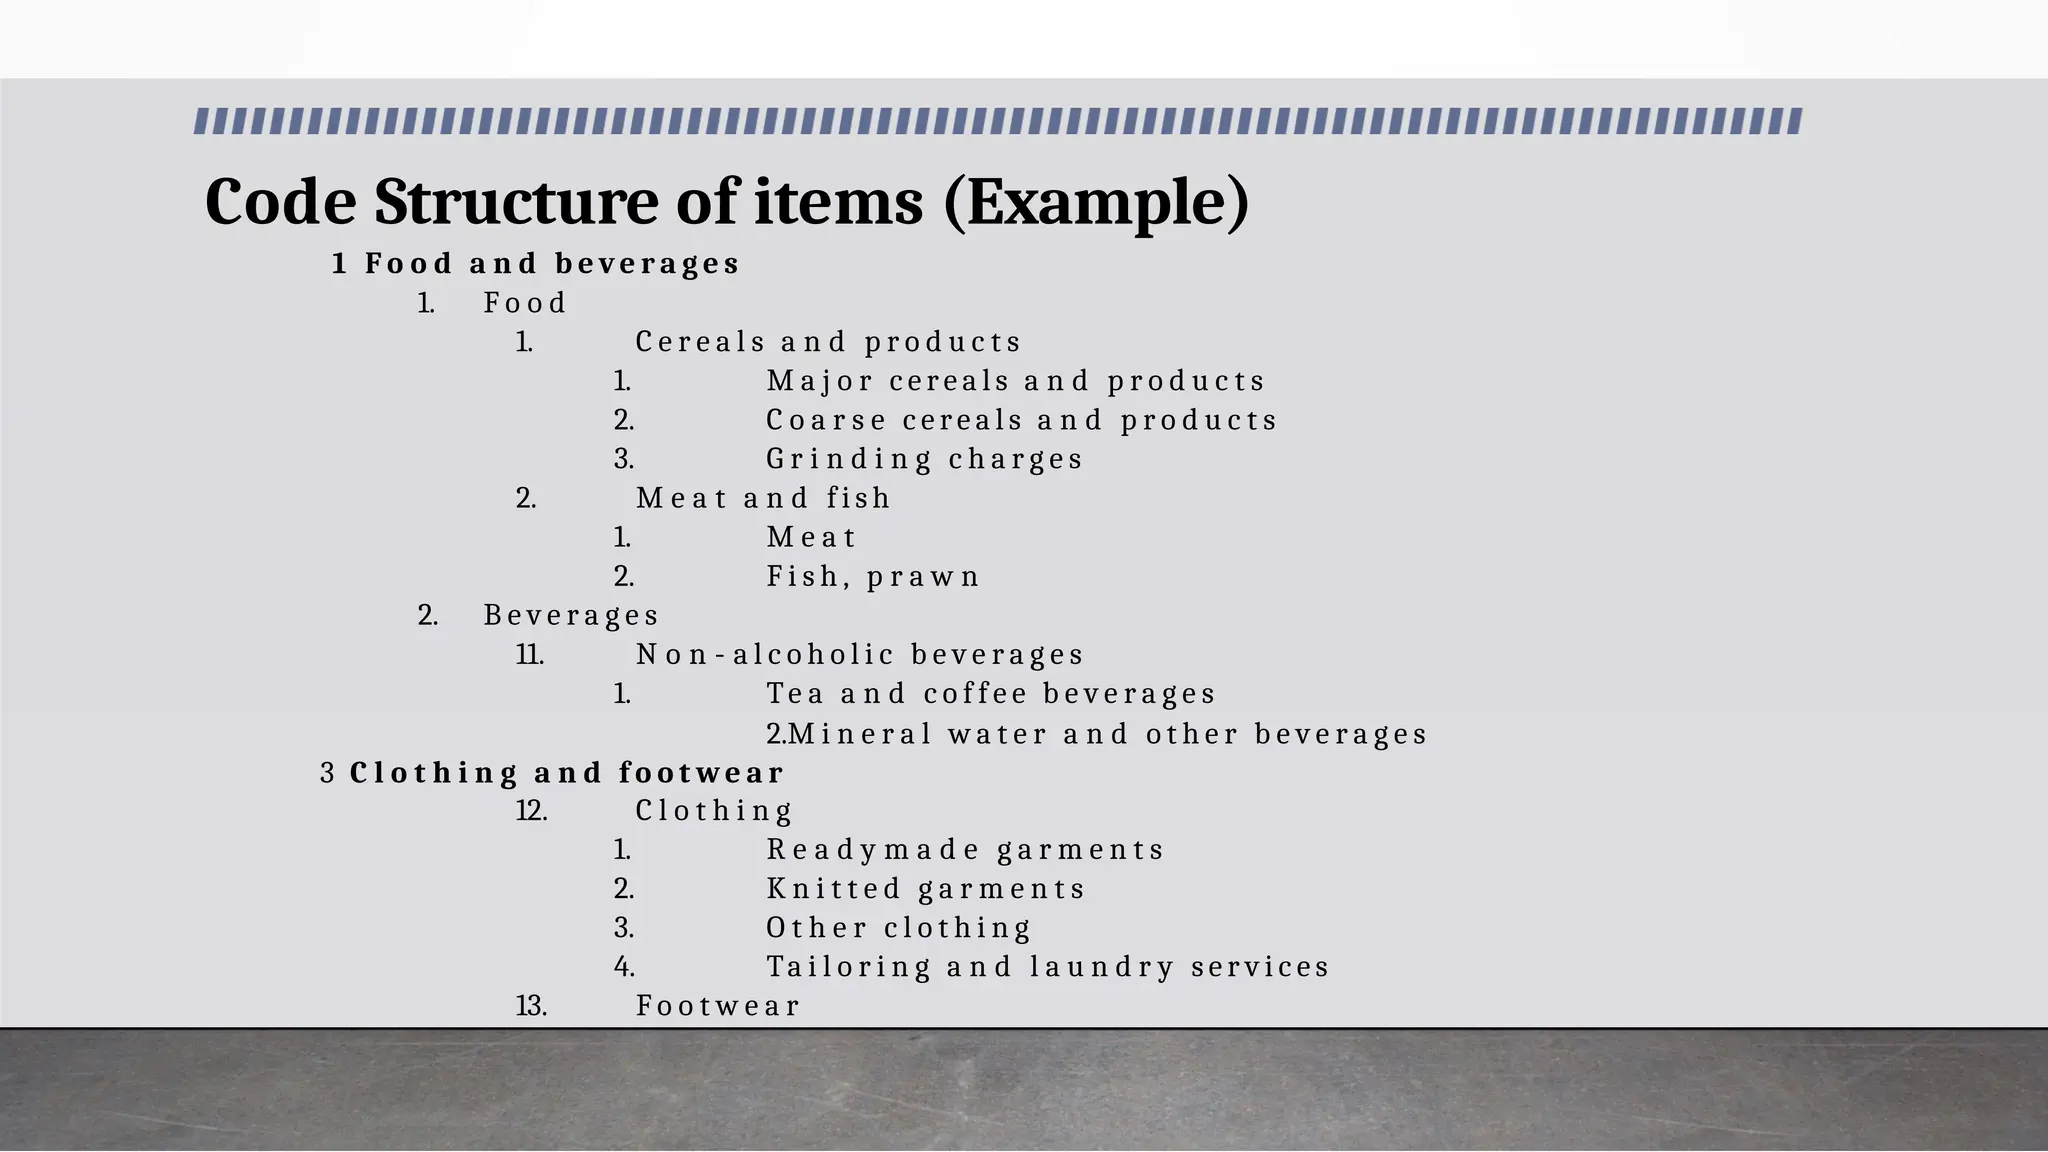
Code Structure ofitems
Nine digits coding structure of items is being followed which
contain identification of Groups, Categories, Sub-groups, Sections,
Goods or Services etc.
From left, 1st digit denotes ‘Group’, 2nd digit denotes ‘Category’, 3rd
- 4th digits denote ‘Sub-group’, 5th digit denotes ‘Section’, 6th digit
denotes ‘Goods/Services’ (‘1’ for Goods and ‘2’ for Services), 7th-8th
digits denote ‘Weighted Item’, 9th digit gives identification of more
than one Priced Item.
Code Structure ofitems (Example)
1 F o o d a n d b e ve r a g e s
1. F o o d
1. C e r e a l s a n d p r o d u c t s
1. M a j o r c e r e a l s a n d p r o d u c t s
2. C o a r s e c e r e a l s a n d p r o d u c t s
3. G r i n d i n g c h a r g e s
2. M e a t a n d f i s h
1. M e a t
2. F i s h , p r a w n
2. B e v e r a g e s
11. N o n - a l c o h o l i c b e v e r a g e s
1. Te a a n d c o f f e e b e v e r a g e s
2.M i n e r a l w a t e r a n d o t h e r b e v e r a g e s
3 C l o t h i n g a n d f o o t w e a r
12. C l o t h i n g
1. R e a d y m a d e g a r m e n t s
2. K n i t t e d g a r m e n t s
3. O t h e r c l o t h i n g
4. Ta i l o r i n g a n d l a u n d r y s e r v i c e s
13. F o o t w e a r
56.
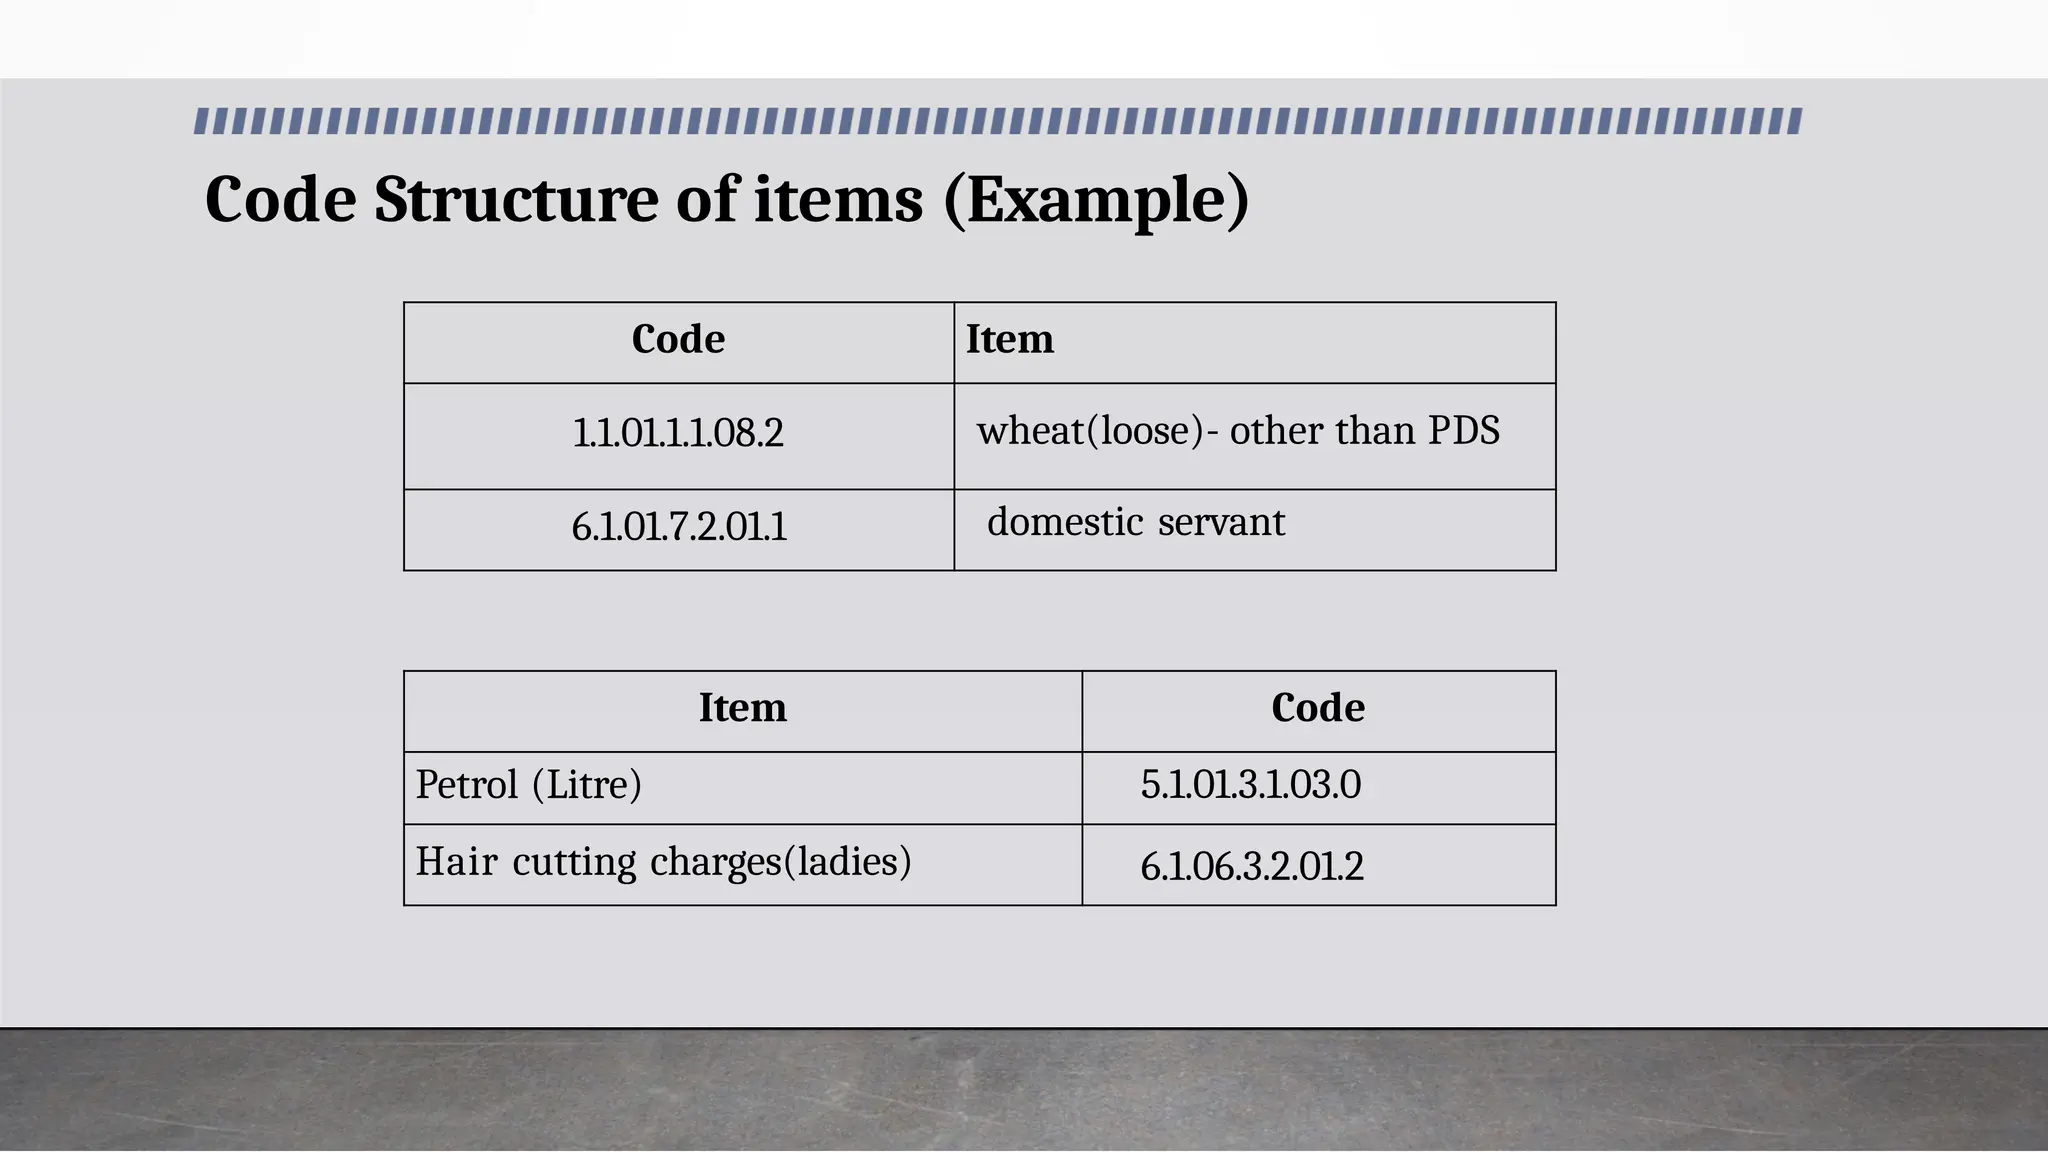
Code Structure ofitems (Example)
Code Item
1.1.01.1.1.08.2 wheat(loose)- other than PDS
6.1.01.7.2.01.1 domestic servant
Item Code
Petrol (Litre) 5.1.01.3.1.03.0
Hair cutting charges(ladies) 6.1.06.3.2.01.2
57.
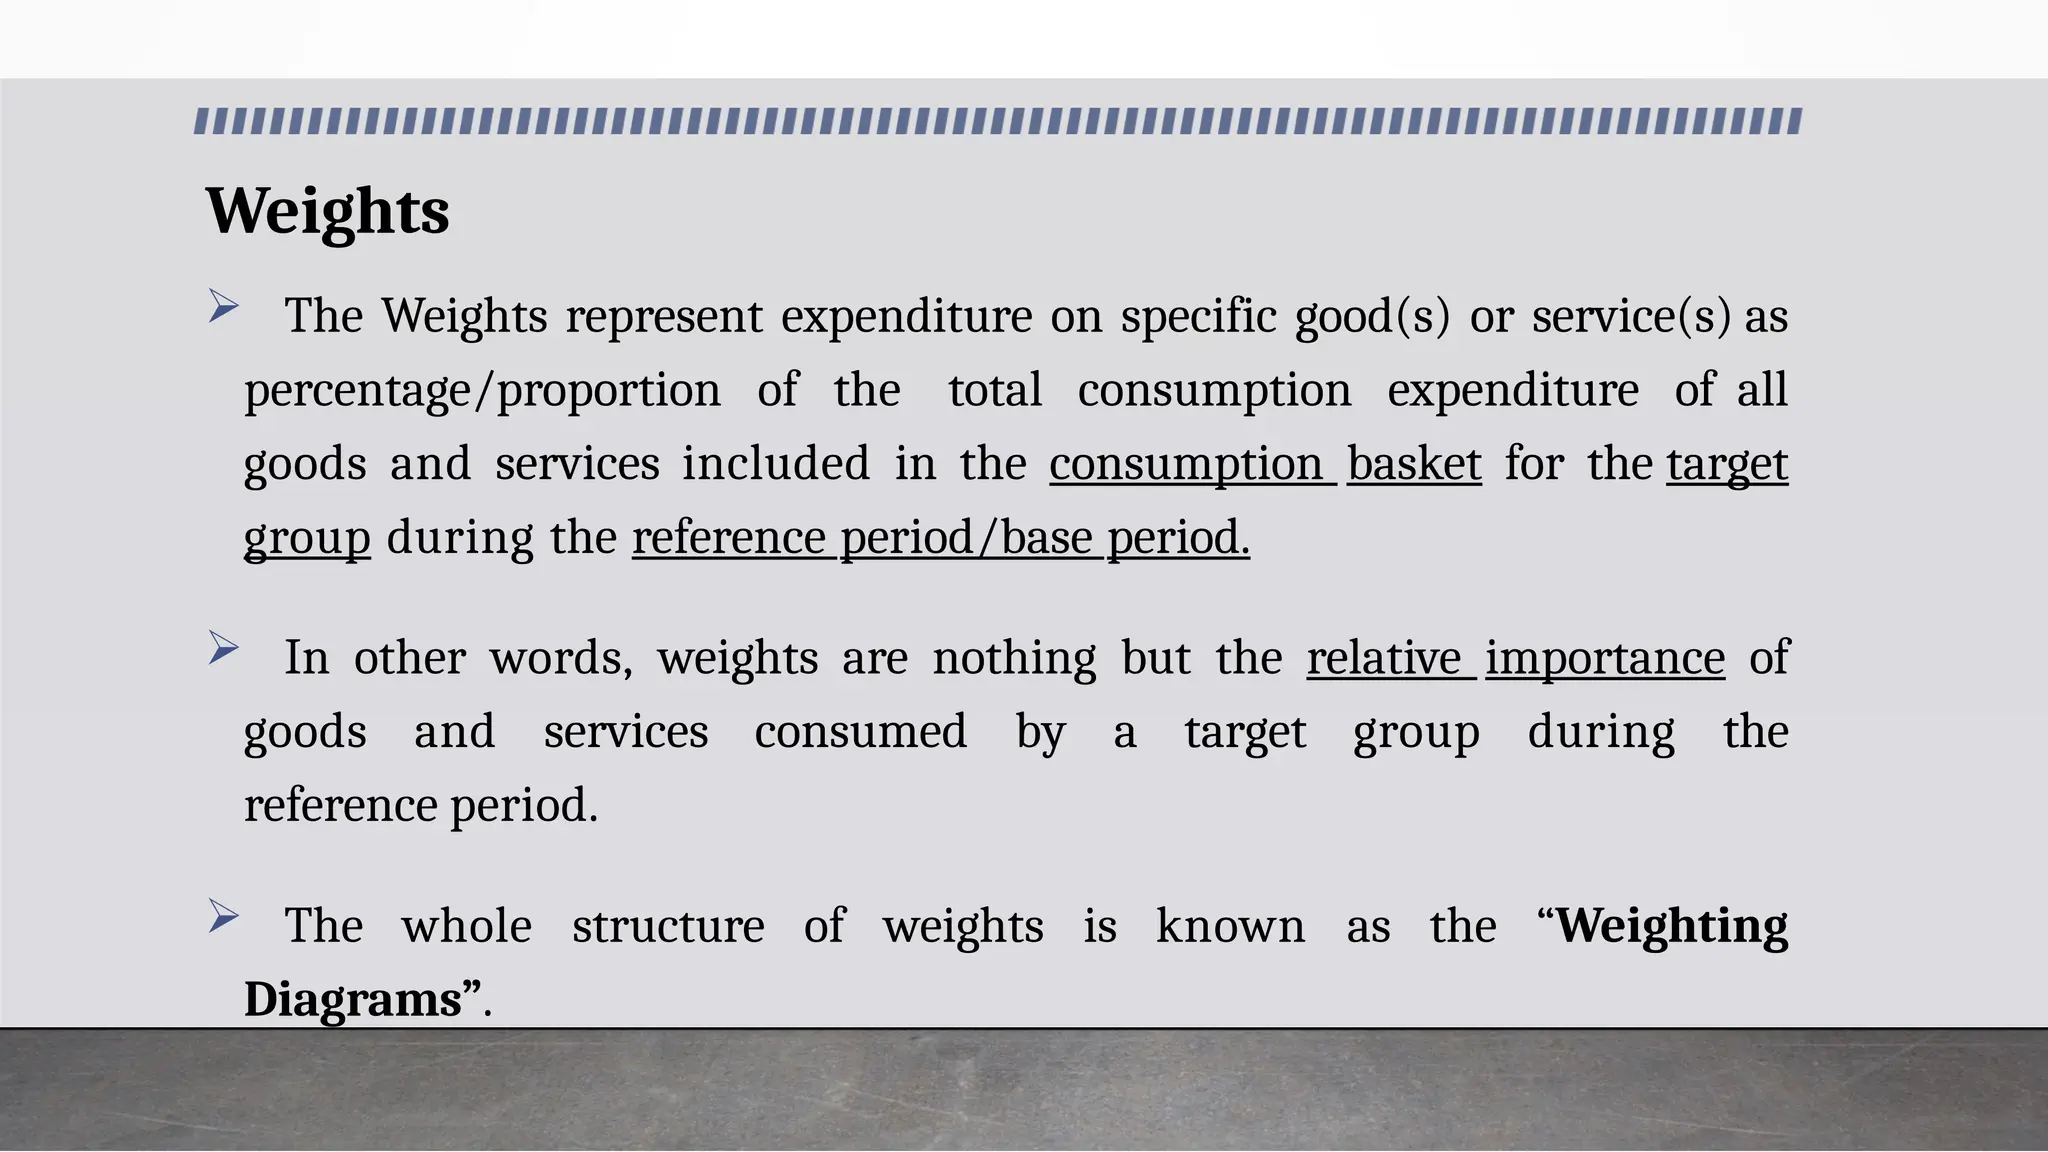
Weights
The Weightsrepresent expenditure on specific good(s) or service(s) as
percentage/proportion of the total consumption expenditure of all
goods and services included in the consumption basket for the target
group during the reference period/base period.
In other words, weights are nothing but the relative importance of
goods and services consumed by a target group during the
reference period.
The whole structure of weights is known as the “Weighting
Diagrams”.
58.
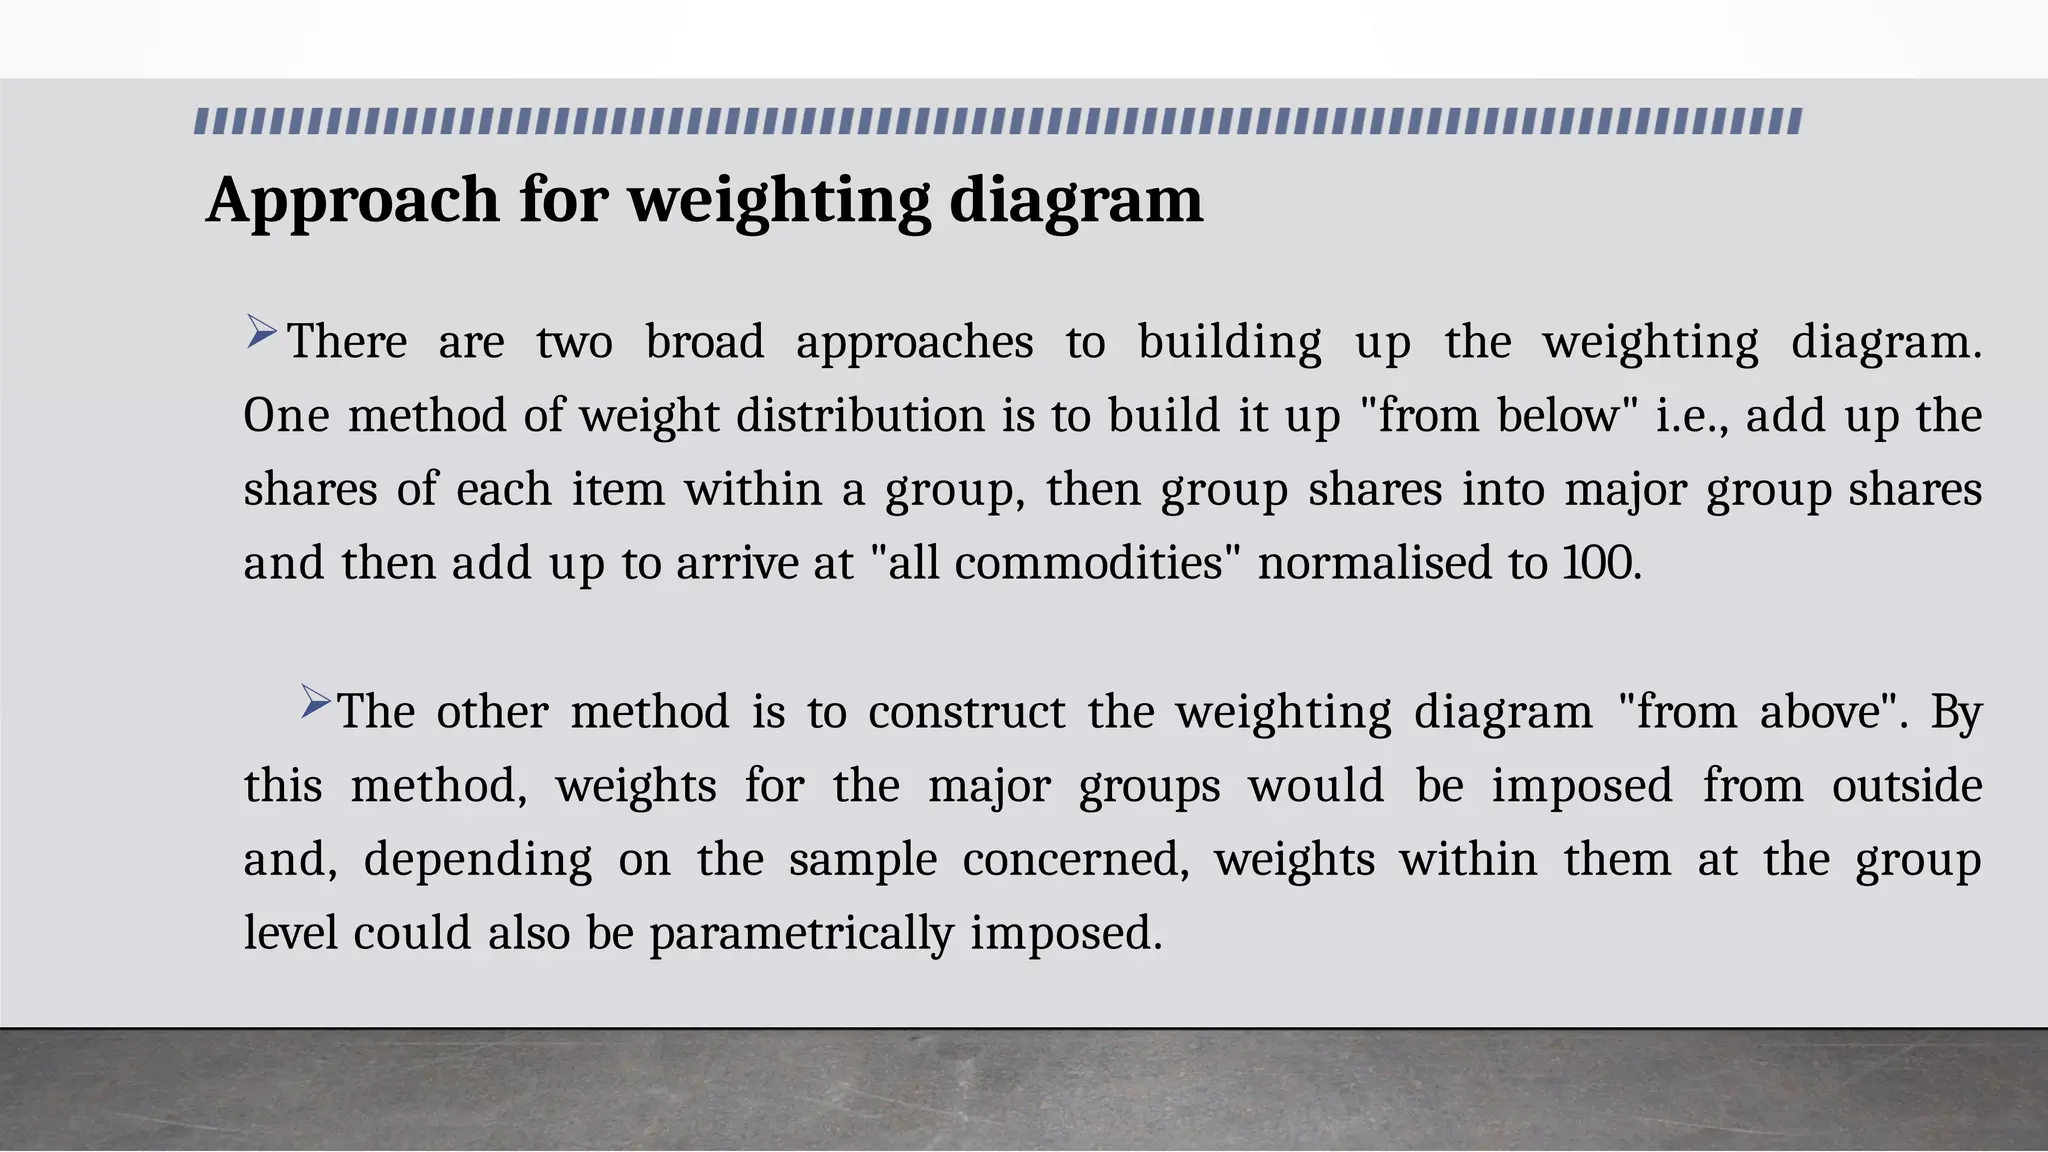
Approach for weightingdiagram
There are two broad approaches to building up the weighting diagram.
One method of weight distribution is to build it up "from below" i.e., add up the
shares of each item within a group, then group shares into major group shares
and then add up to arrive at "all commodities" normalised to 100.
The other method is to construct the weighting diagram "from above". By
this method, weights for the major groups would be imposed from outside
and, depending on the sample concerned, weights within them at the group
level could also be parametrically imposed.
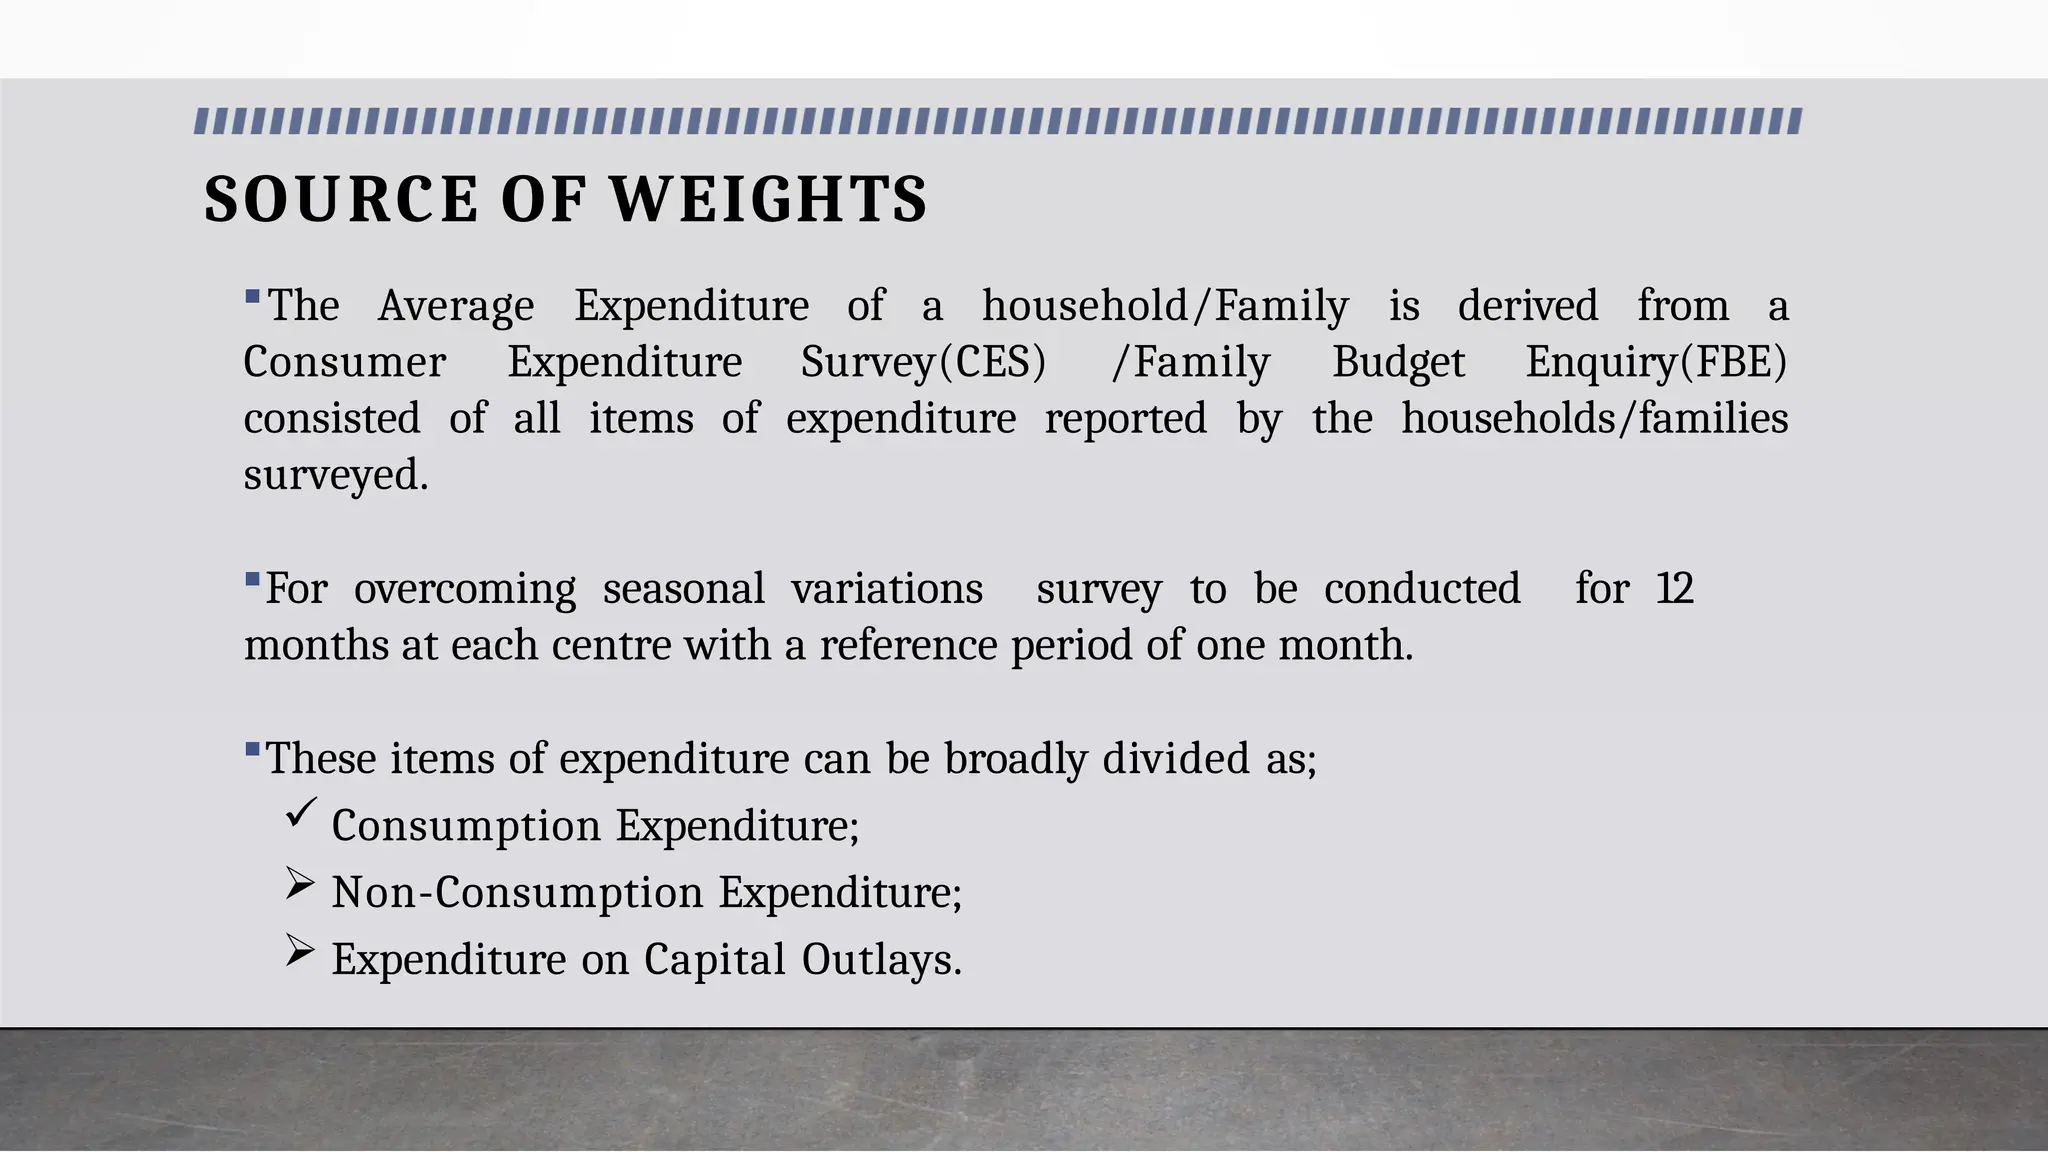
59.
SOURCE OF WEIGHTS
TheAverage Expenditure of a household/Family is derived from a
Consumer Expenditure Survey(CES) /Family Budget Enquiry(FBE)
consisted of all items of expenditure reported by the households/families
surveyed.
For overcoming seasonal variations survey to be conducted for 12
months at each centre with a reference period of one month.
These items of expenditure can be broadly divided as;
Consumption Expenditure;
Non-Consumption Expenditure;
Expenditure on Capital Outlays.
60.
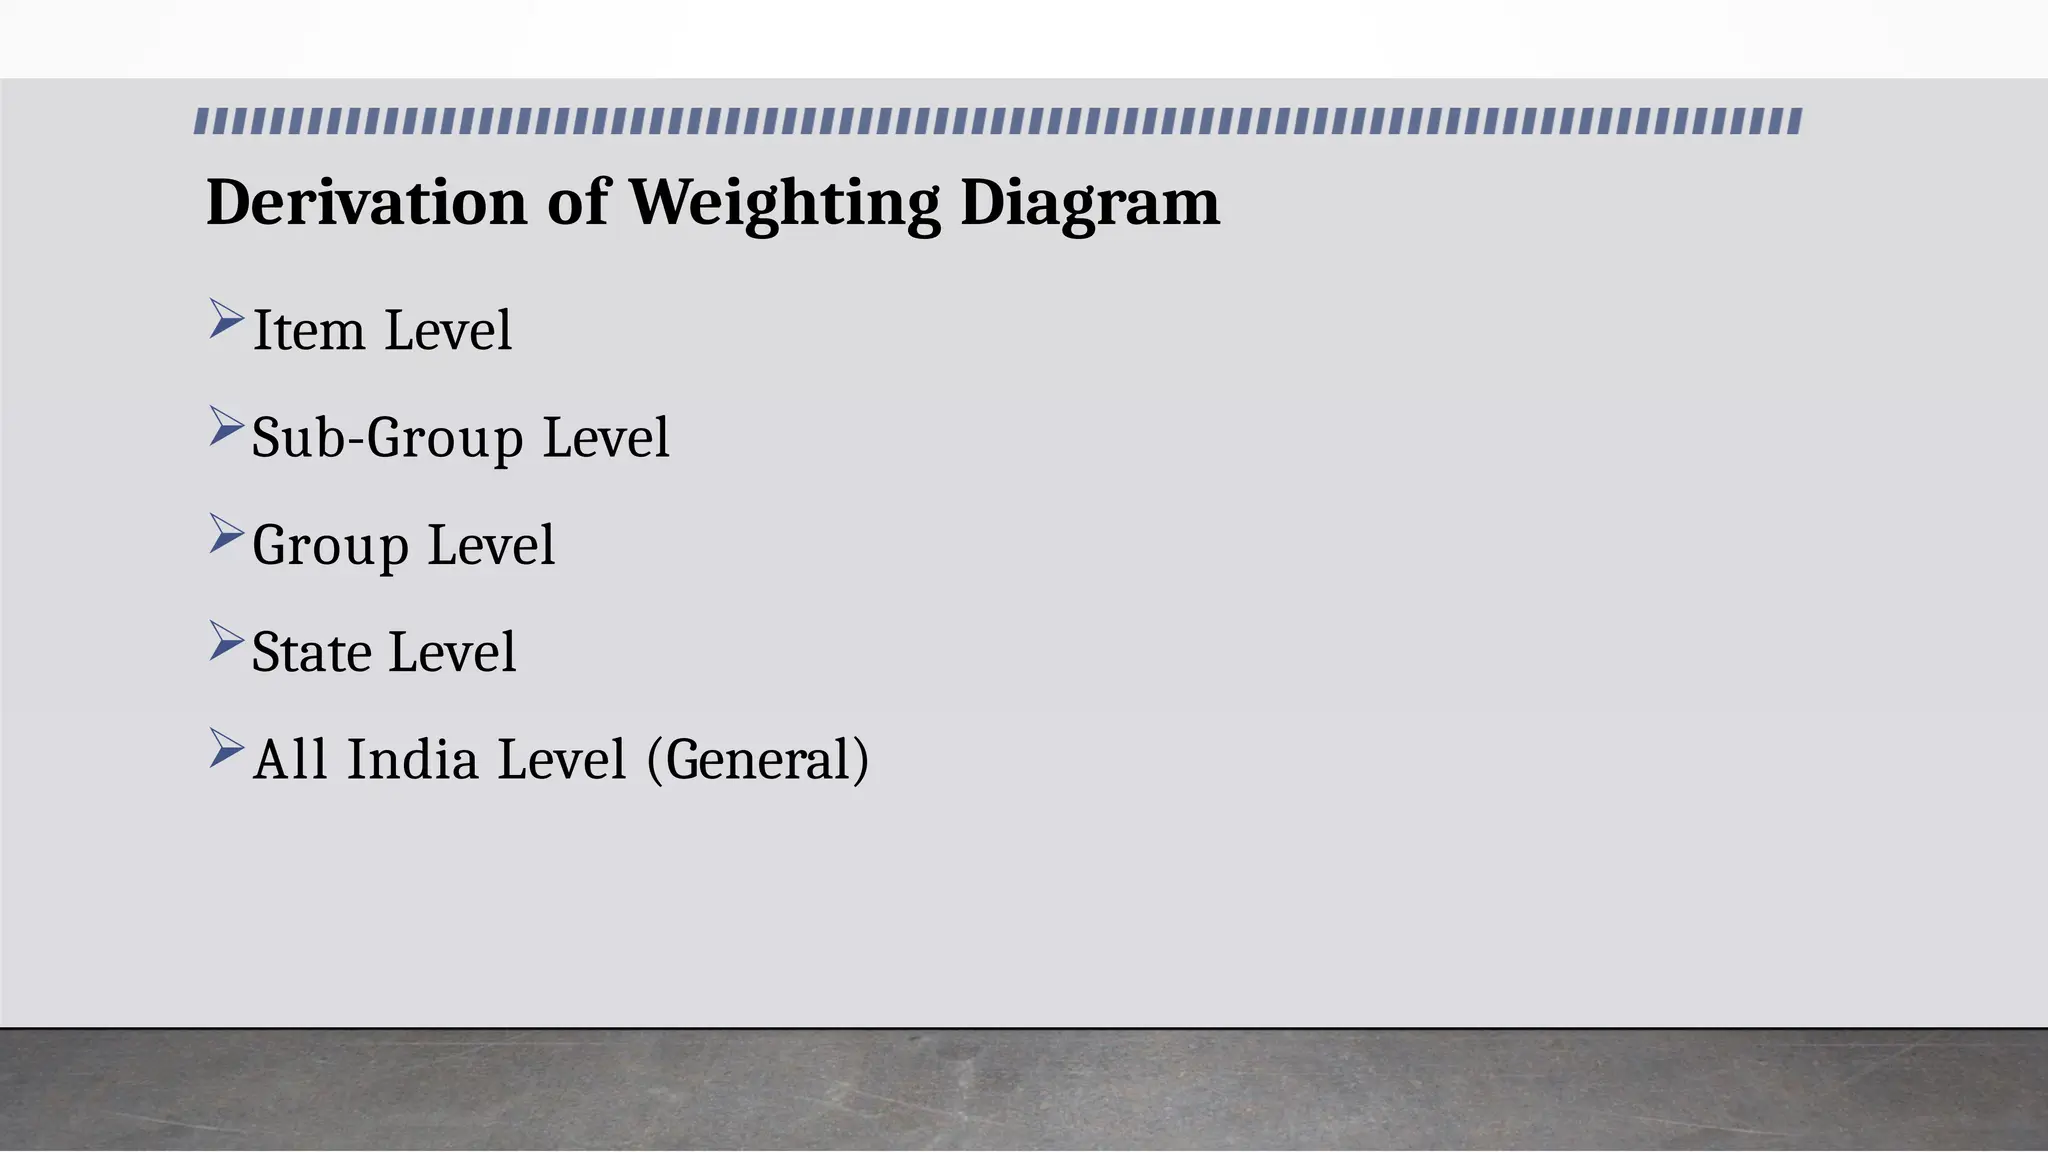
Derivation of WeightingDiagram
Item Level
Sub-Group Level
Group Level
State Level
All India Level (General)
61.
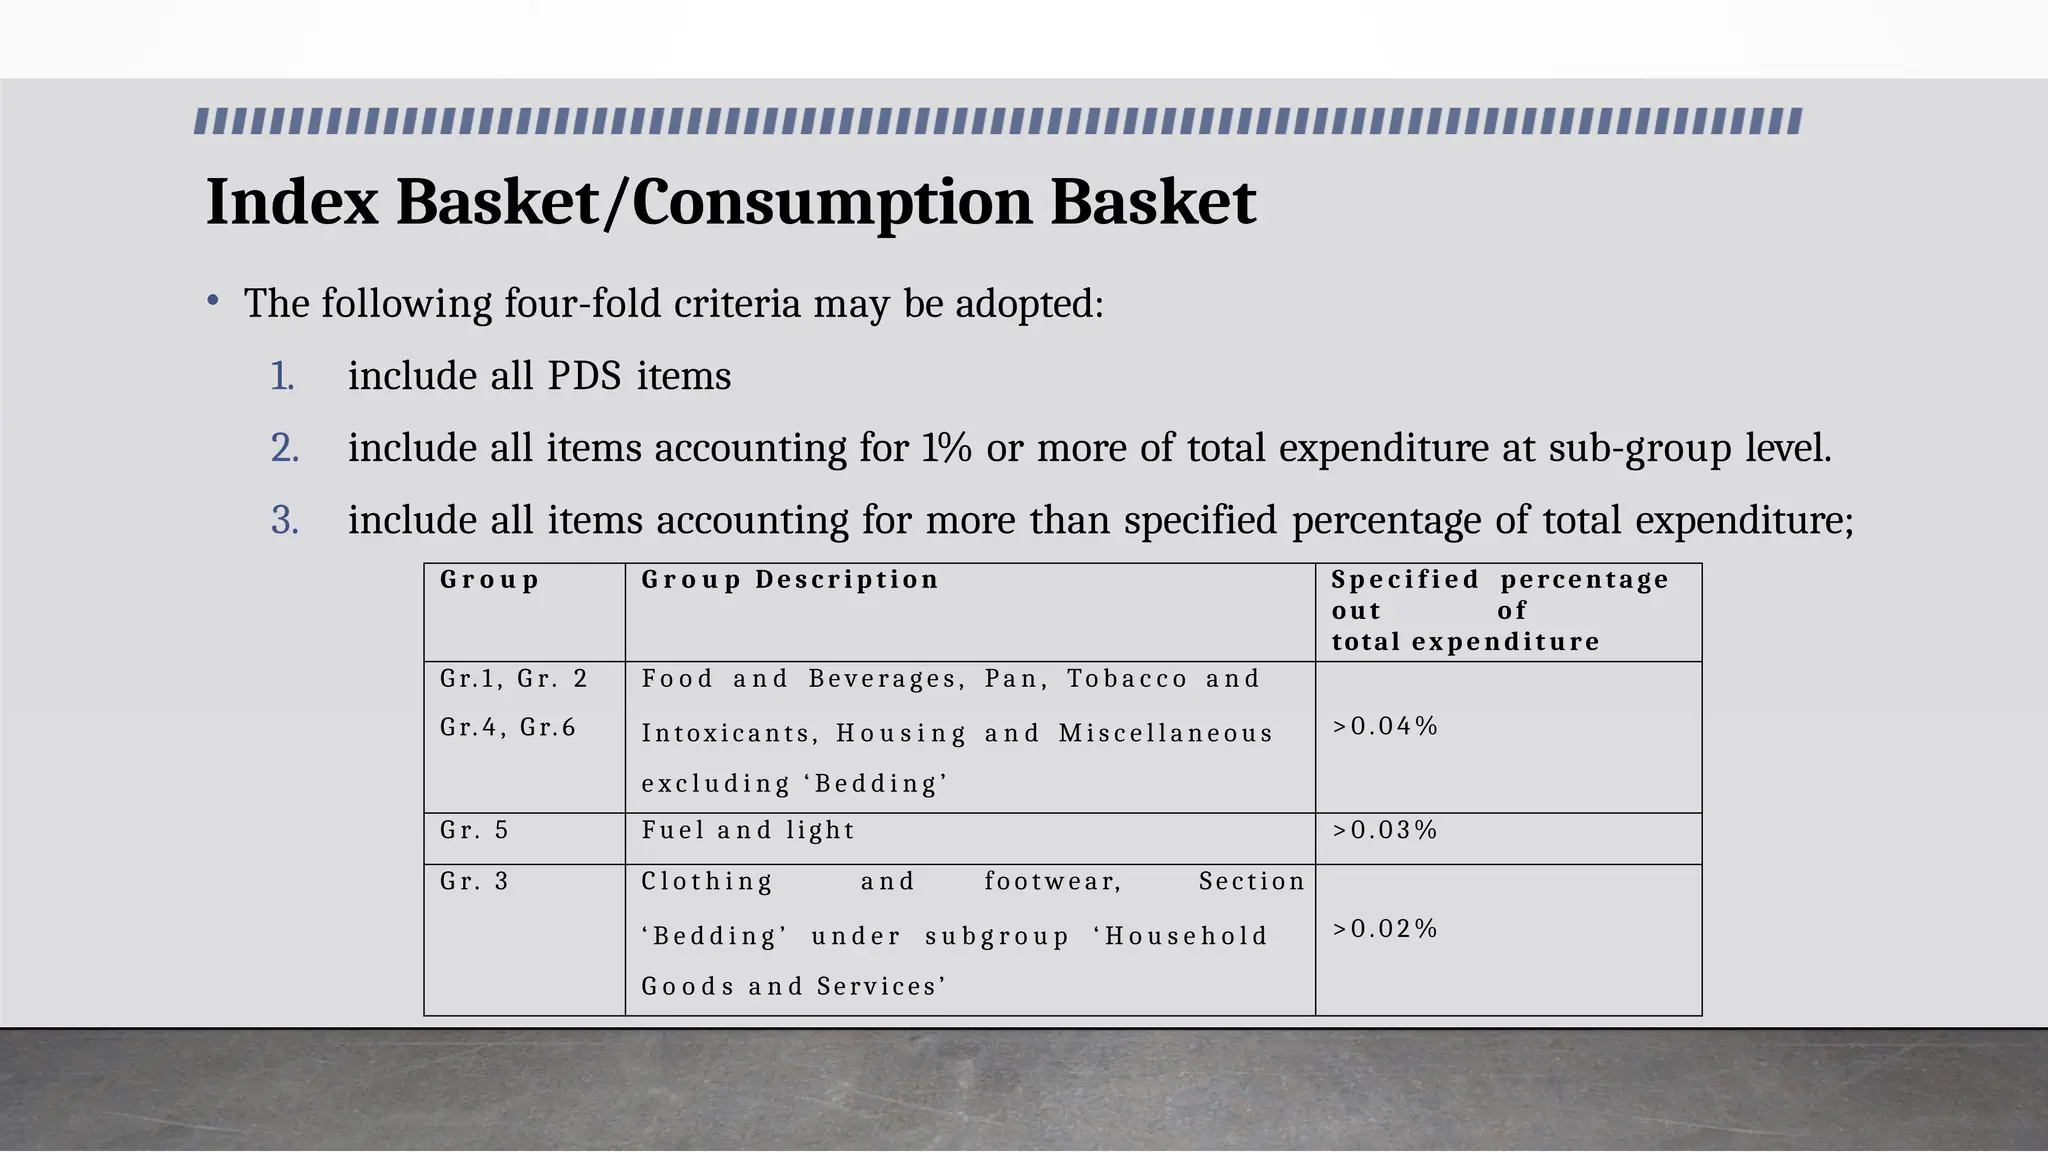
Index Basket/Consumption Basket
•The following four-fold criteria may be adopted:
1. include all PDS items
2. include all items accounting for 1% or more of total expenditure at sub-group level.
3. include all items accounting for more than specified percentage of total expenditure;
G r o u p G r o u p D e s c r i p t i o n S p e c i f i e d percentage
out o f
total ex p endit ure
G r. 1 , G r. 2
G r. 4 , G r. 6
F o o d a n d B e v e r a g e s , P a n , To b a c c o a n d
I n t ox i c a n t s , H o u s i n g a n d M i s c e l l a n e o u s
e x c l u d i n g ‘ B e d d i n g ’
> 0 . 0 4 %
G r. 5 F u e l a n d l i gh t > 0 . 0 3 %
G r. 3 C l o t h i n g a n d fo o t w e a r, S e c t i o n
‘ B e d d i n g ’ u n d e r s u b g r o u p ‘ H o u s e h o l d
G o o d s a n d S e rv i c e s ’
> 0 . 0 2 %
62.
Index Basket/Consumption Basket
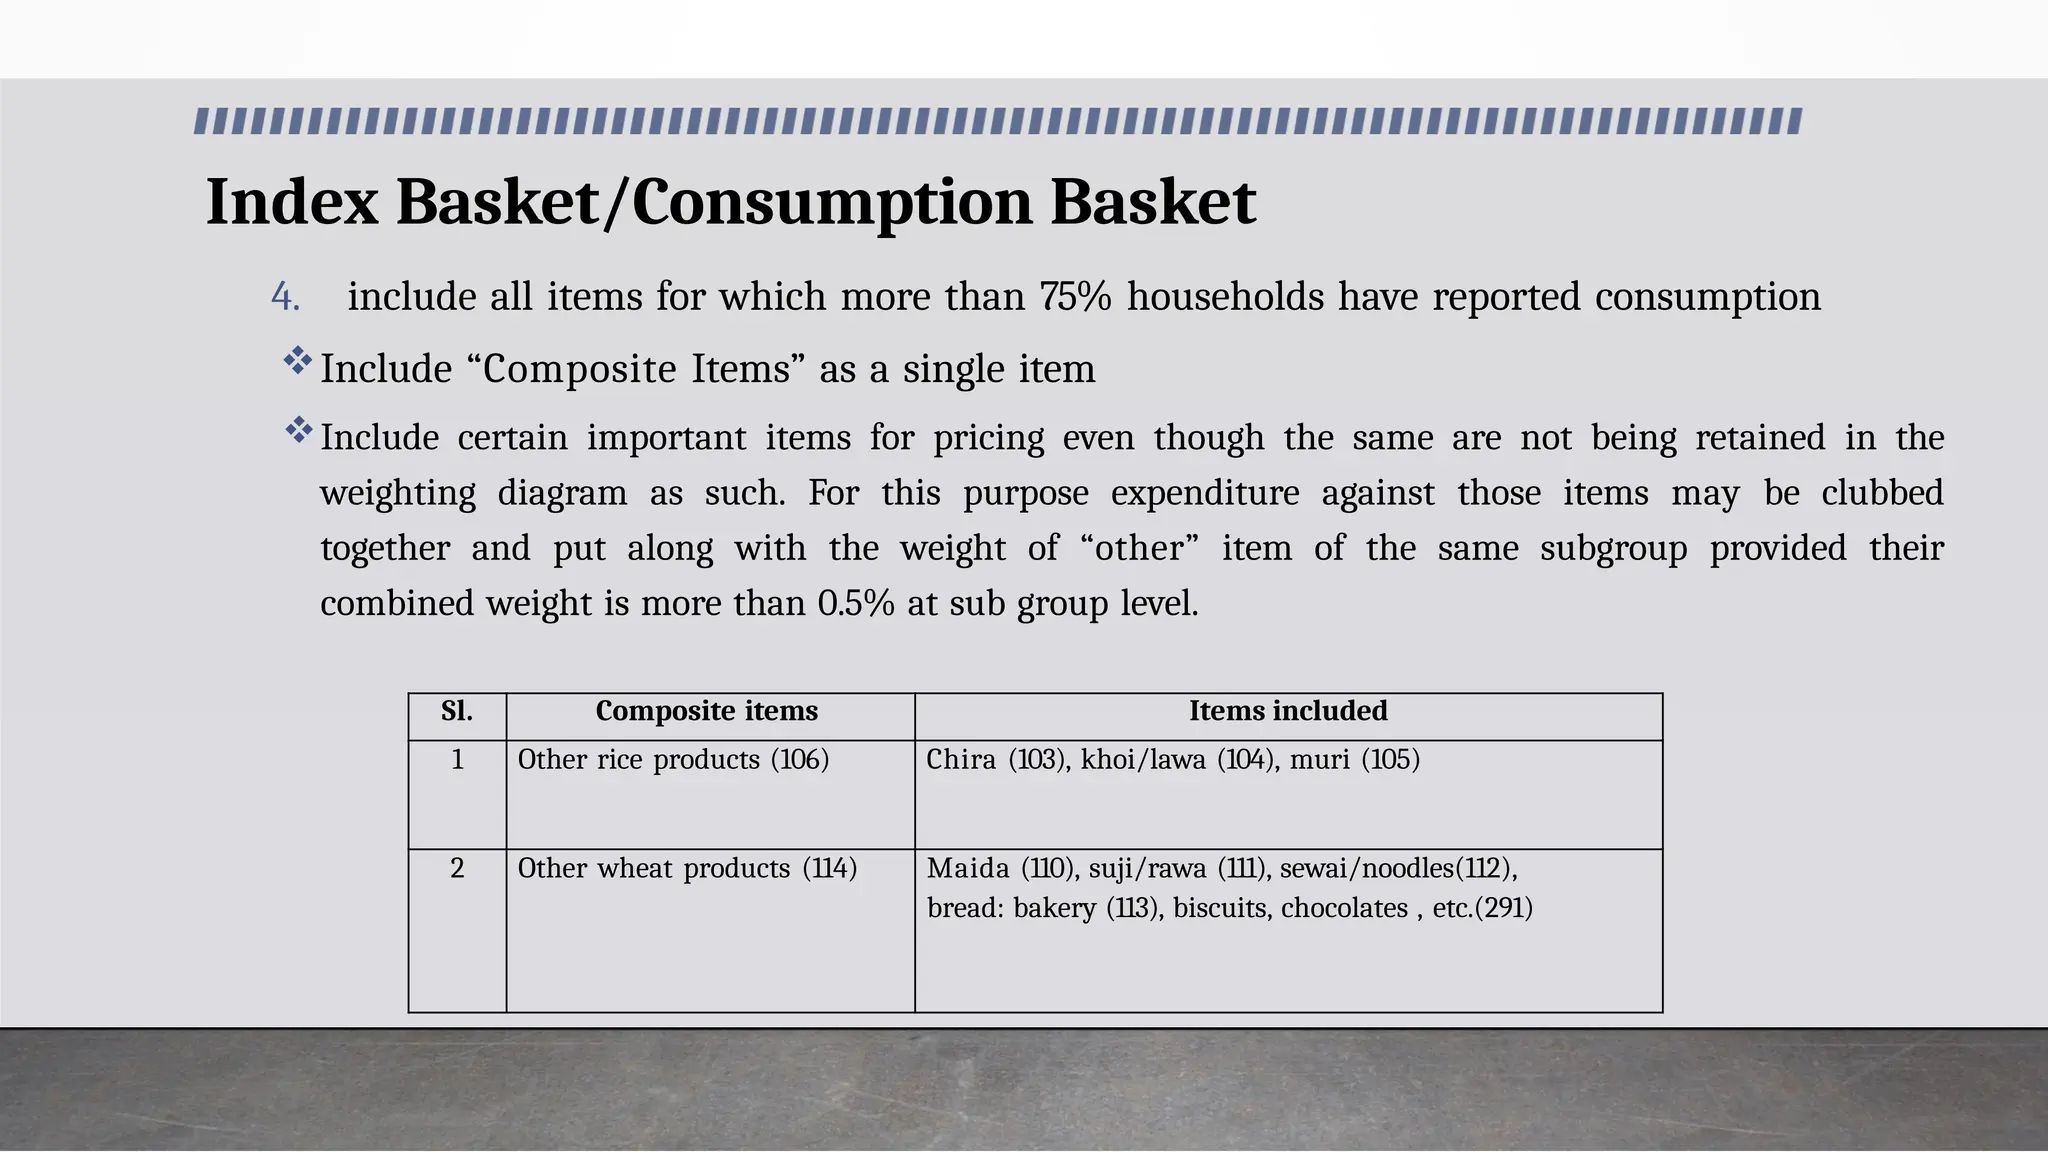
4.include all items for which more than 75% households have reported consumption
Include “Composite Items” as a single item
Include certain important items for pricing even though the same are not being retained in the
weighting diagram as such. For this purpose expenditure against those items may be clubbed
together and put along with the weight of “other” item of the same subgroup provided their
combined weight is more than 0.5% at sub group level.
Sl. Composite items Items included
1 Other rice products (106) Chira (103), khoi/lawa (104), muri (105)
2 Other wheat products (114) Maida (110), suji/rawa (111), sewai/noodles(112),
bread: bakery (113), biscuits, chocolates , etc.(291)
63.
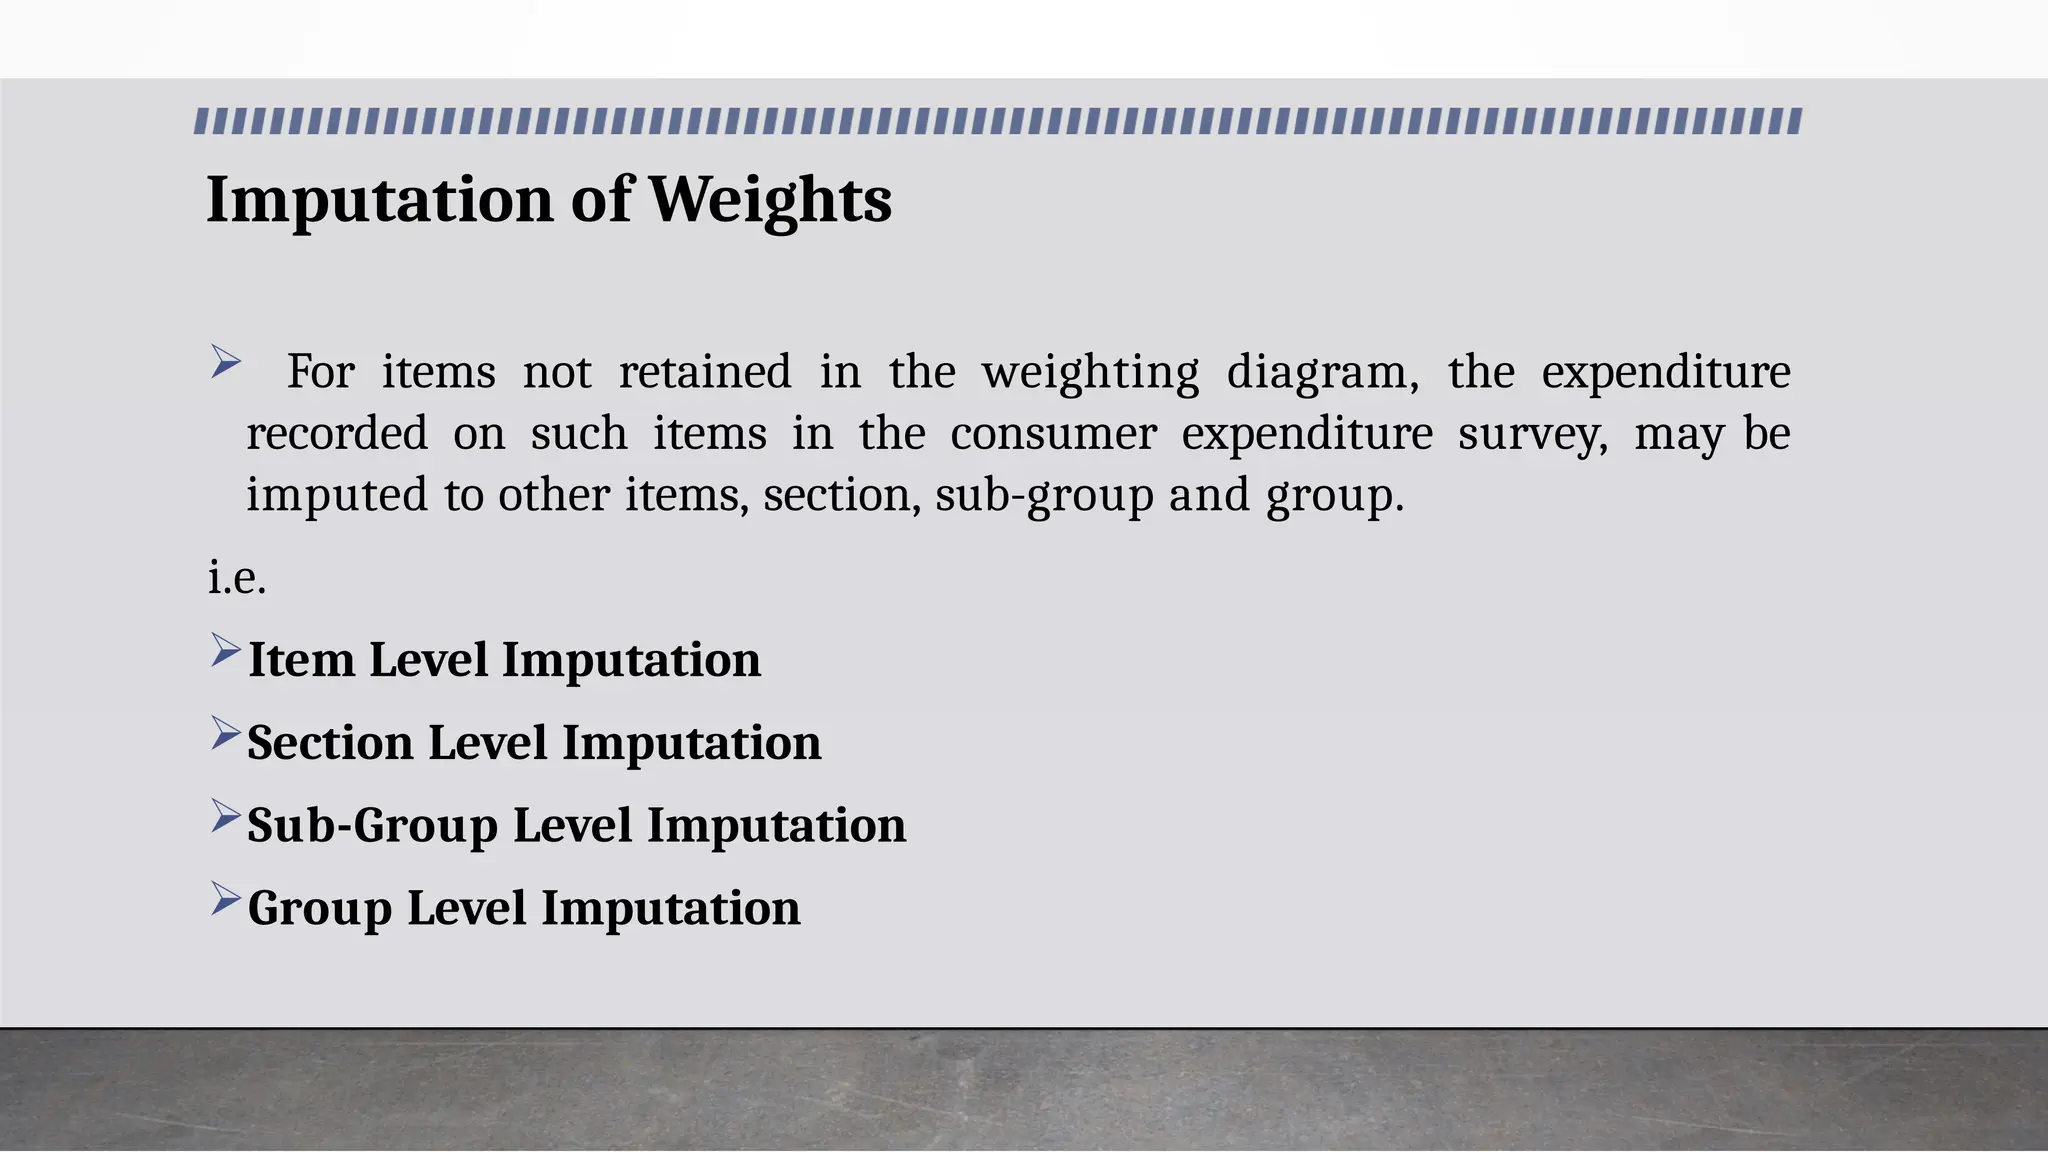
Imputation of Weights
For items not retained in the weighting diagram, the expenditure
recorded on such items in the consumer expenditure survey, may be
imputed to other items, section, sub-group and group.
i.e.
Item Level Imputation
Section Level Imputation
Sub-Group Level Imputation
Group Level Imputation
64.
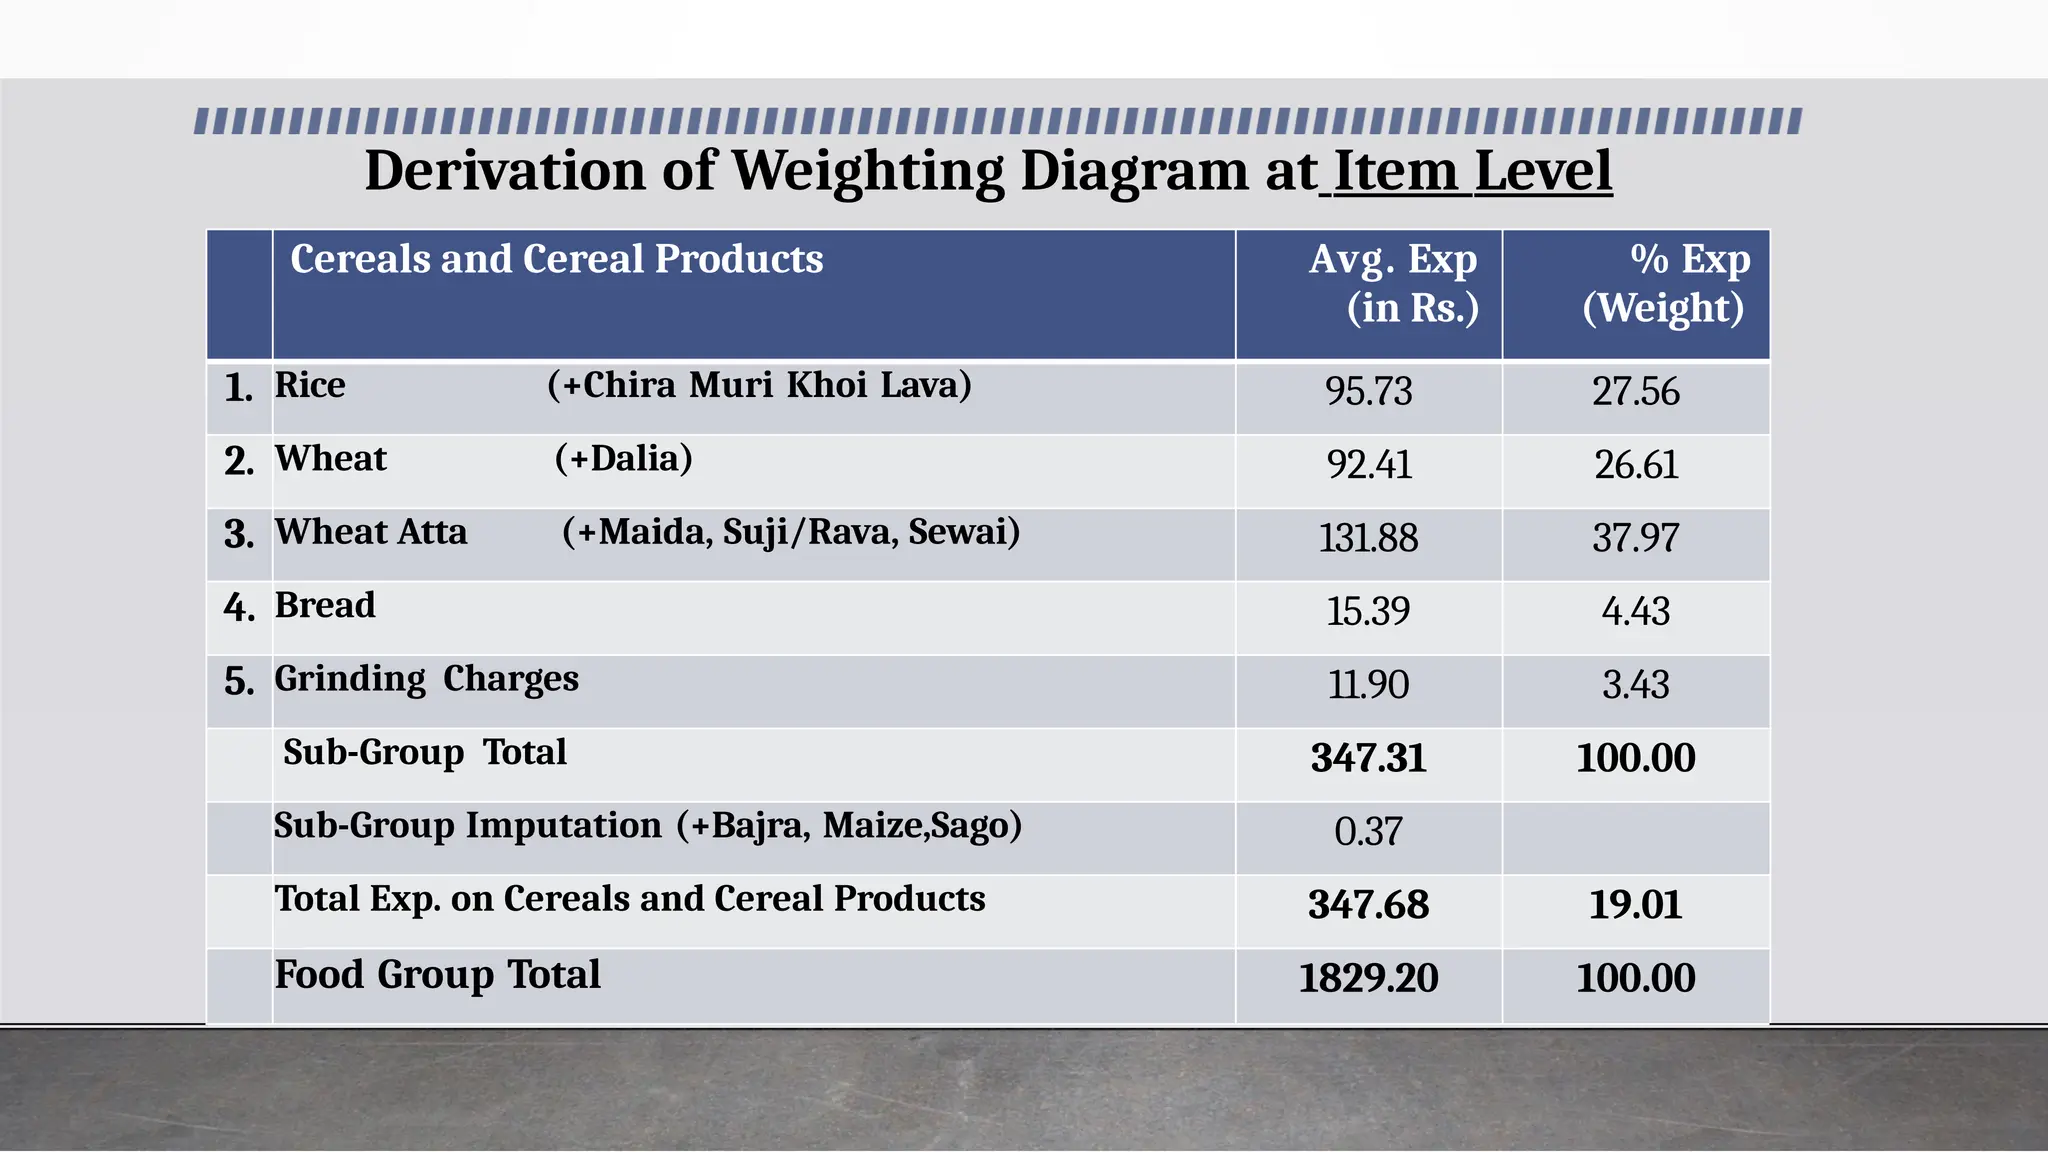
Derivation of WeightingDiagram at Item Level
Cereals and Cereal Products Avg. Exp
(in Rs.)
% Exp
(Weight)
1. Rice (+Chira Muri Khoi Lava) 95.73 27.56
2. Wheat (+Dalia) 92.41 26.61
3. Wheat Atta (+Maida, Suji/Rava, Sewai) 131.88 37.97
4. Bread 15.39 4.43
5. Grinding Charges 11.90 3.43
Sub-Group Total 347.31 100.00
Sub-Group Imputation (+Bajra, Maize,Sago) 0.37
Total Exp. on Cereals and Cereal Products 347.68 19.01
Food Group Total 1829.20 100.00
65.
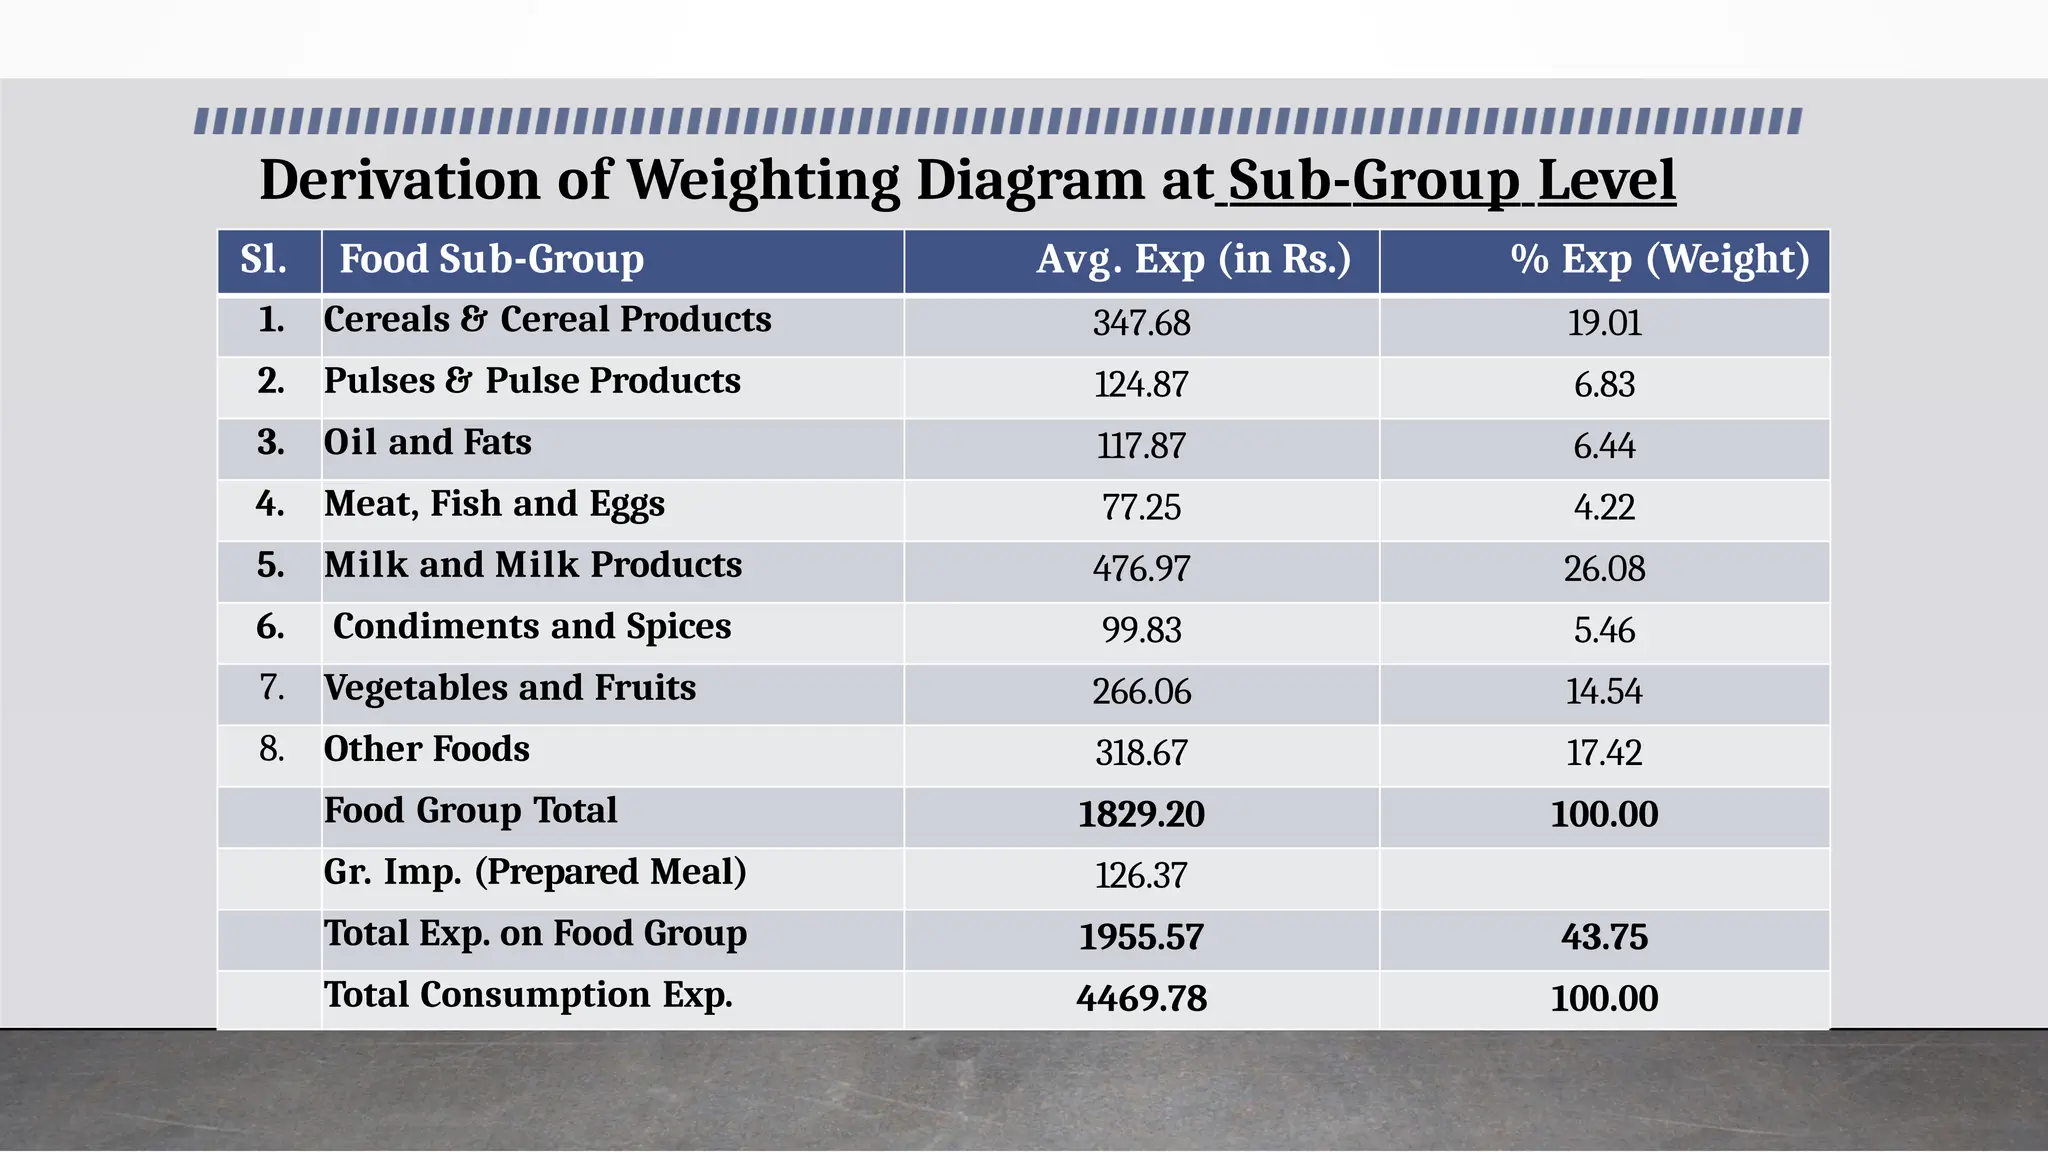
Derivation of WeightingDiagram at Sub-Group Level
Sl. Food Sub-Group Avg. Exp (in Rs.) % Exp (Weight)
1. Cereals & Cereal Products 347.68 19.01
2. Pulses & Pulse Products 124.87 6.83
3. Oil and Fats 117.87 6.44
4. Meat, Fish and Eggs 77.25 4.22
5. Milk and Milk Products 476.97 26.08
6. Condiments and Spices 99.83 5.46
7. Vegetables and Fruits 266.06 14.54
8. Other Foods 318.67 17.42
Food Group Total 1829.20 100.00
Gr. Imp. (Prepared Meal) 126.37
Total Exp. on Food Group 1955.57 43.75
Total Consumption Exp. 4469.78 100.00
66.
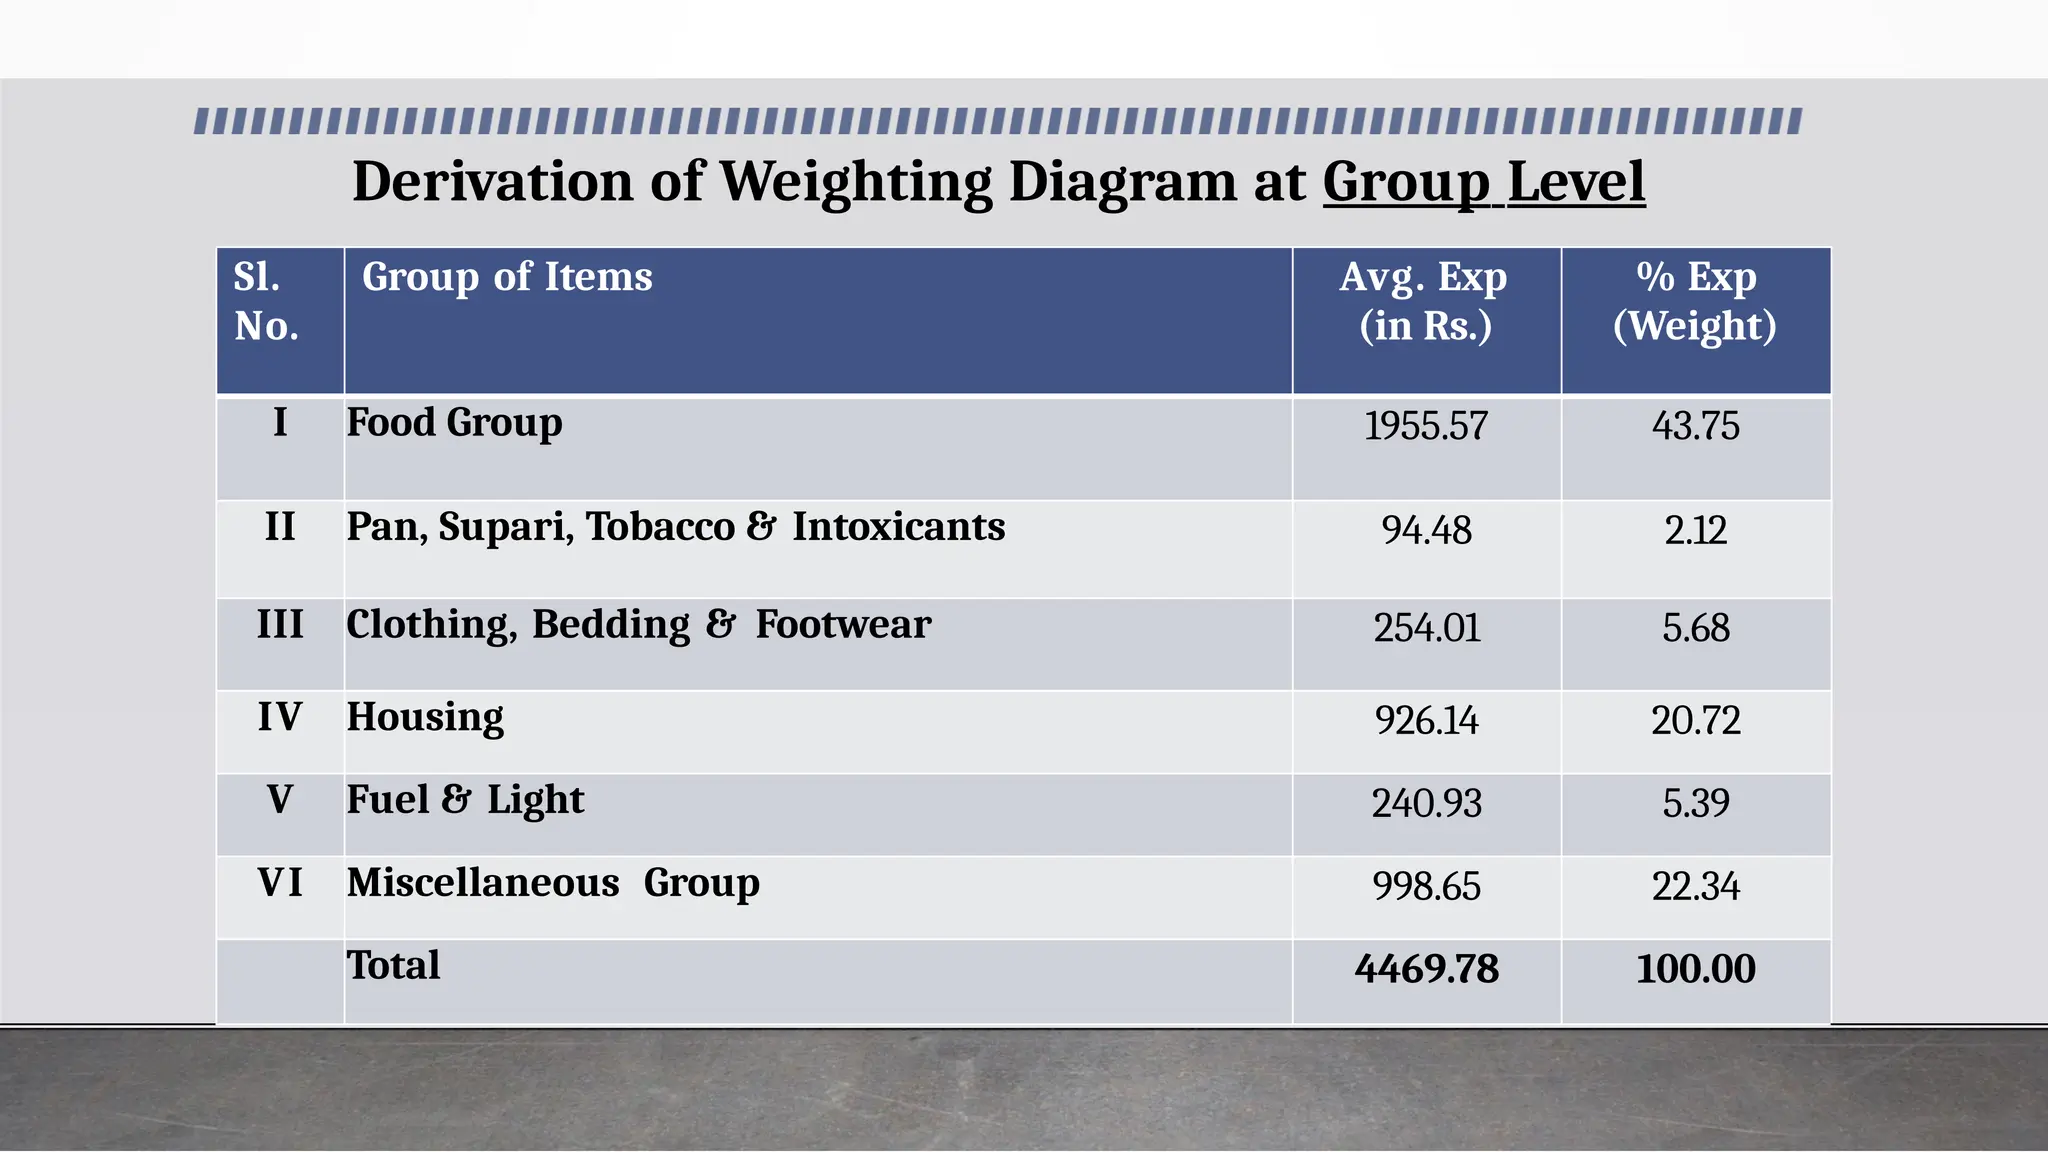
Derivation of WeightingDiagram at Group Level
Sl.
No.
Group of Items Avg. Exp
(in Rs.)
% Exp
(Weight)
I Food Group 1955.57 43.75
II Pan, Supari, Tobacco & Intoxicants 94.48 2.12
III Clothing, Bedding & Footwear 254.01 5.68
IV Housing 926.14 20.72
V Fuel & Light 240.93 5.39
VI Miscellaneous Group 998.65 22.34
Total 4469.78 100.00
67.
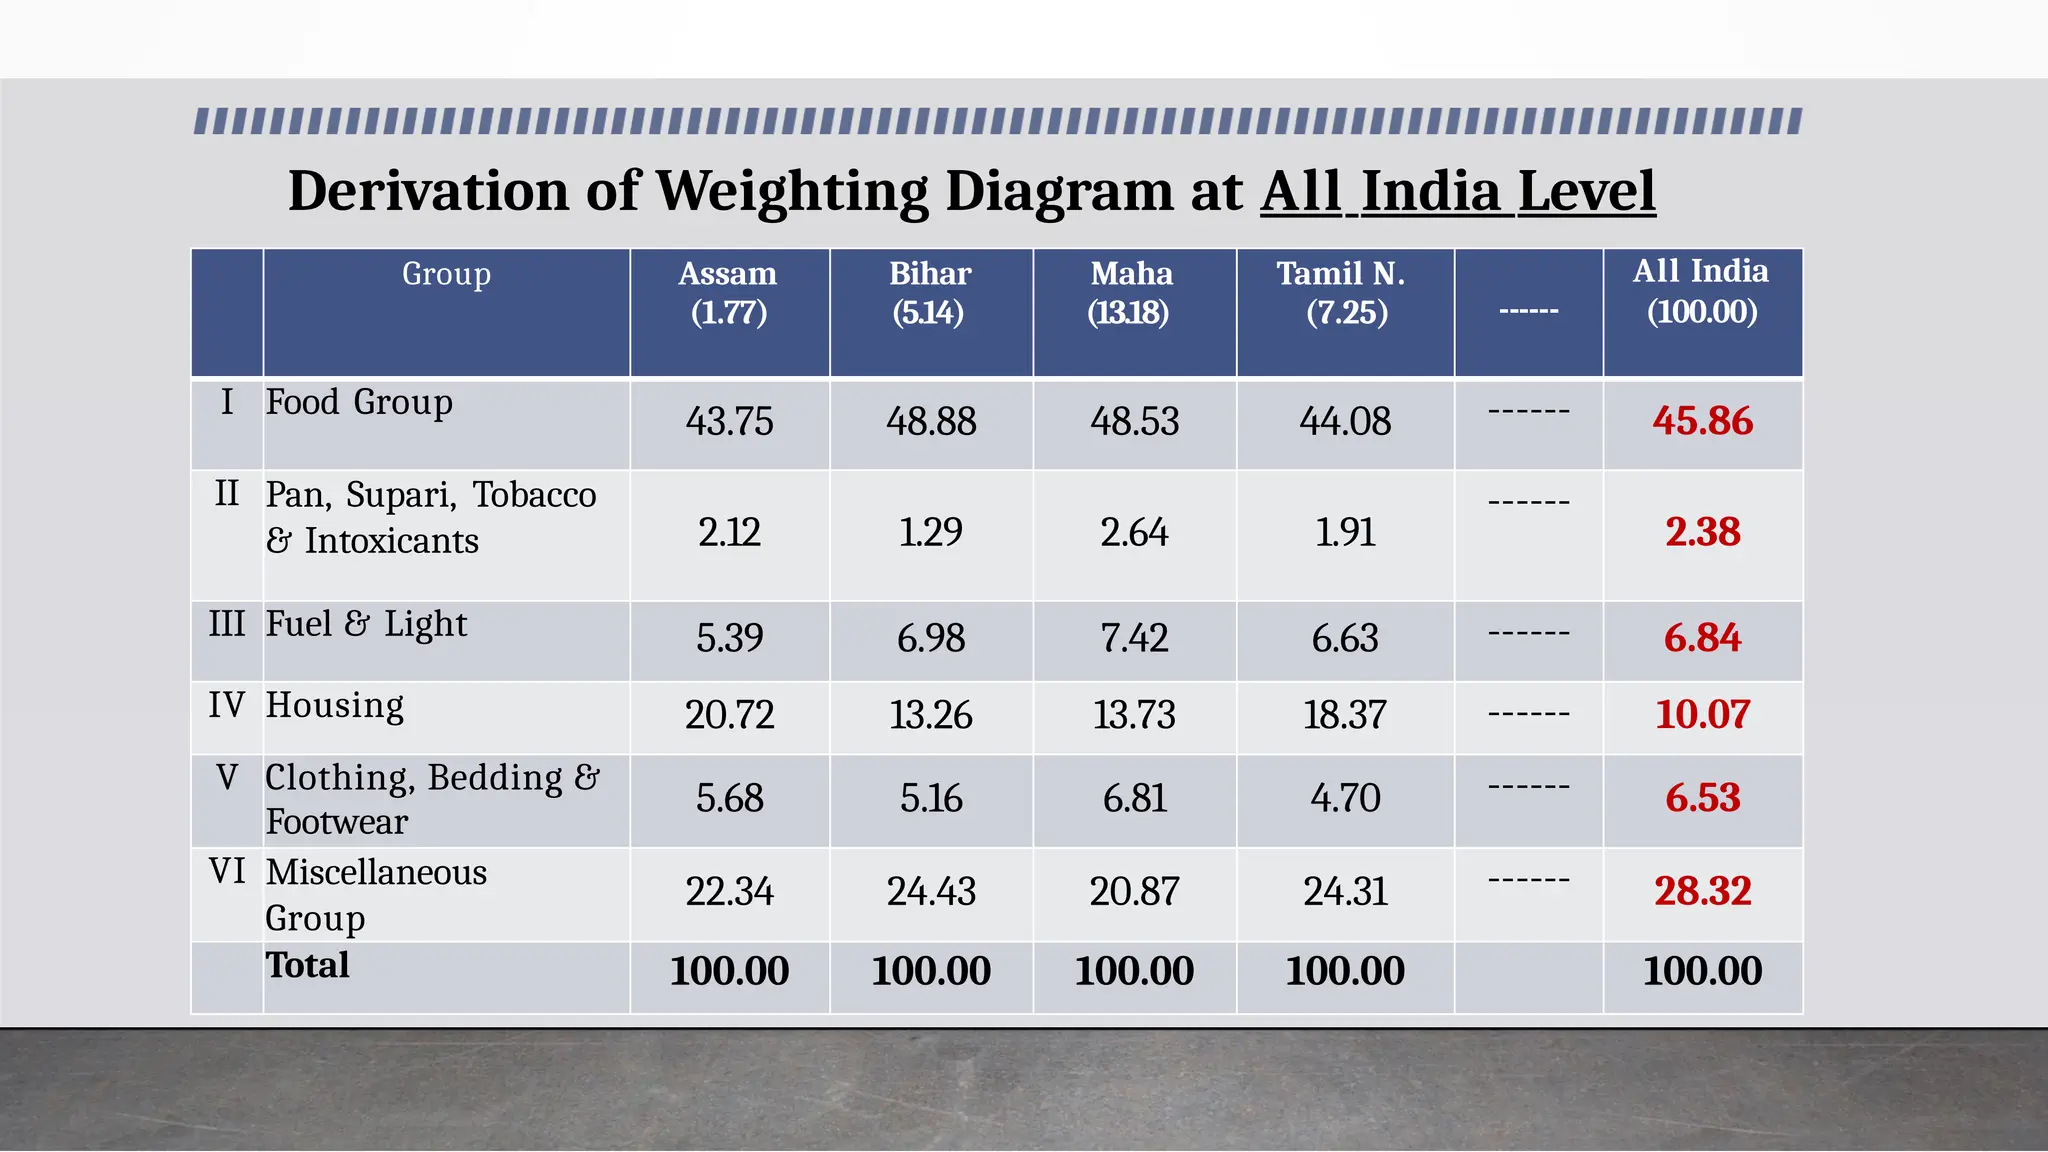
Derivation of WeightingDiagram at All India Level
Group Assam
(1.77)
Bihar
(5.14)
Maha
(13.18)
Tamil N.
(7.25) ------
All India
(100.00)
I Food Group
43.75 48.88 48.53 44.08 ------ 45.86
II Pan, Supari, Tobacco
& Intoxicants 2.12 1.29 2.64 1.91
------
2.38
III Fuel & Light 5.39 6.98 7.42 6.63 ------ 6.84
IV Housing 20.72 13.26 13.73 18.37 ------ 10.07
V Clothing, Bedding &
Footwear
5.68 5.16 6.81 4.70 ------ 6.53
VI Miscellaneous
Group
22.34 24.43 20.87 24.31 ------ 28.32
Total 100.00 100.00 100.00 100.00 100.00
68.
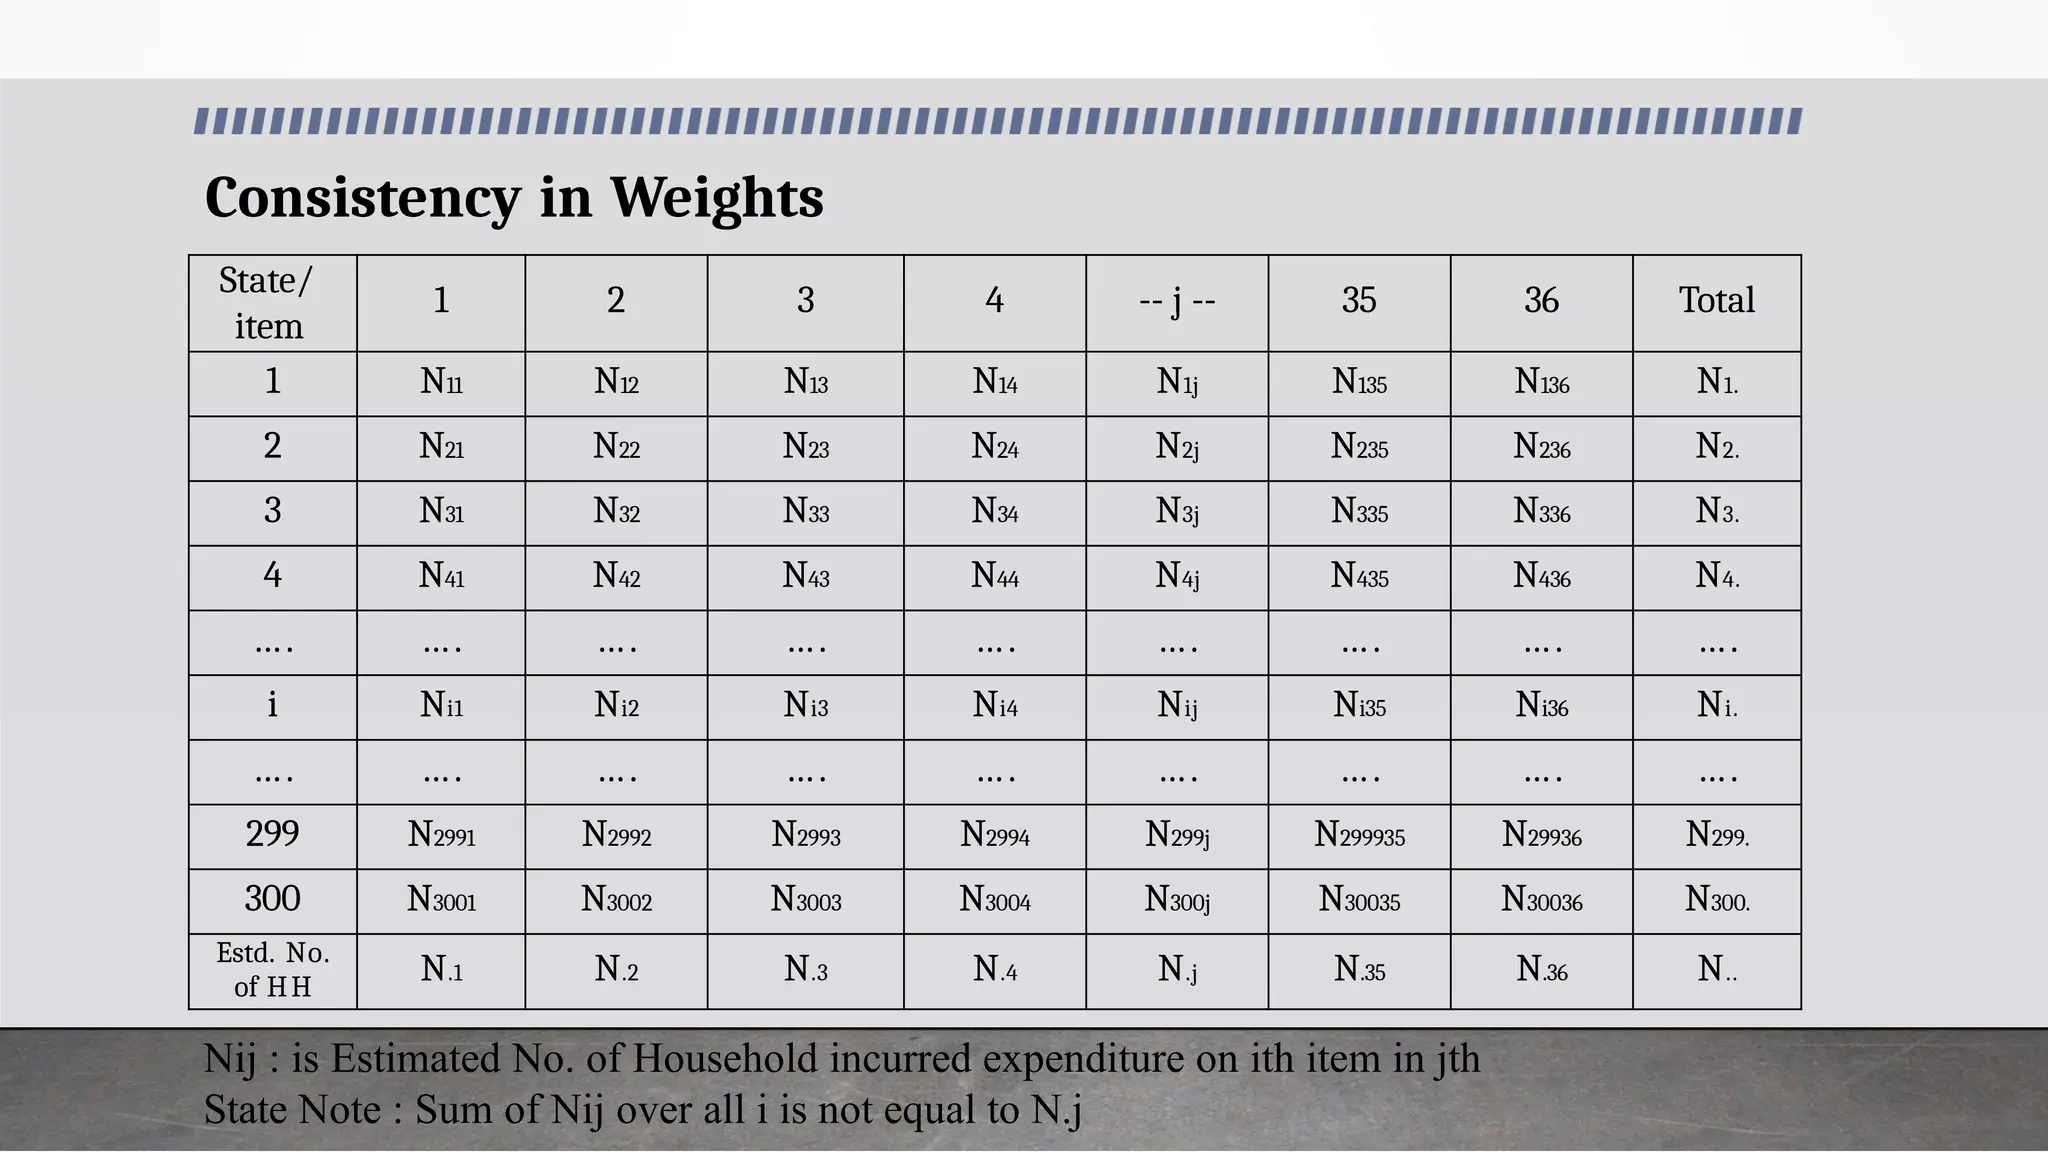
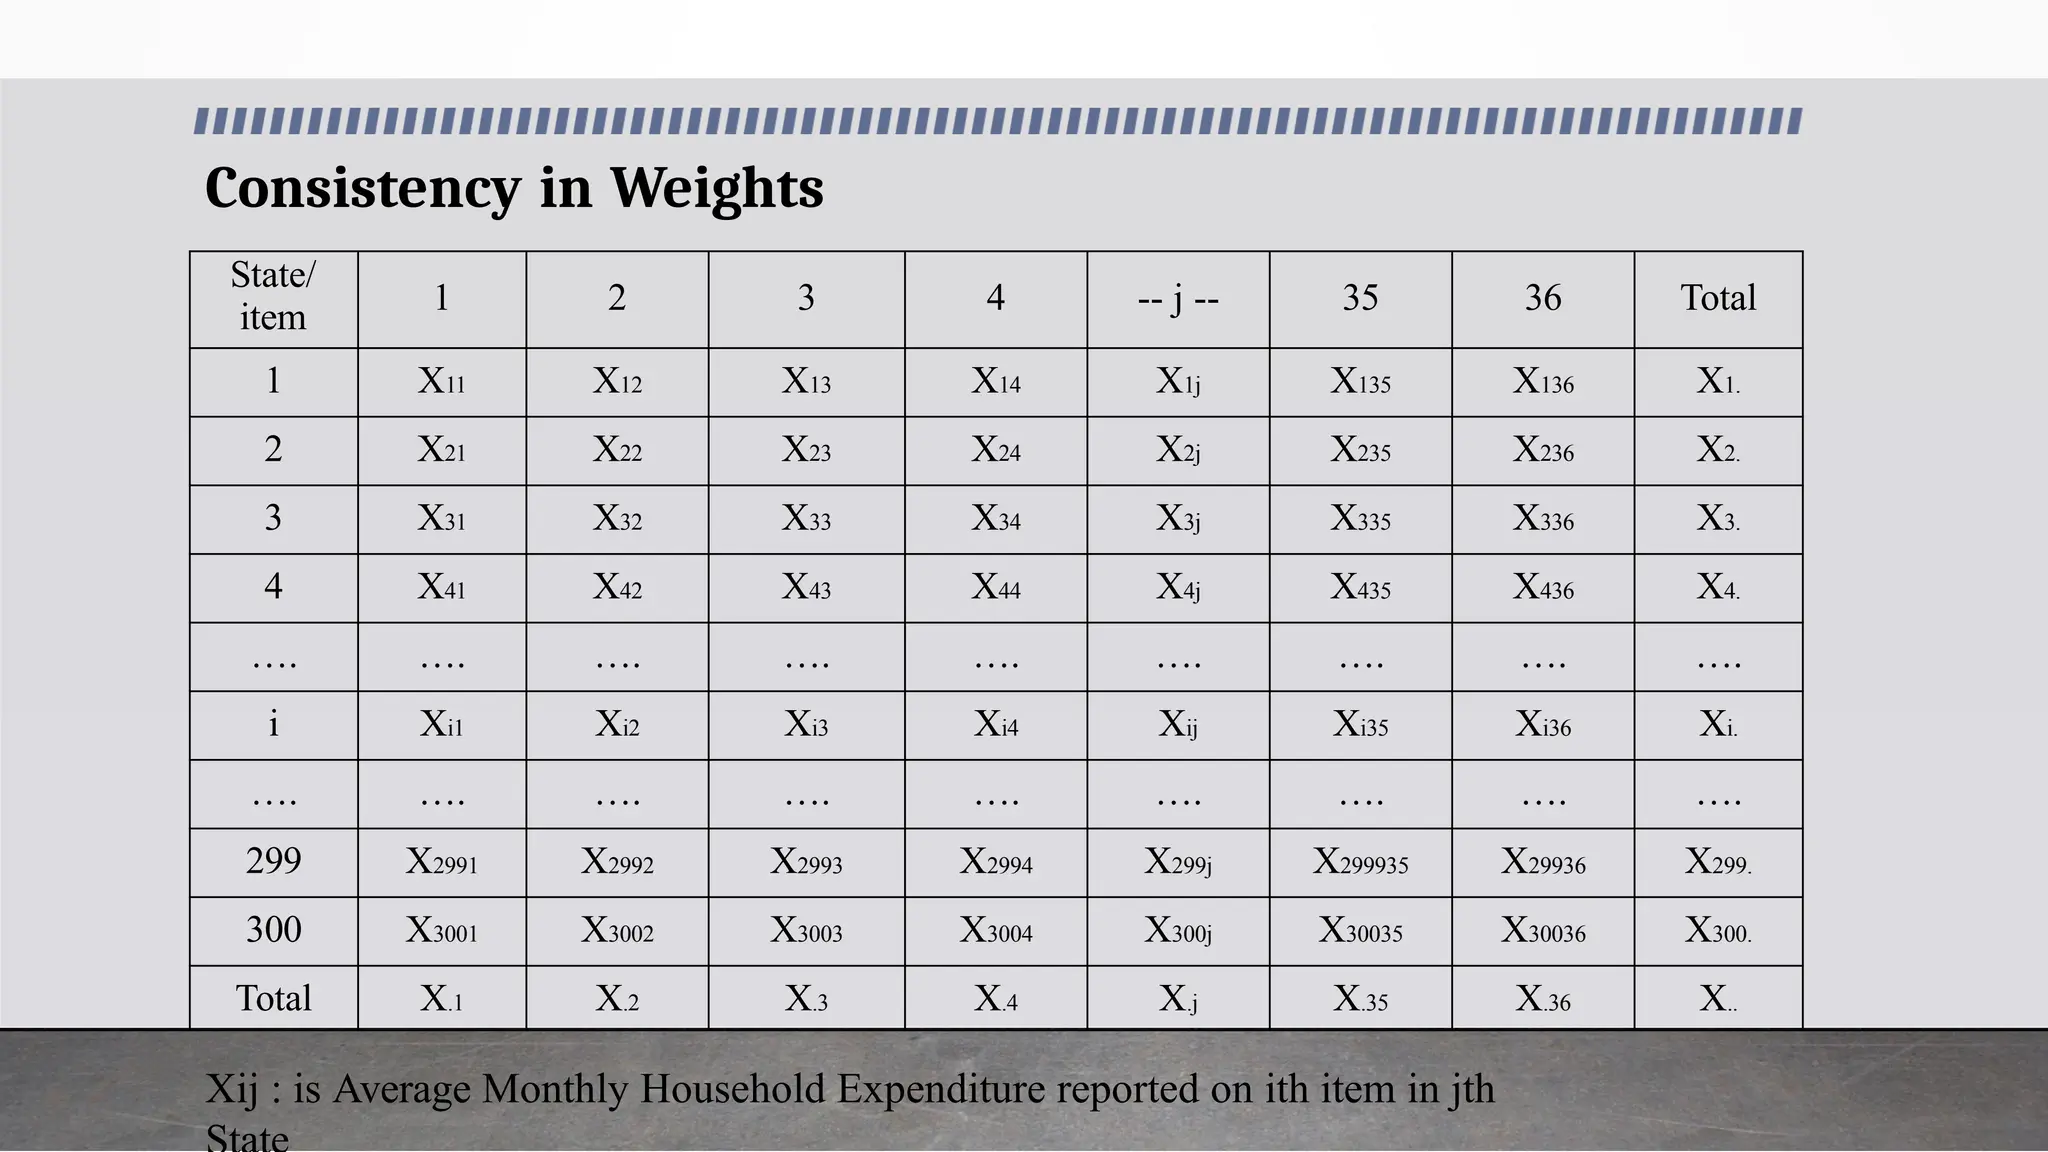
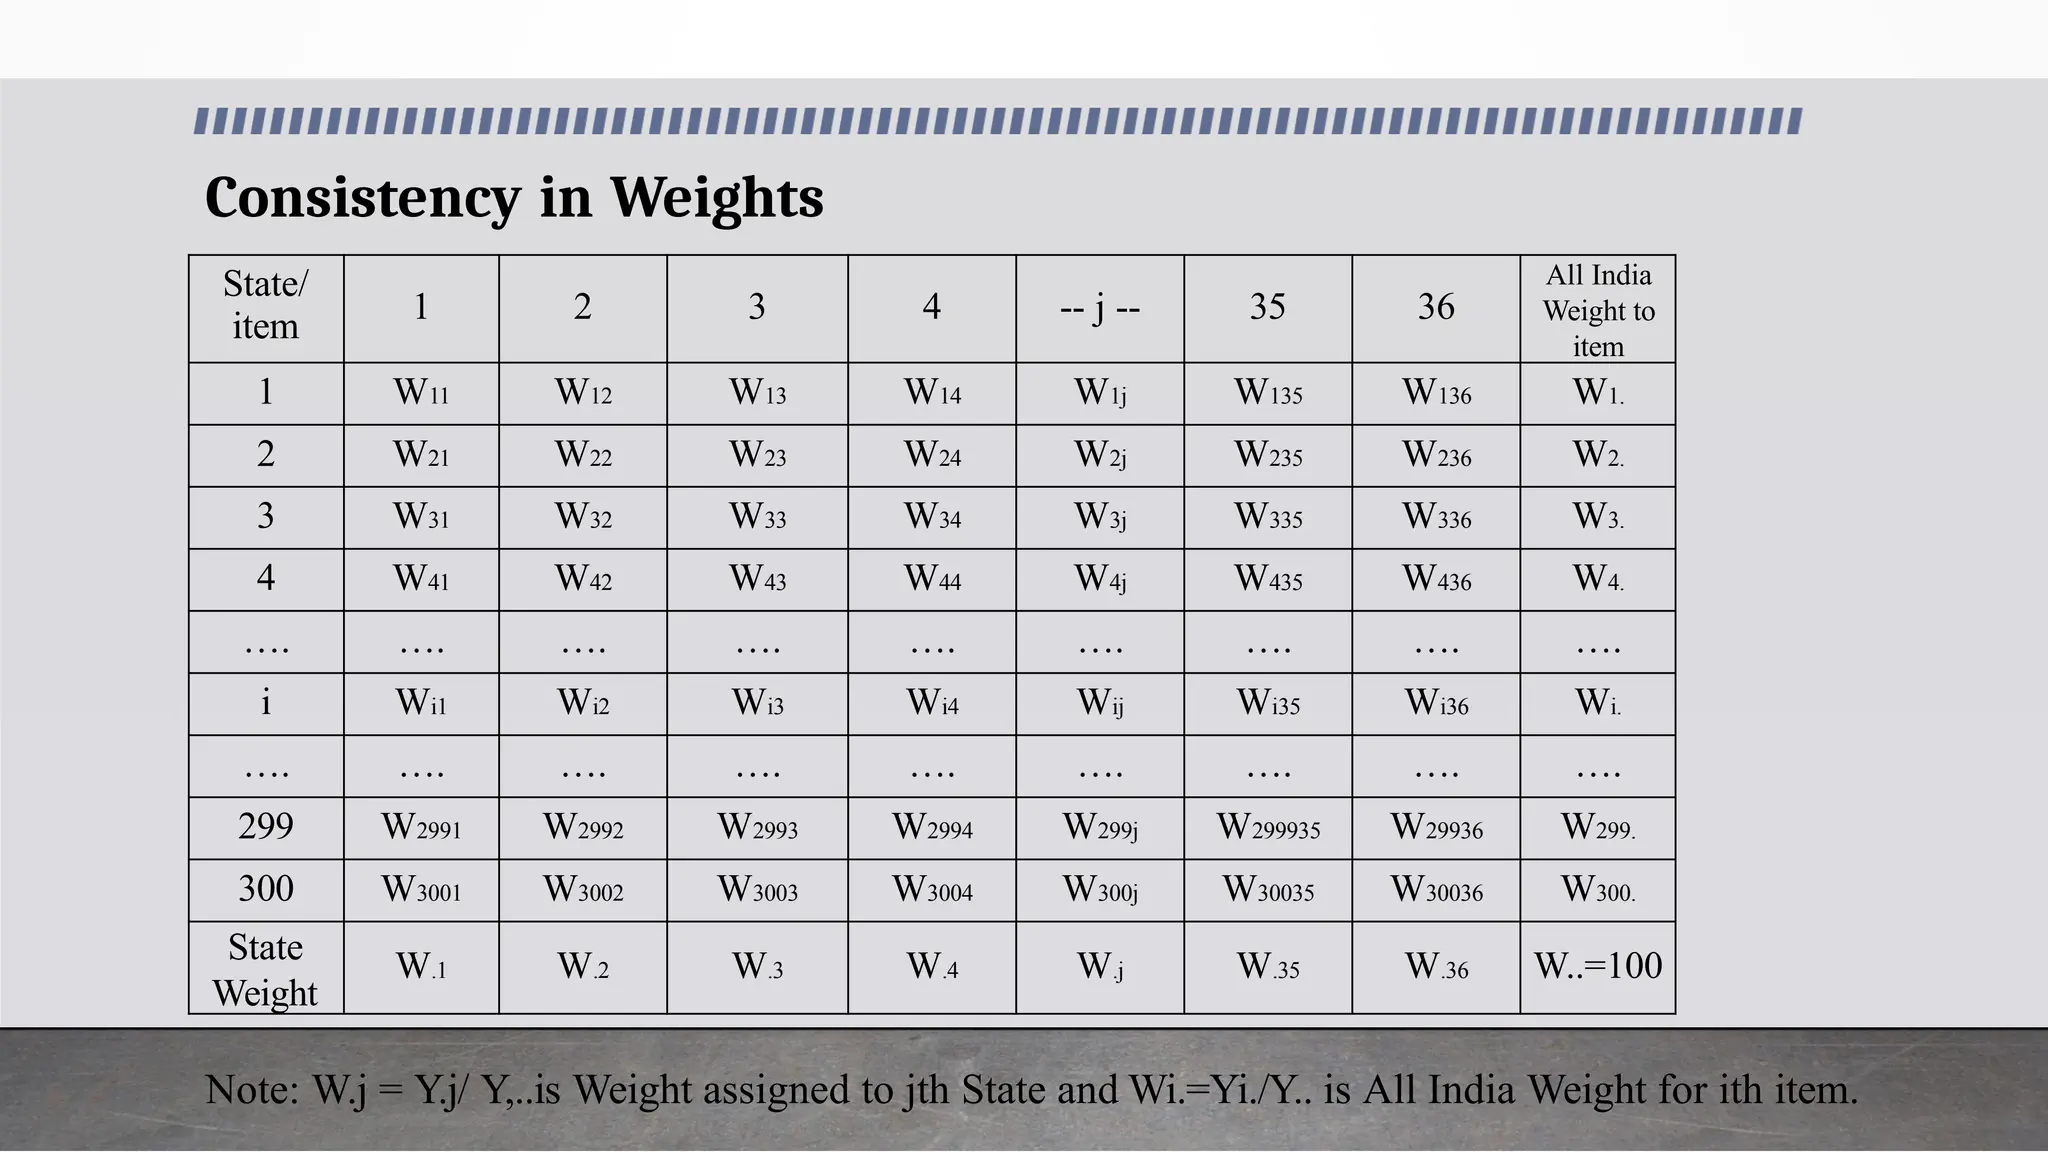
Consistency in Weights
State/
item
12 3 4 -- j -- 35 36 Total
1 N11 N12 N13 N14 N1j N135 N136 N1.
2 N21 N22 N23 N24 N2j N235 N236 N2.
3 N31 N32 N33 N34 N3j N335 N336 N3.
4 N41 N42 N43 N44 N4j N435 N436 N4.
…. …. …. …. …. …. …. …. ….
i Ni1 Ni2 Ni3 Ni4 Nij Ni35 Ni36 Ni.
…. …. …. …. …. …. …. …. ….
299 N2991 N2992 N2993 N2994 N299j N299935 N29936 N299.
300 N3001 N3002 N3003 N3004 N300j N30035 N30036 N300.
Estd. No.
of HH
N.1 N.2 N.3 N.4 N.j N.35 N.36 N..
Nij : is Estimated No. of Household incurred expenditure on ith item in jth
State Note : Sum of Nij over all i is not equal to N.j
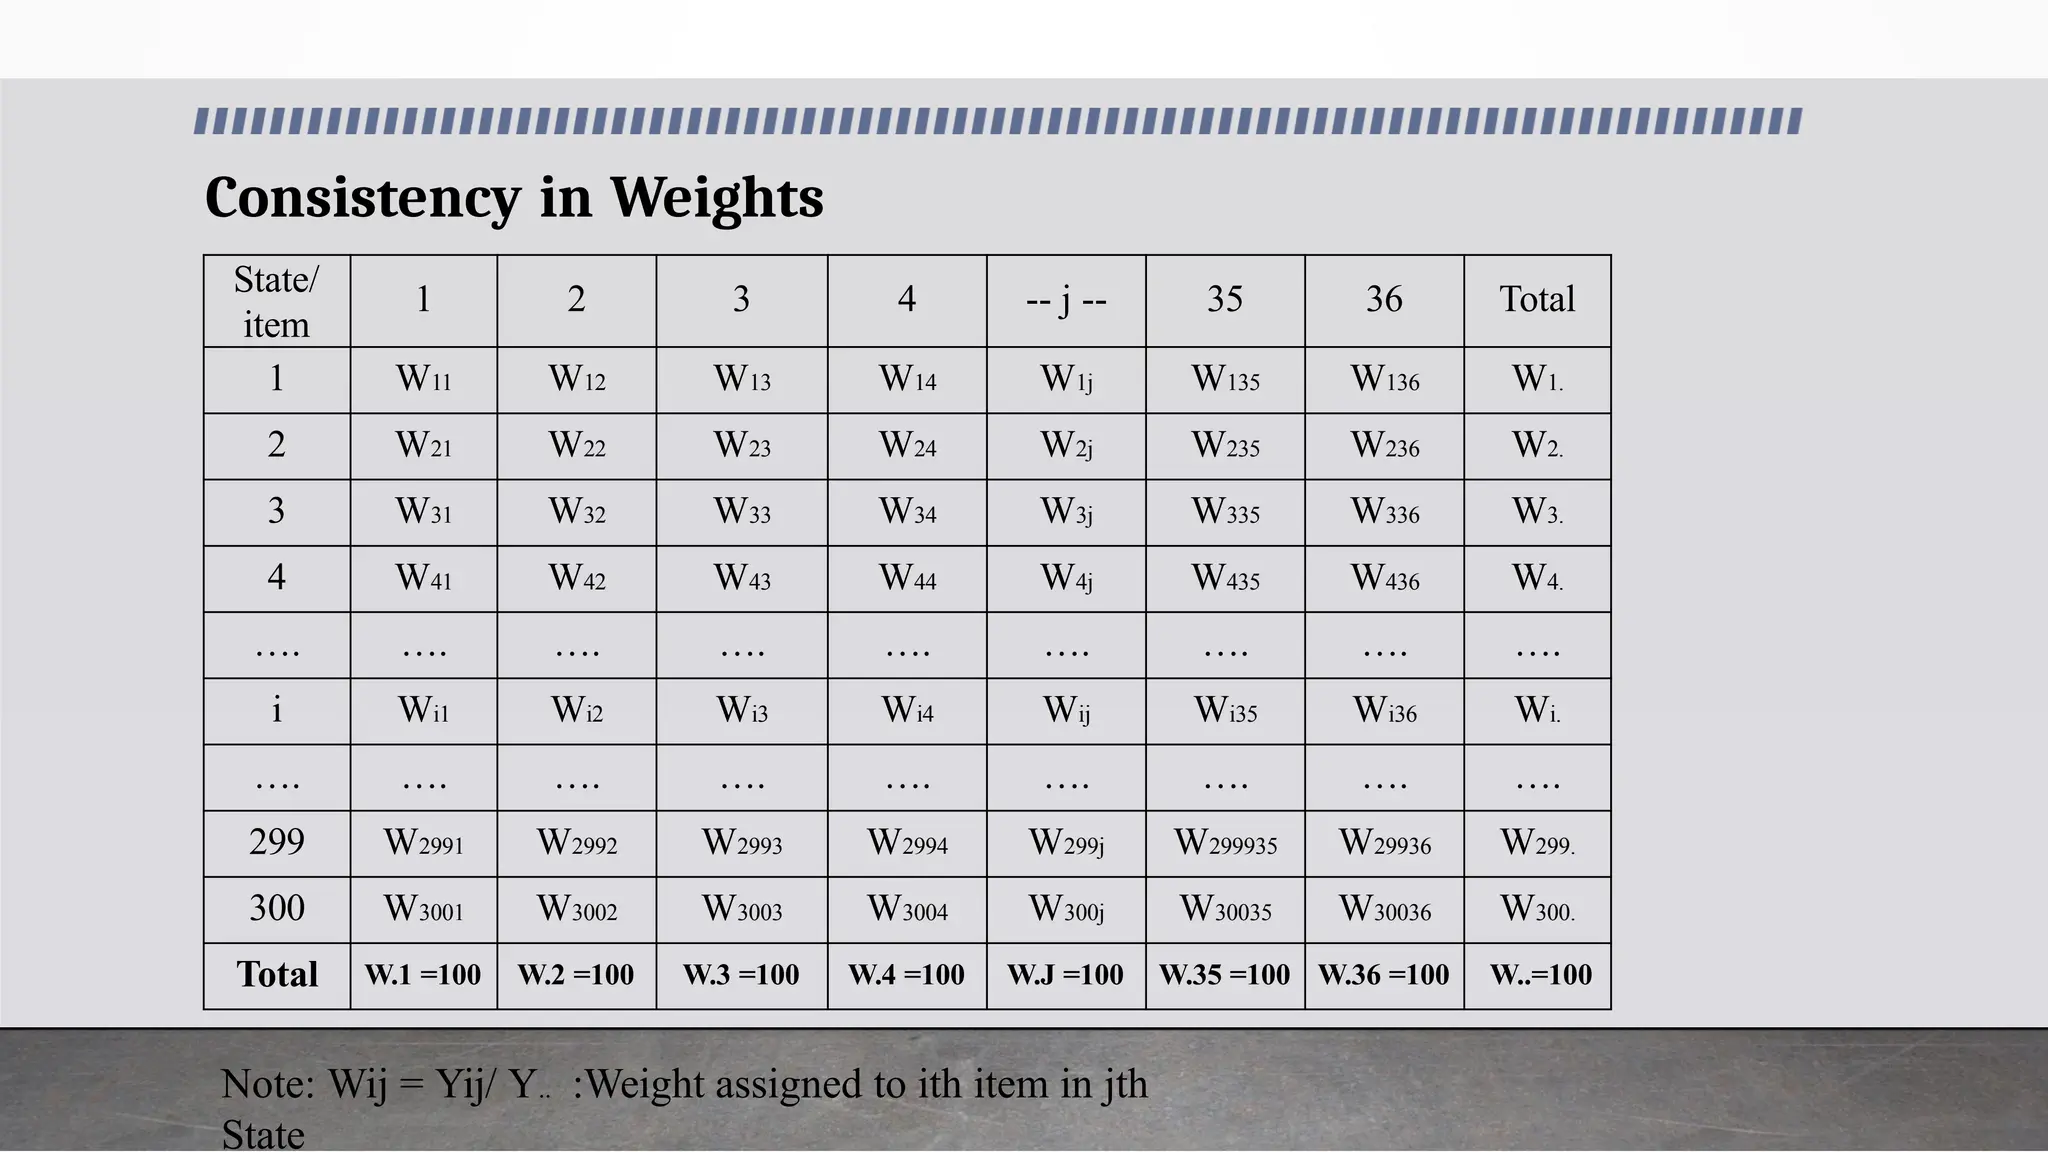
Consistency in Weights
State/
item
12 3 4 -- j -- 35 36
All India
Weight to
item
1 W11 W12 W13 W14 W1j W135 W136 W1.
2 W21 W22 W23 W24 W2j W235 W236 W2.
3 W31 W32 W33 W34 W3j W335 W336 W3.
4 W41 W42 W43 W44 W4j W435 W436 W4.
…. …. …. …. …. …. …. …. ….
i Wi1 Wi2 Wi3 Wi4 Wij Wi35 Wi36 Wi.
…. …. …. …. …. …. …. …. ….
299 W2991 W2992 W2993 W2994 W299j W299935 W29936 W299.
300 W3001 W3002 W3003 W3004 W300j W30035 W30036 W300.
State
Weight
W.1 W.2 W.3 W.4 W.j W.35 W.36 W..=100
Note: W.j = Y.j/ Y,..is Weight assigned to jth State and Wi.=Yi./Y.. is All India Weight for ith item.
73.
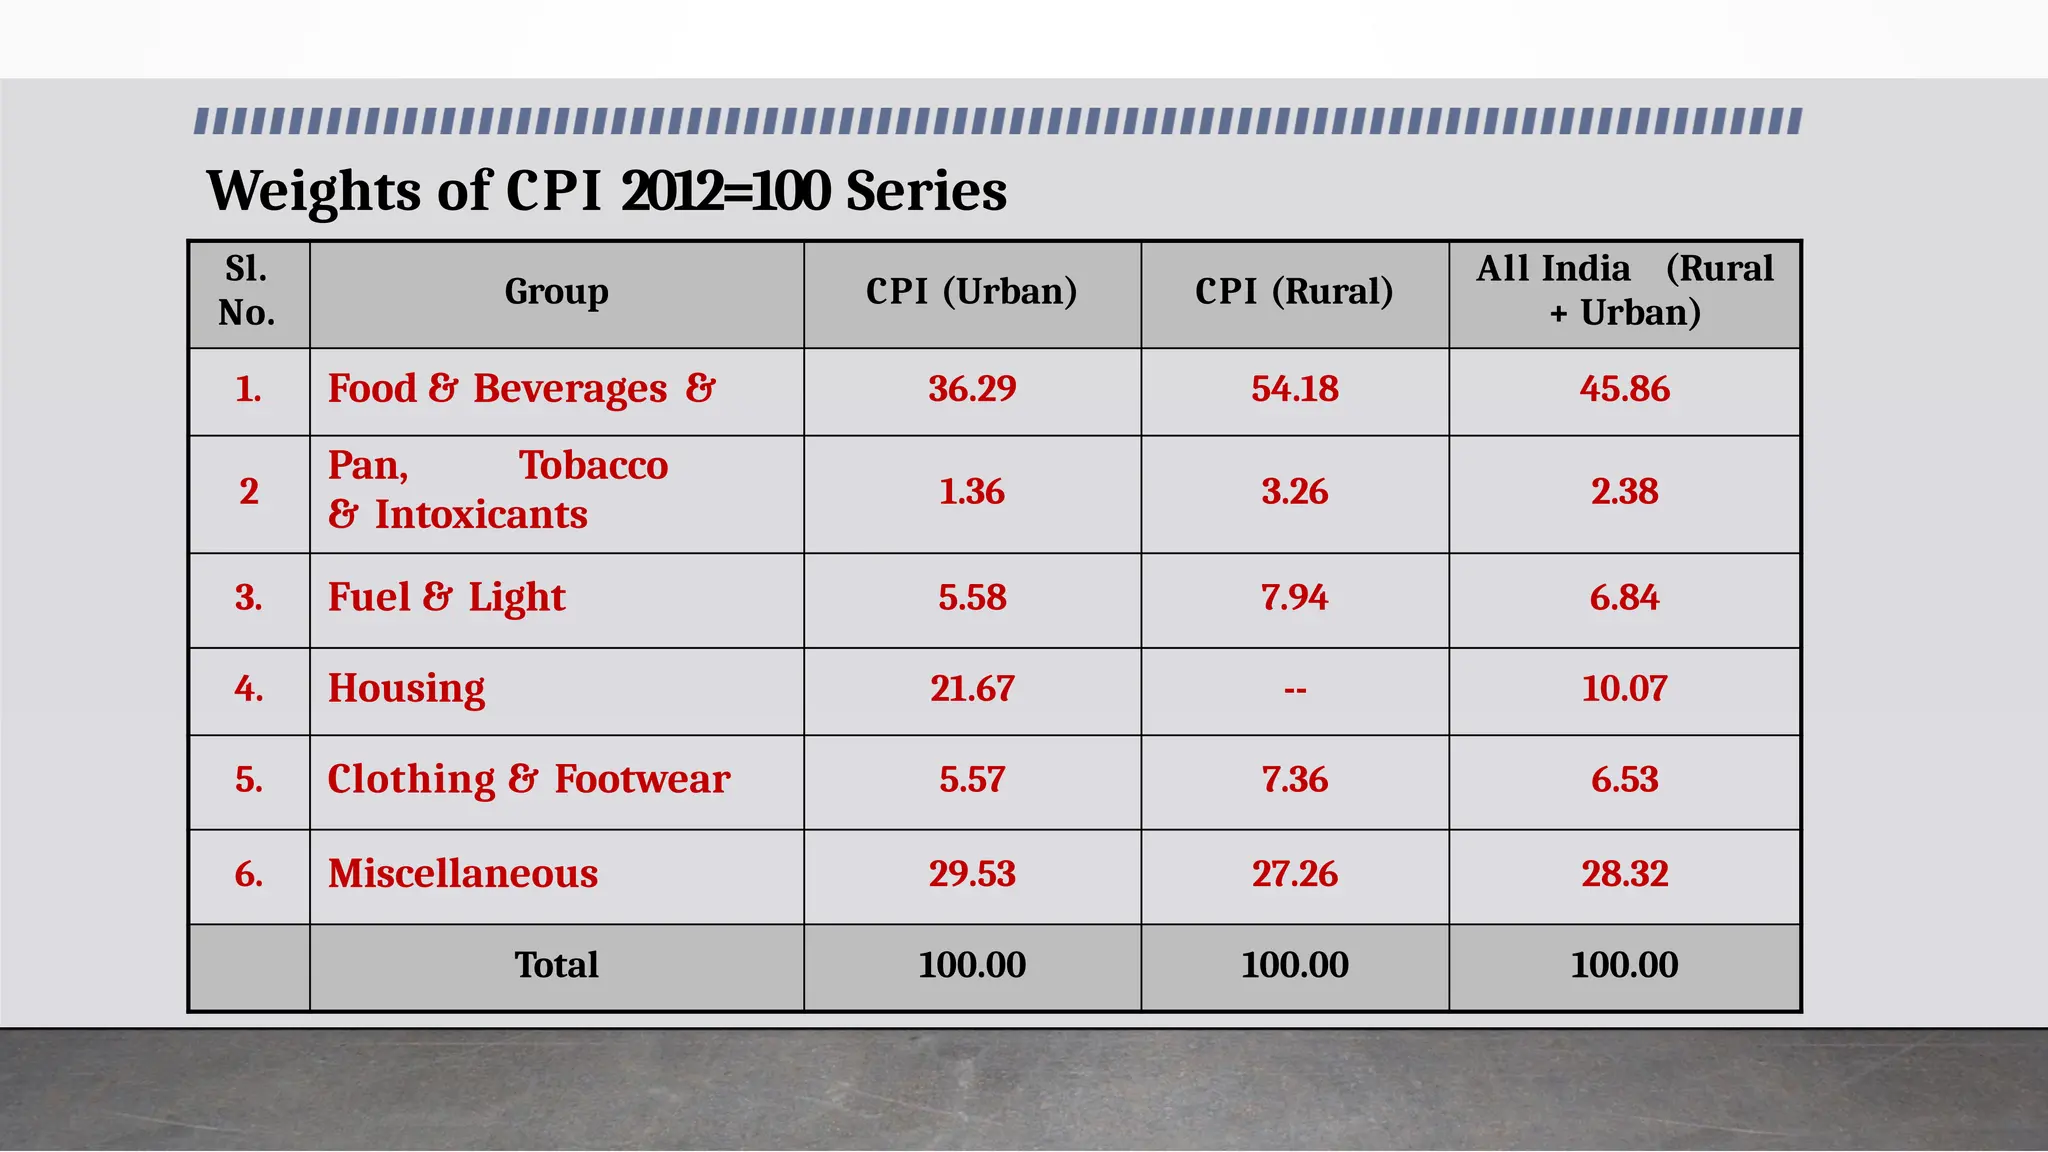
Weights of CPI2012=100 Series
Sl.
No.
Group CPI (Urban) CPI (Rural)
All India (Rural
+ Urban)
1. Food & Beverages & 36.29 54.18 45.86
2
Pan, Tobacco
& Intoxicants
1.36 3.26 2.38
3. Fuel & Light 5.58 7.94 6.84
4. Housing 21.67 -- 10.07
5. Clothing & Footwear 5.57 7.36 6.53
6. Miscellaneous 29.53 27.26 28.32
Total 100.00 100.00 100.00
74.
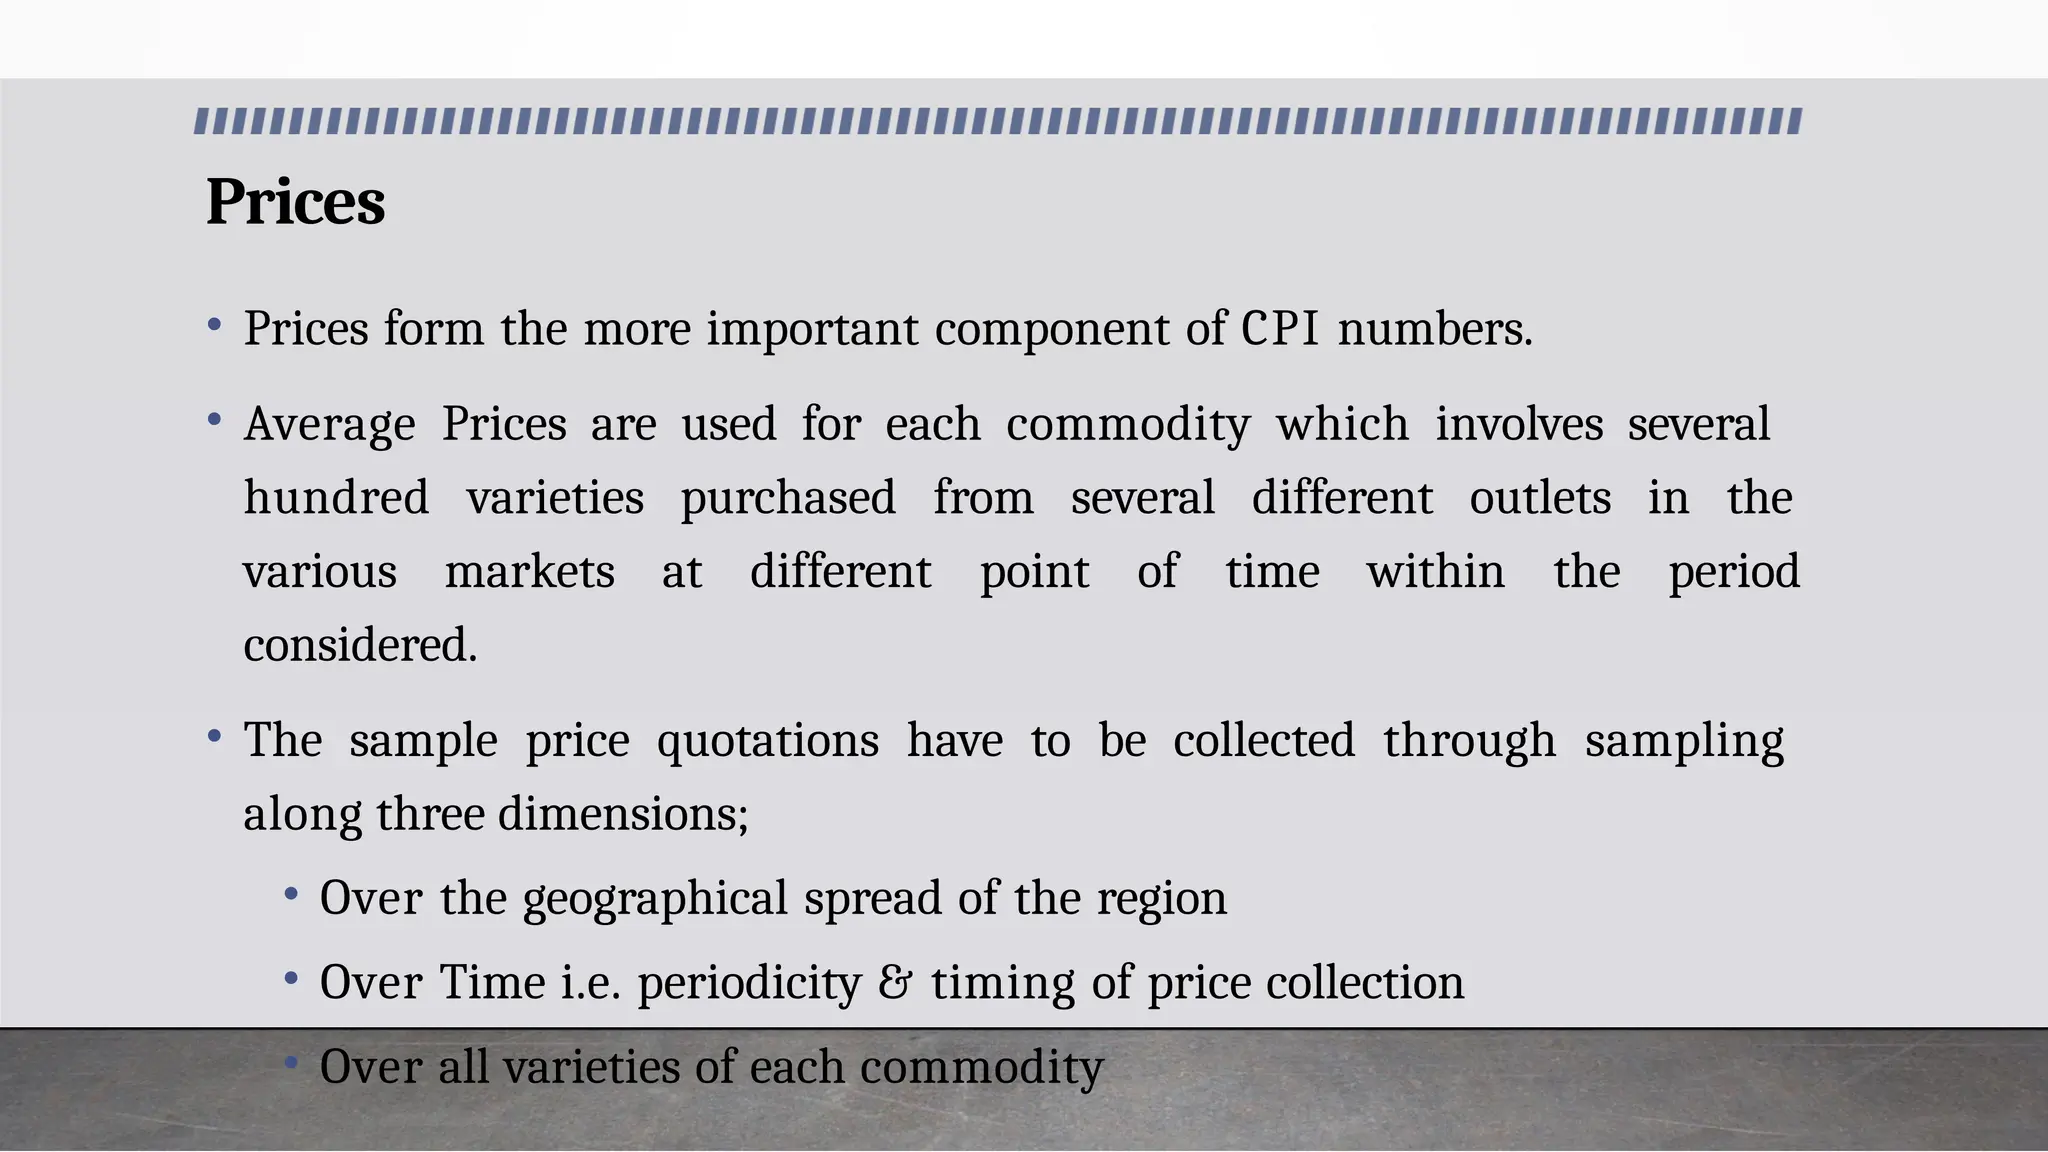
Prices
• Prices formthe more important component of CPI numbers.
• Average Prices are used for each commodity which involves several
hundred varieties purchased from several different outlets in the
various markets at different point of time within the period
considered.
• The sample price quotations have to be collected through sampling
along three dimensions;
• Over the geographical spread of the region
• Over Time i.e. periodicity & timing of price collection
• Over all varieties of each commodity
75.
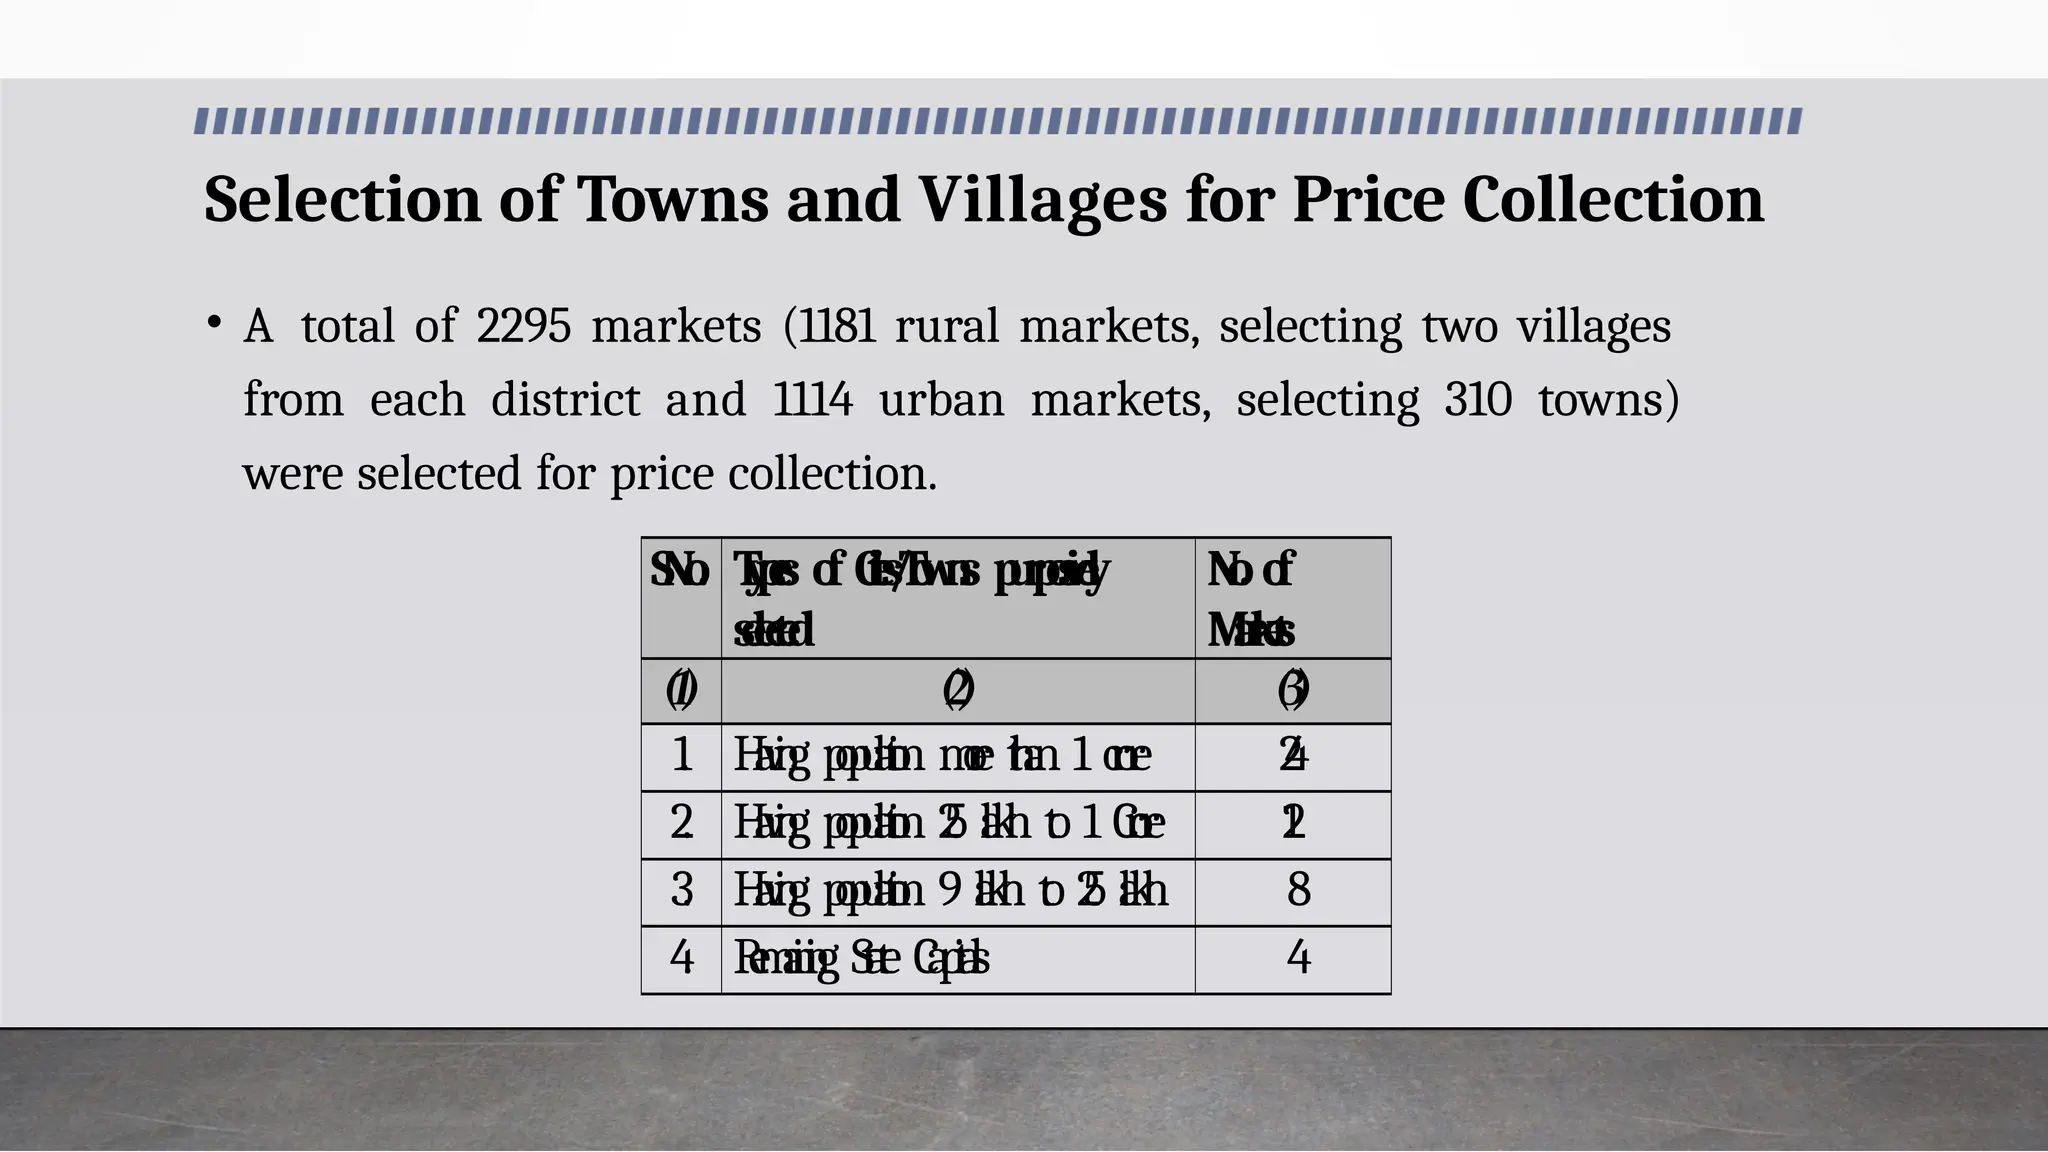
Selection of Townsand Villages for Price Collection
• A total of 2295 markets (1181 rural markets, selecting two villages
from each district and 1114 urban markets, selecting 310 towns)
were selected for price collection.
S
.
N
o
. T
y
p
e
s o
f C
i
t
i
e
s
/
T
o
w
n
s p
u
r
p
o
s
i
v
e
l
y
s
e
l
e
c
t
e
d
N
o
. o
f
M
a
r
k
e
t
s
(
1
) (
2
) (
3
)
1
. H
a
v
i
n
g p
o
p
u
l
a
t
i
o
n m
o
r
e t
h
a
n 1 c
r
o
r
e 2
4
2
. H
a
v
i
n
g p
o
p
u
l
a
t
i
o
n 2
5 l
a
k
h t
o 1 C
r
o
r
e 1
2
3
. H
a
v
i
n
g p
o
p
u
l
a
t
i
o
n 9 l
a
k
h t
o 2
5 l
a
k
h 8
4
. R
e
m
a
i
n
i
n
g S
t
a
t
e C
a
p
i
t
a
l
s 4
76.
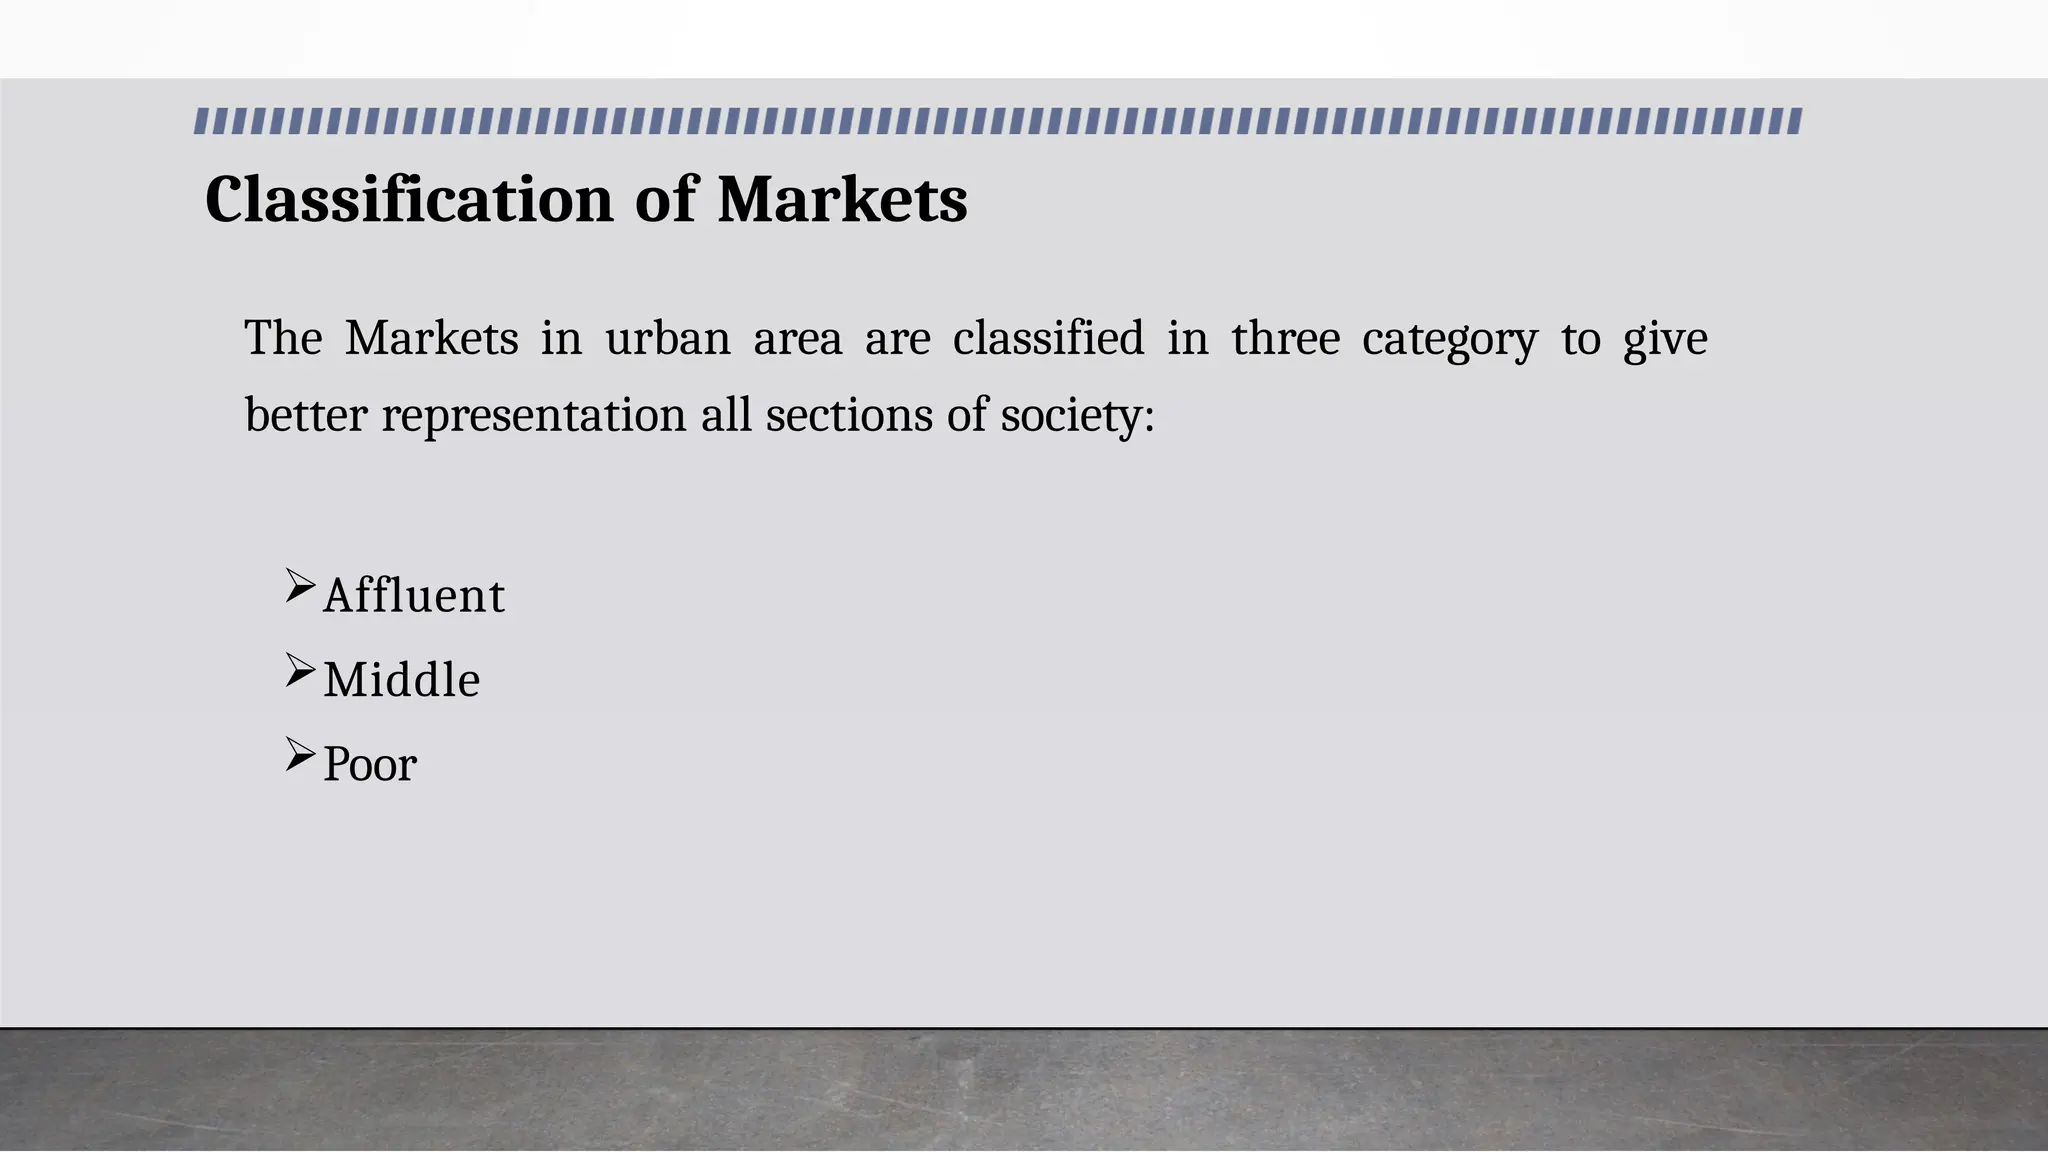
Classification of Markets
TheMarkets in urban area are classified in three category to give
better representation all sections of society:
Affluent
Middle
Poor
77.
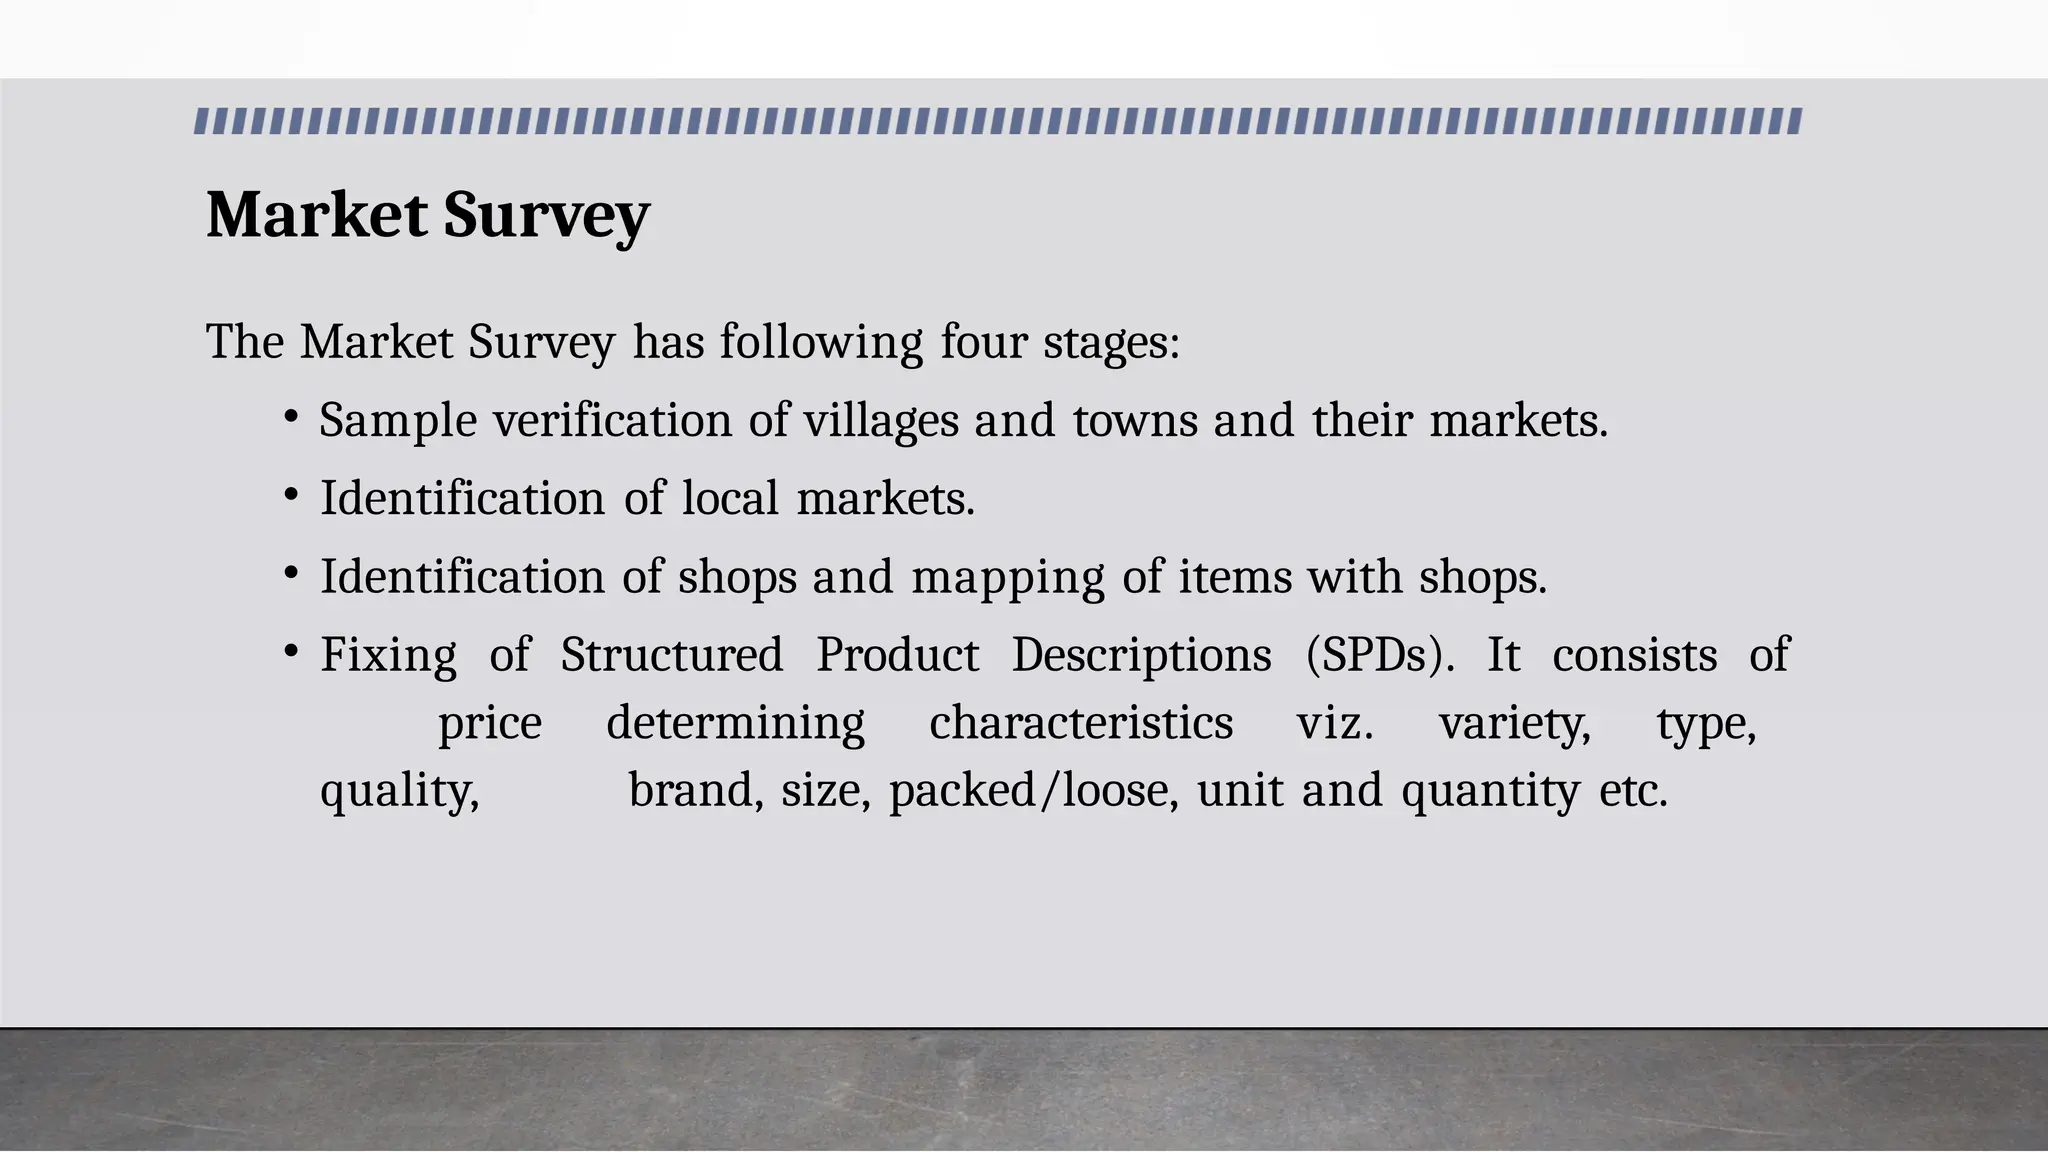
Market Survey
The MarketSurvey has following four stages:
• Sample verification of villages and towns and their markets.
• Identification of local markets.
• Identification of shops and mapping of items with shops.
• Fixing of Structured Product Descriptions (SPDs). It consists of
price determining characteristics viz. variety, type,
quality, brand, size, packed/loose, unit and quantity etc.
78.
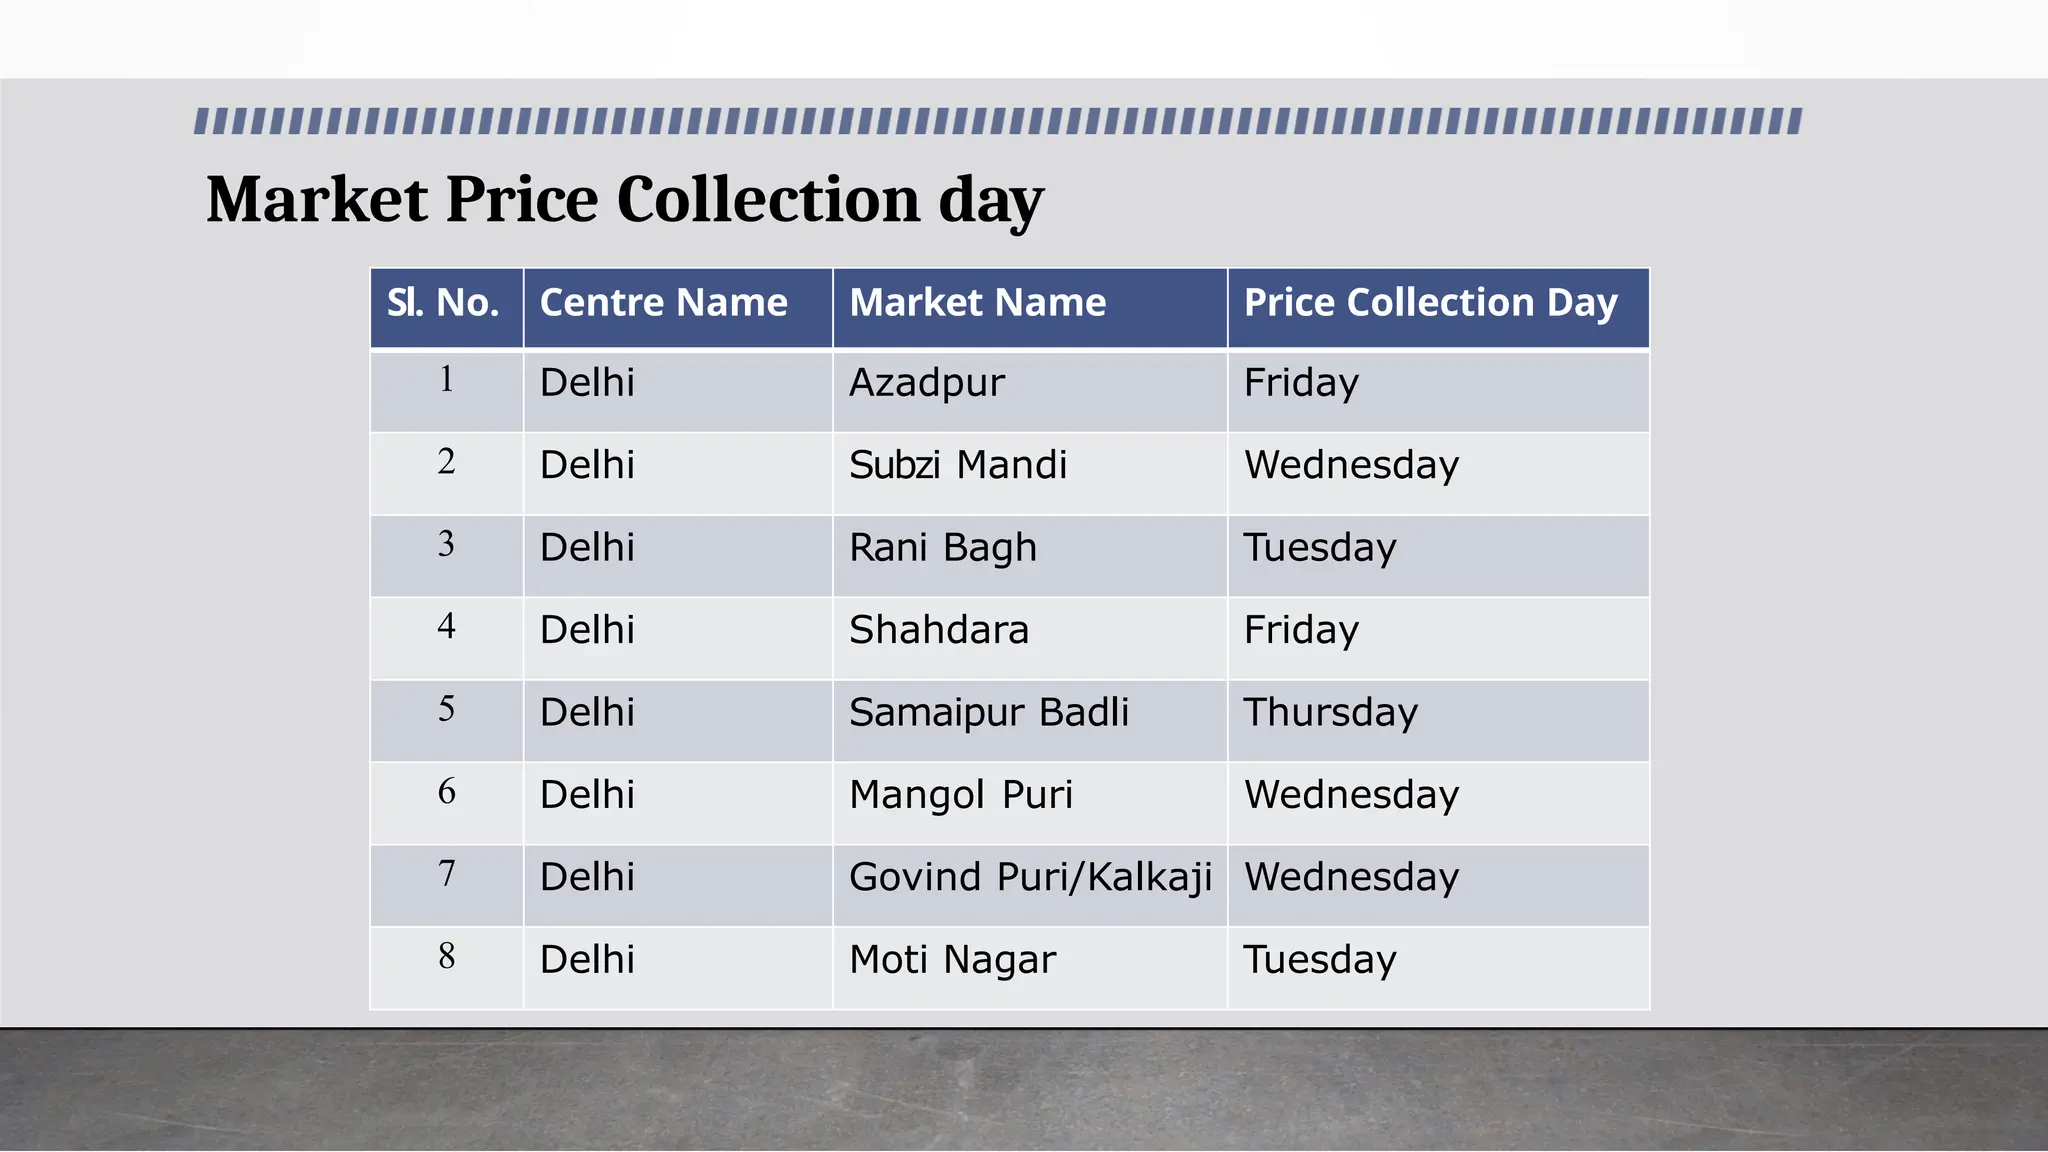
Market Price Collectionday
Sl. No. Centre Name Market Name Price Collection Day
1 Delhi Azadpur Friday
2 Delhi Subzi Mandi Wednesday
3 Delhi Rani Bagh Tuesday
4 Delhi Shahdara Friday
5 Delhi Samaipur Badli Thursday
6 Delhi Mangol Puri Wednesday
7 Delhi Govind Puri/Kalkaji Wednesday
8 Delhi Moti Nagar Tuesday
79.
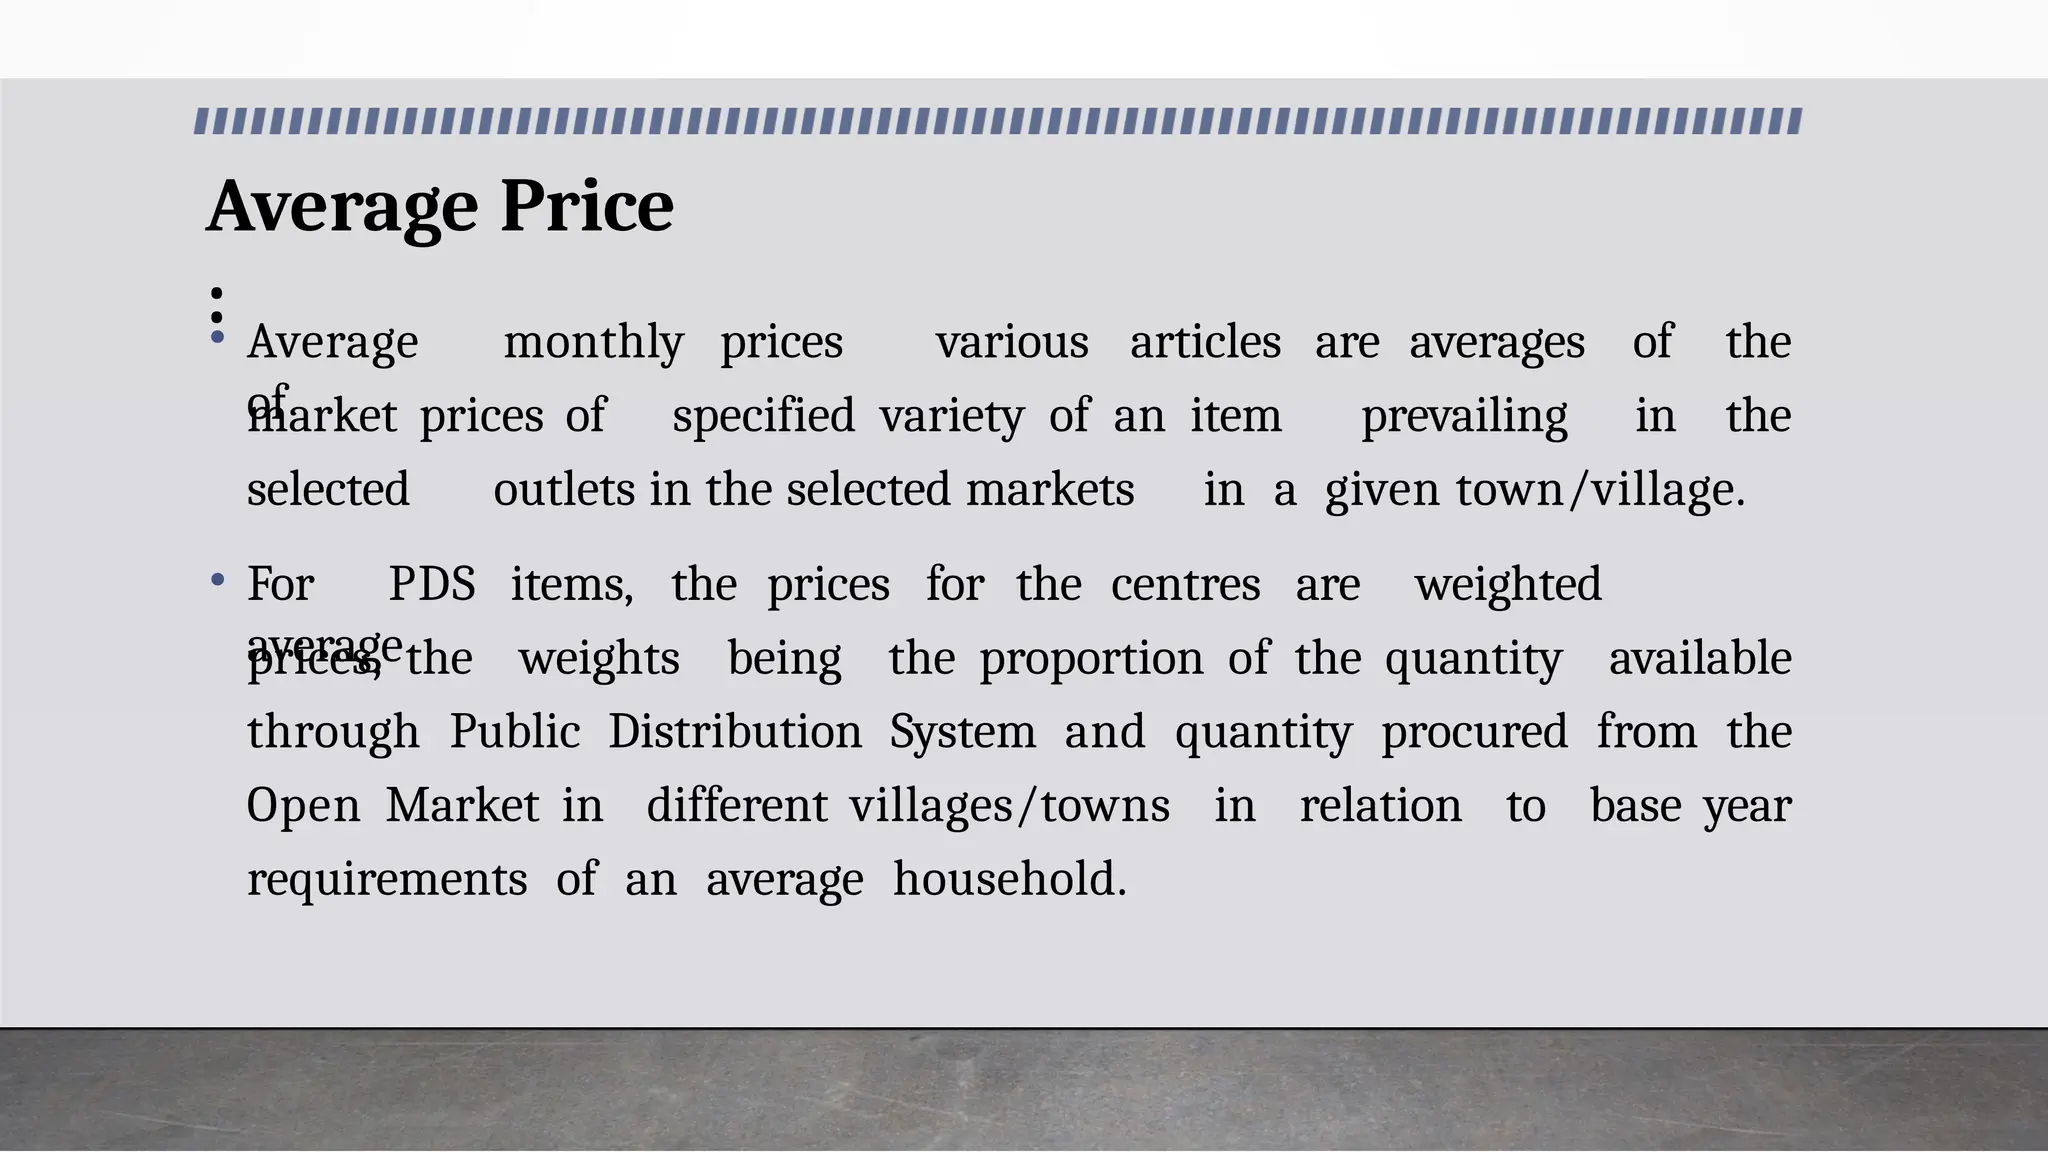
Average Price
:
• Averagemonthly prices
of
market prices of specified variety of an item prevailing in
various articles are averages of the
the
selected outlets in the selected markets in a given town/village.
• For PDS items, the prices for the centres are weighted
average
prices, the weights being the proportion of the quantity available
through Public Distribution System and quantity procured from the
Open Market in different villages/towns in relation to base year
requirements of an average household.
80.
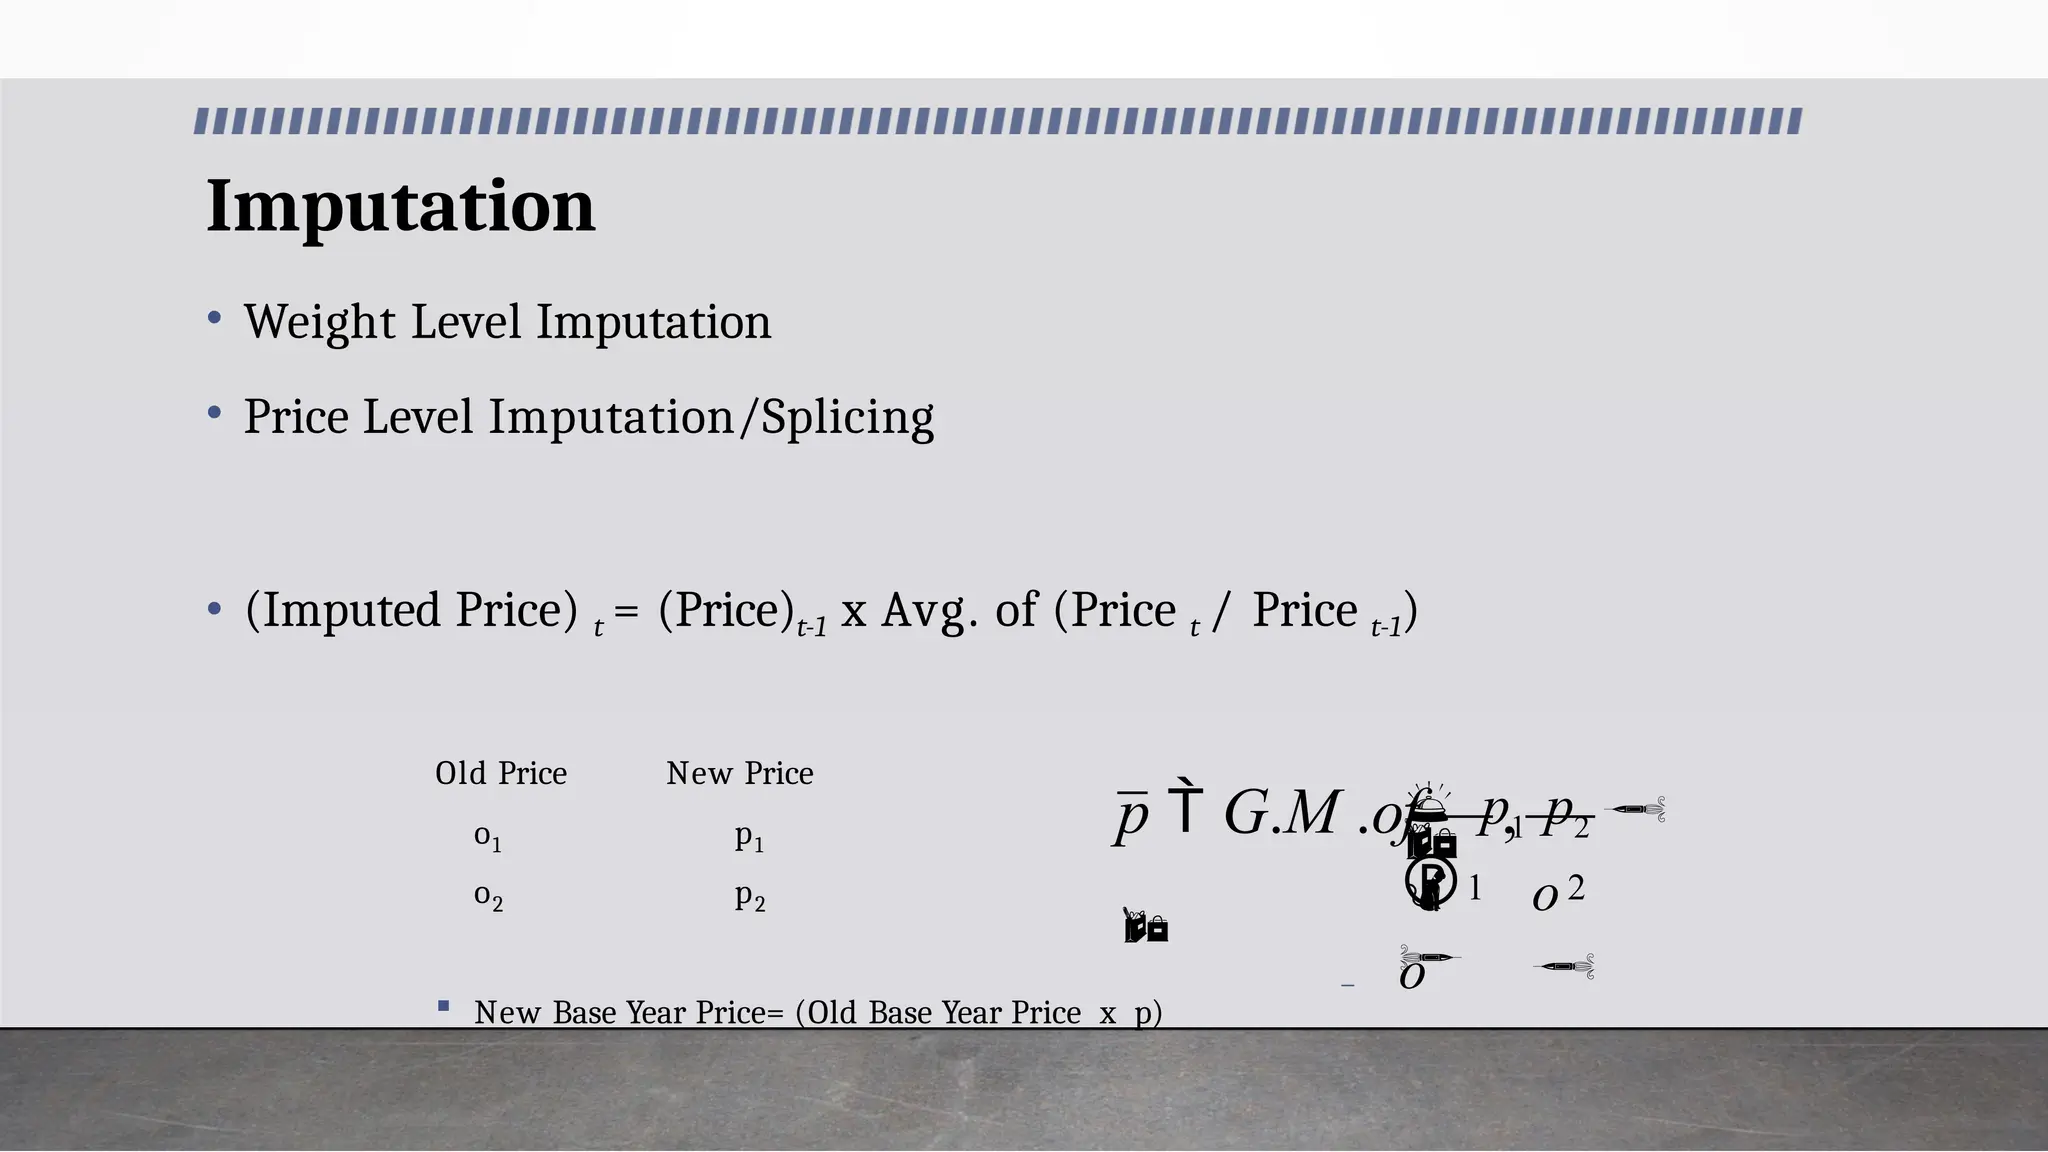
Imputation
• Weight LevelImputation
• Price Level Imputation/Splicing
• (Imputed Price) t = (Price)t-1 x Avg. of (Price t / Price t-1)
Old Price New Price
1 1
o
o2
p
p2
New Base Year Price= (Old Base Year Price x p)
1 2
,
o
o
p1 p2
p G.M .of
81.
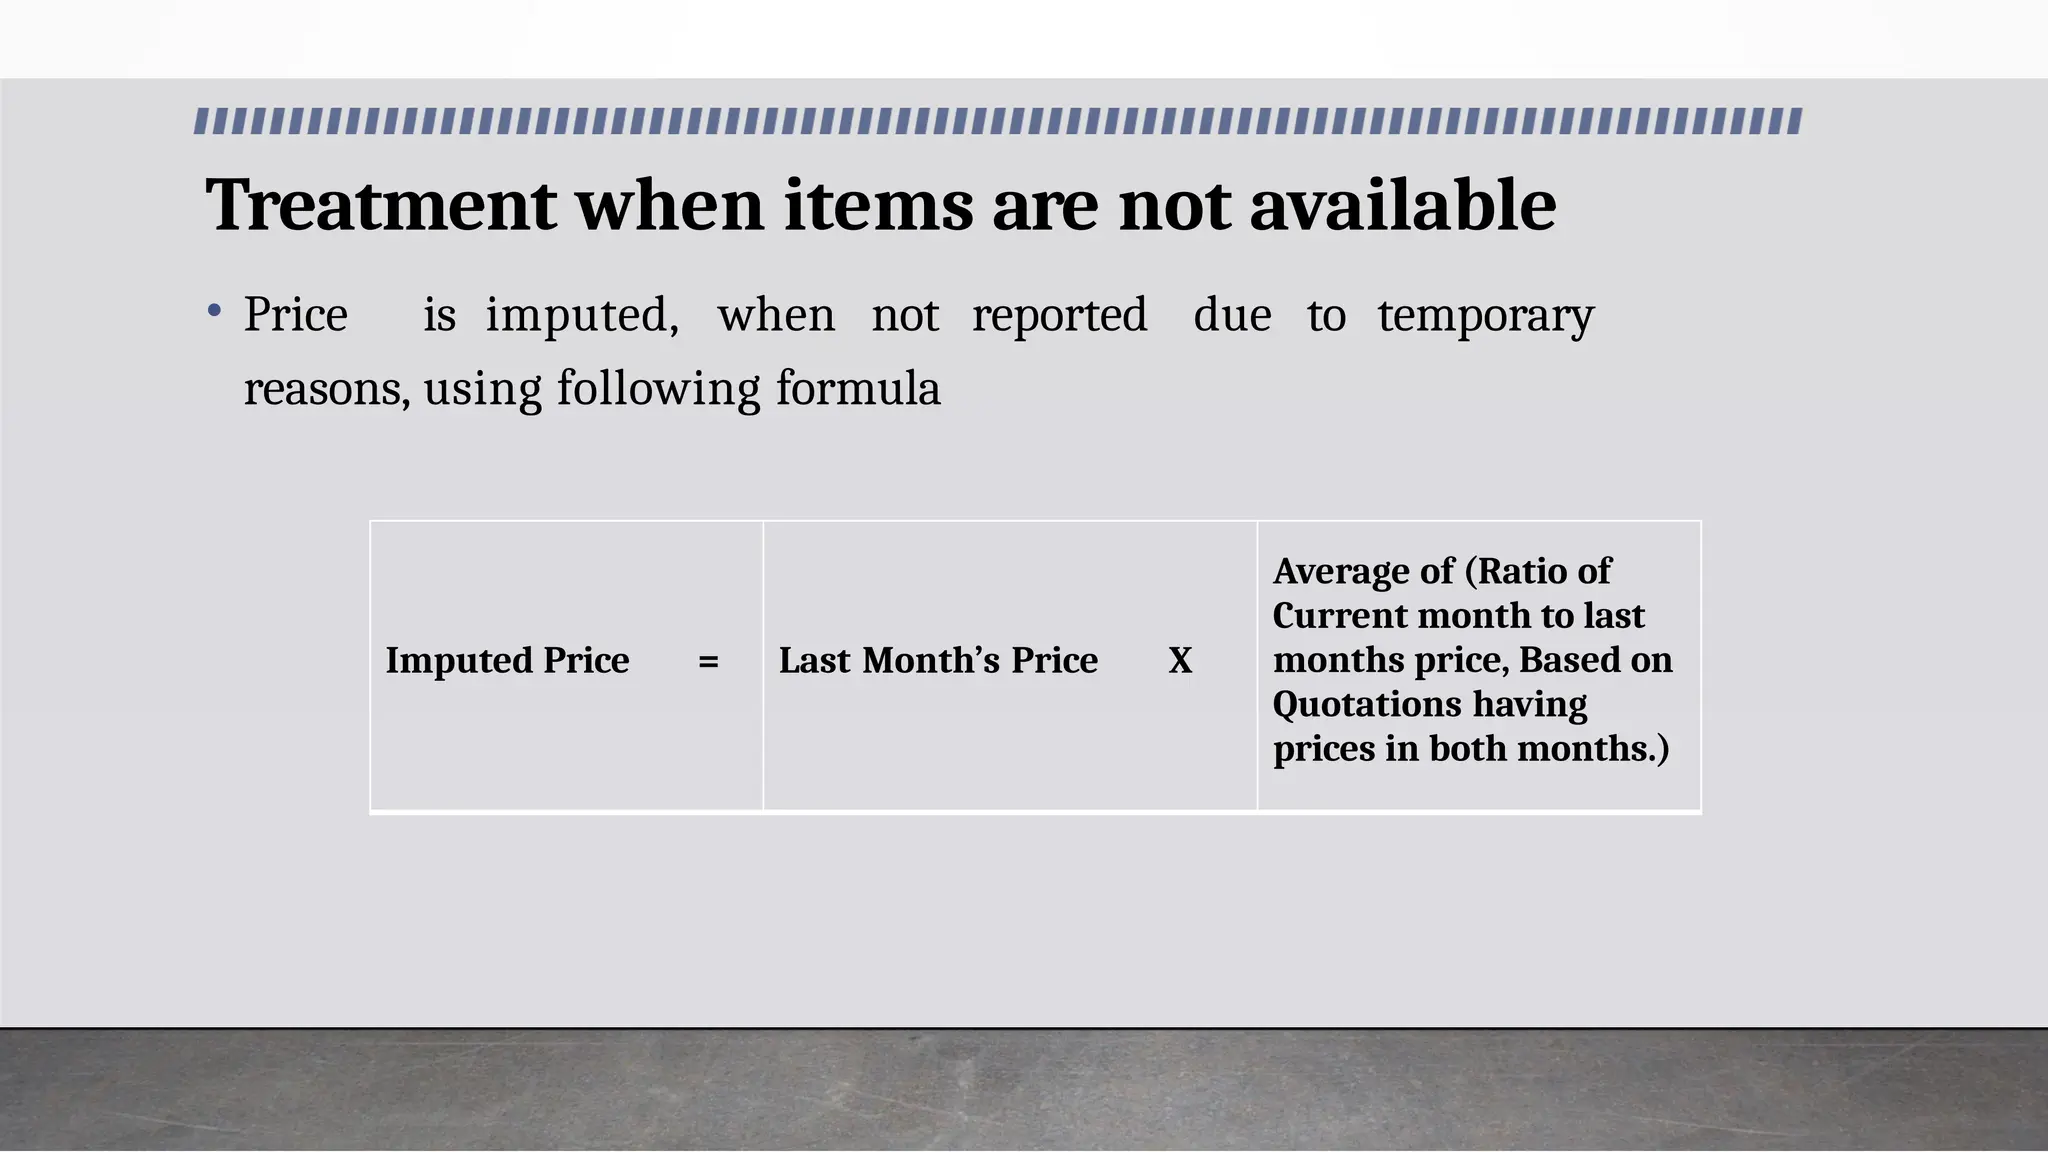
Treatment when itemsare not available
• Price is imputed, when not reported due to temporary
reasons, using following formula
Imputed Price = Last Month’s Price X
Average of (Ratio of
Current month to last
months price, Based on
Quotations having
prices in both months.)
82.
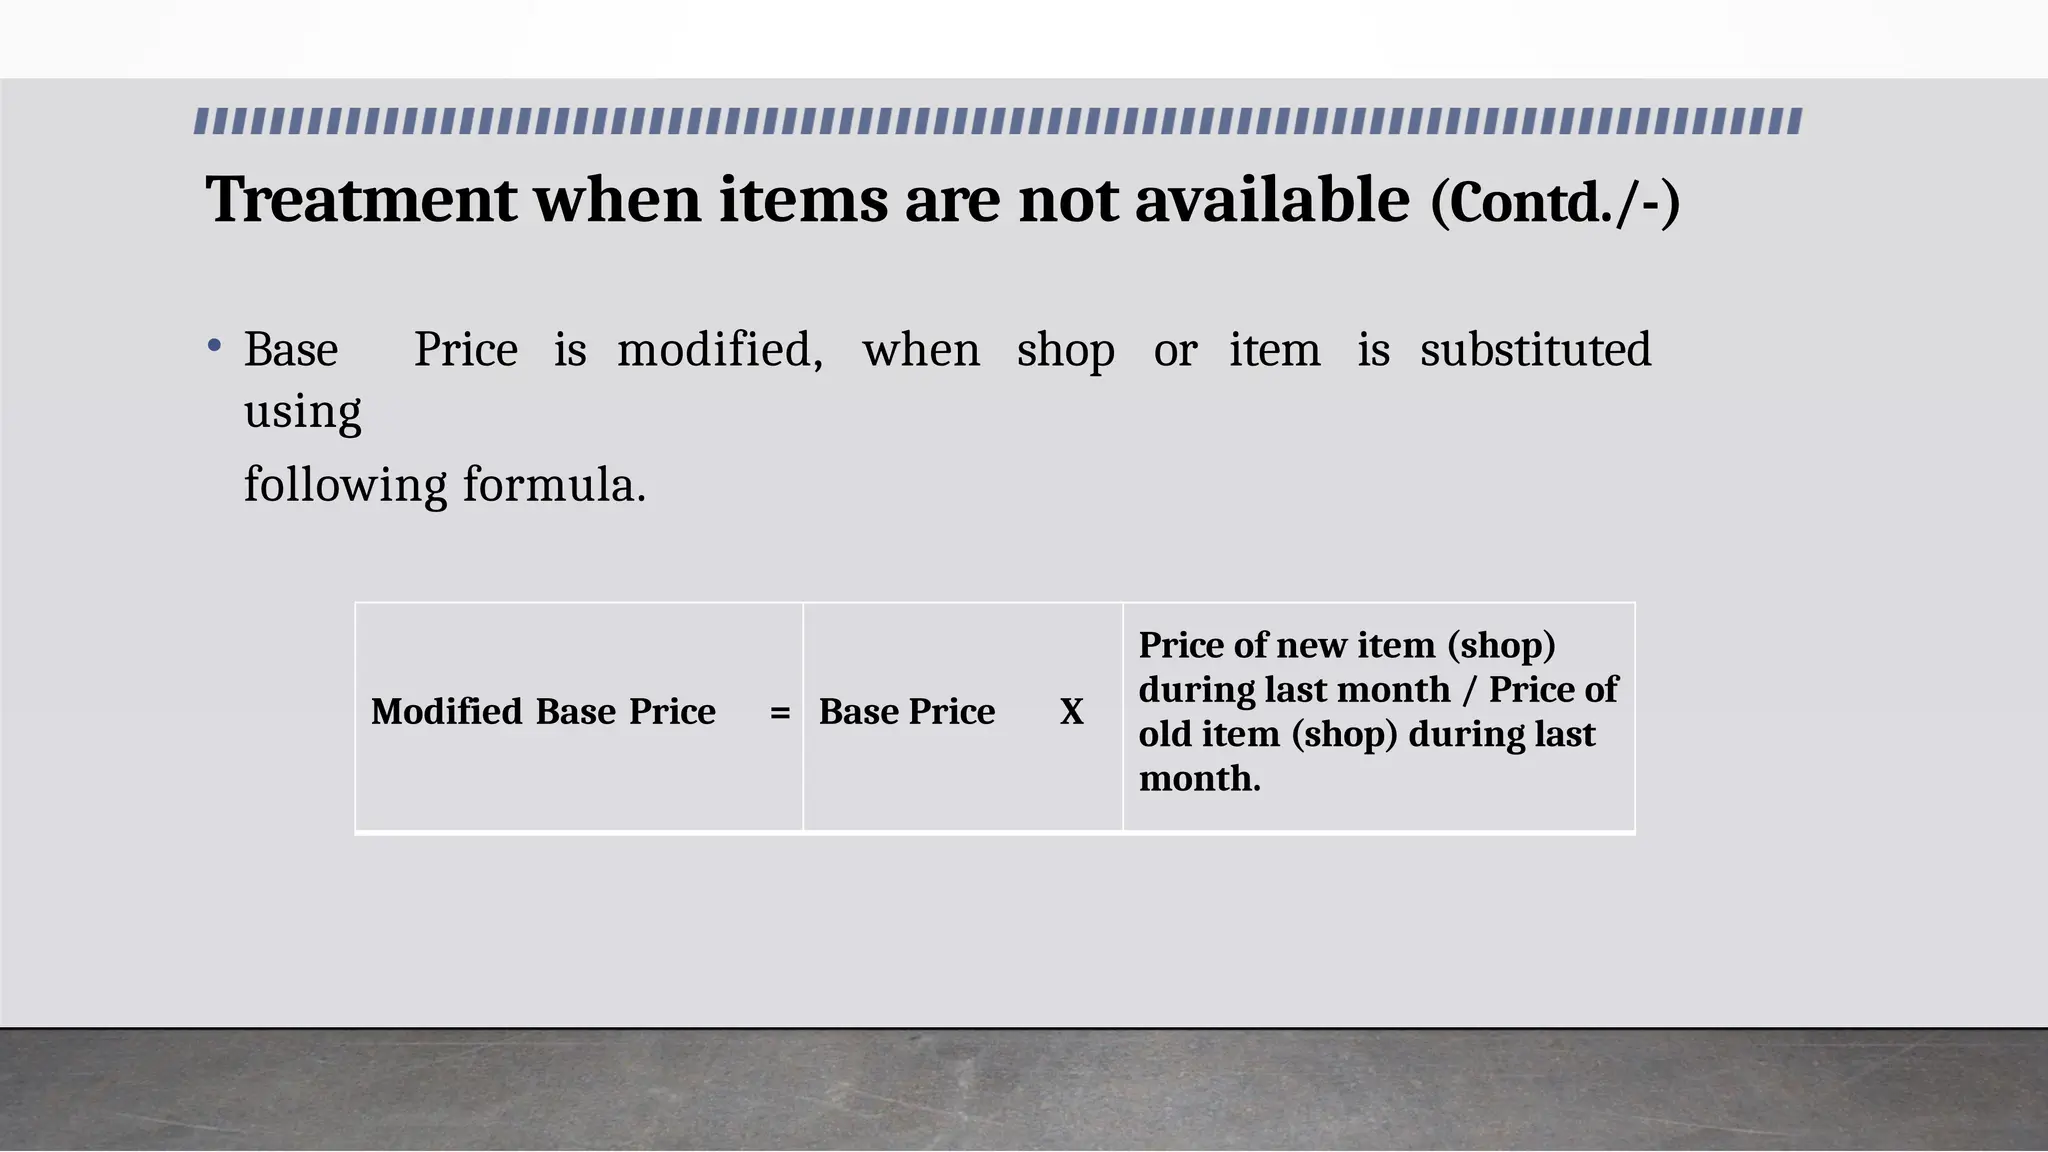
Treatment when itemsare not available (Contd./-)
• Base Price is modified, when shop or item is substituted
using
following formula.
Modified Base Price = Base Price X
Price of new item (shop)
during last month / Price of
old item (shop) during last
month.
83.
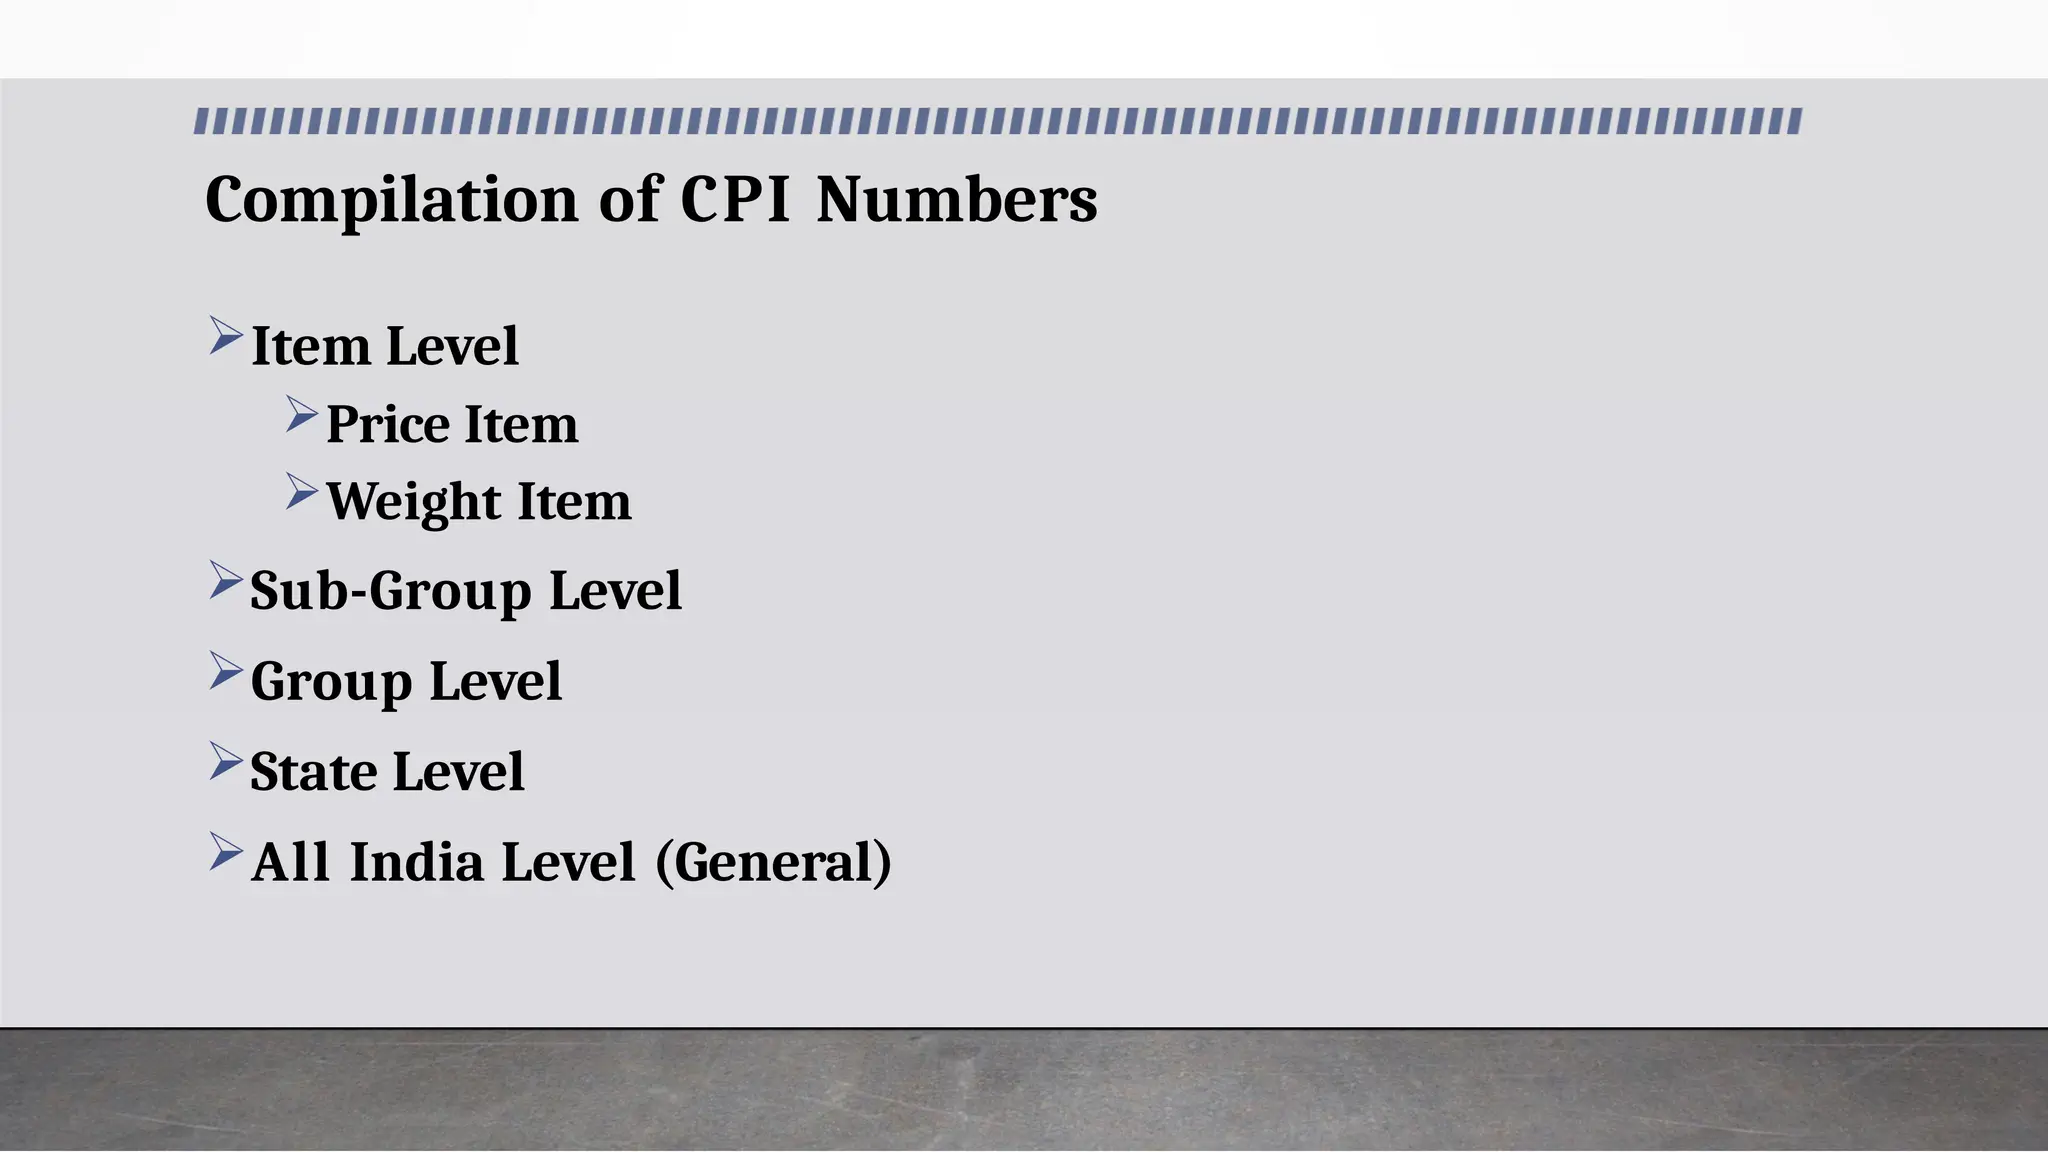
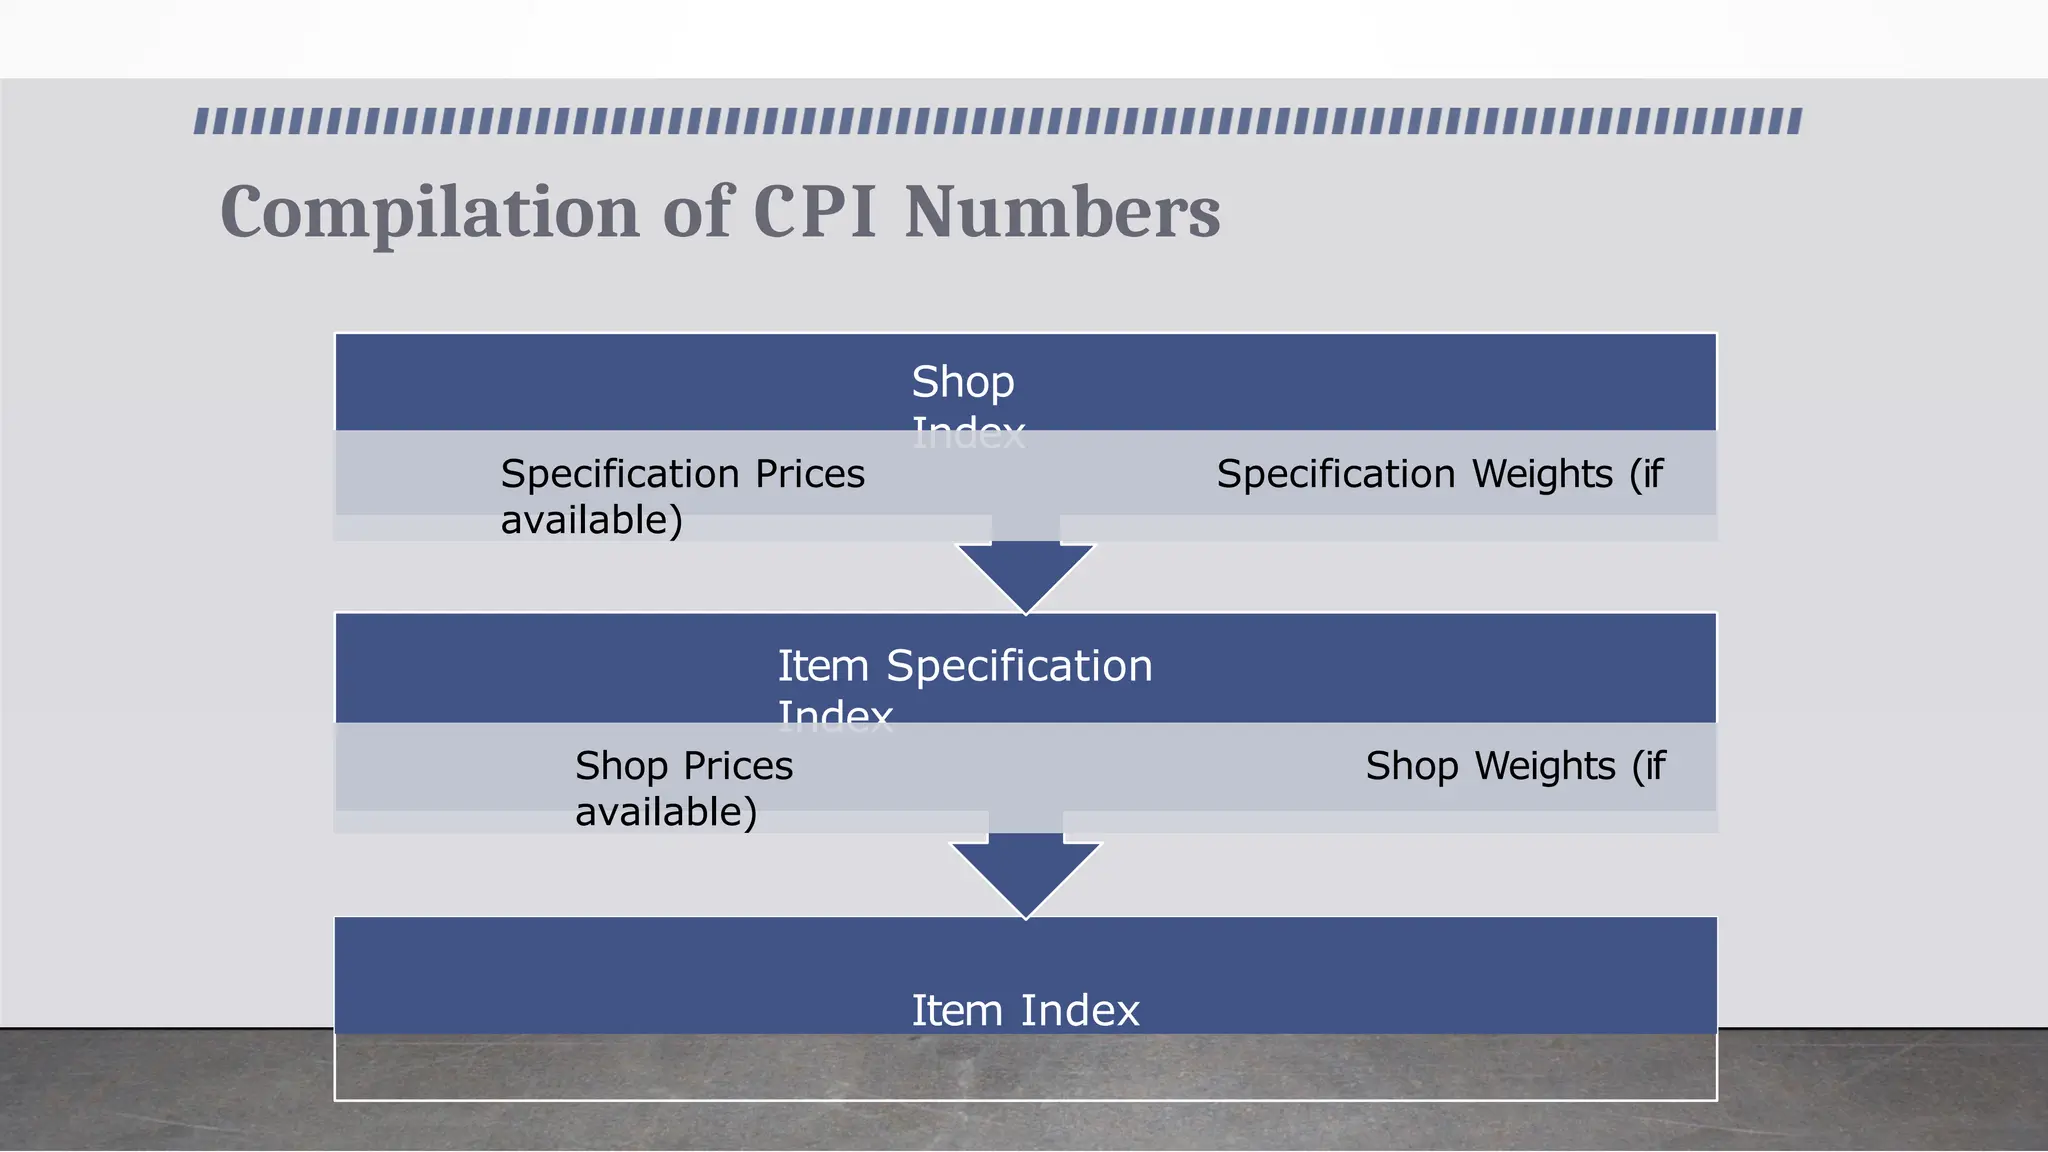
Compilation of CPINumbers
Item Level
Price Item
Weight Item
Sub-Group Level
Group Level
State Level
All India Level (General)
84.
Compilation of CPINumbers
Item Index
Item Specification
Index
Shop Prices Shop Weights (if
available)
Shop
Index
Specification Prices Specification Weights (if
available)
85.
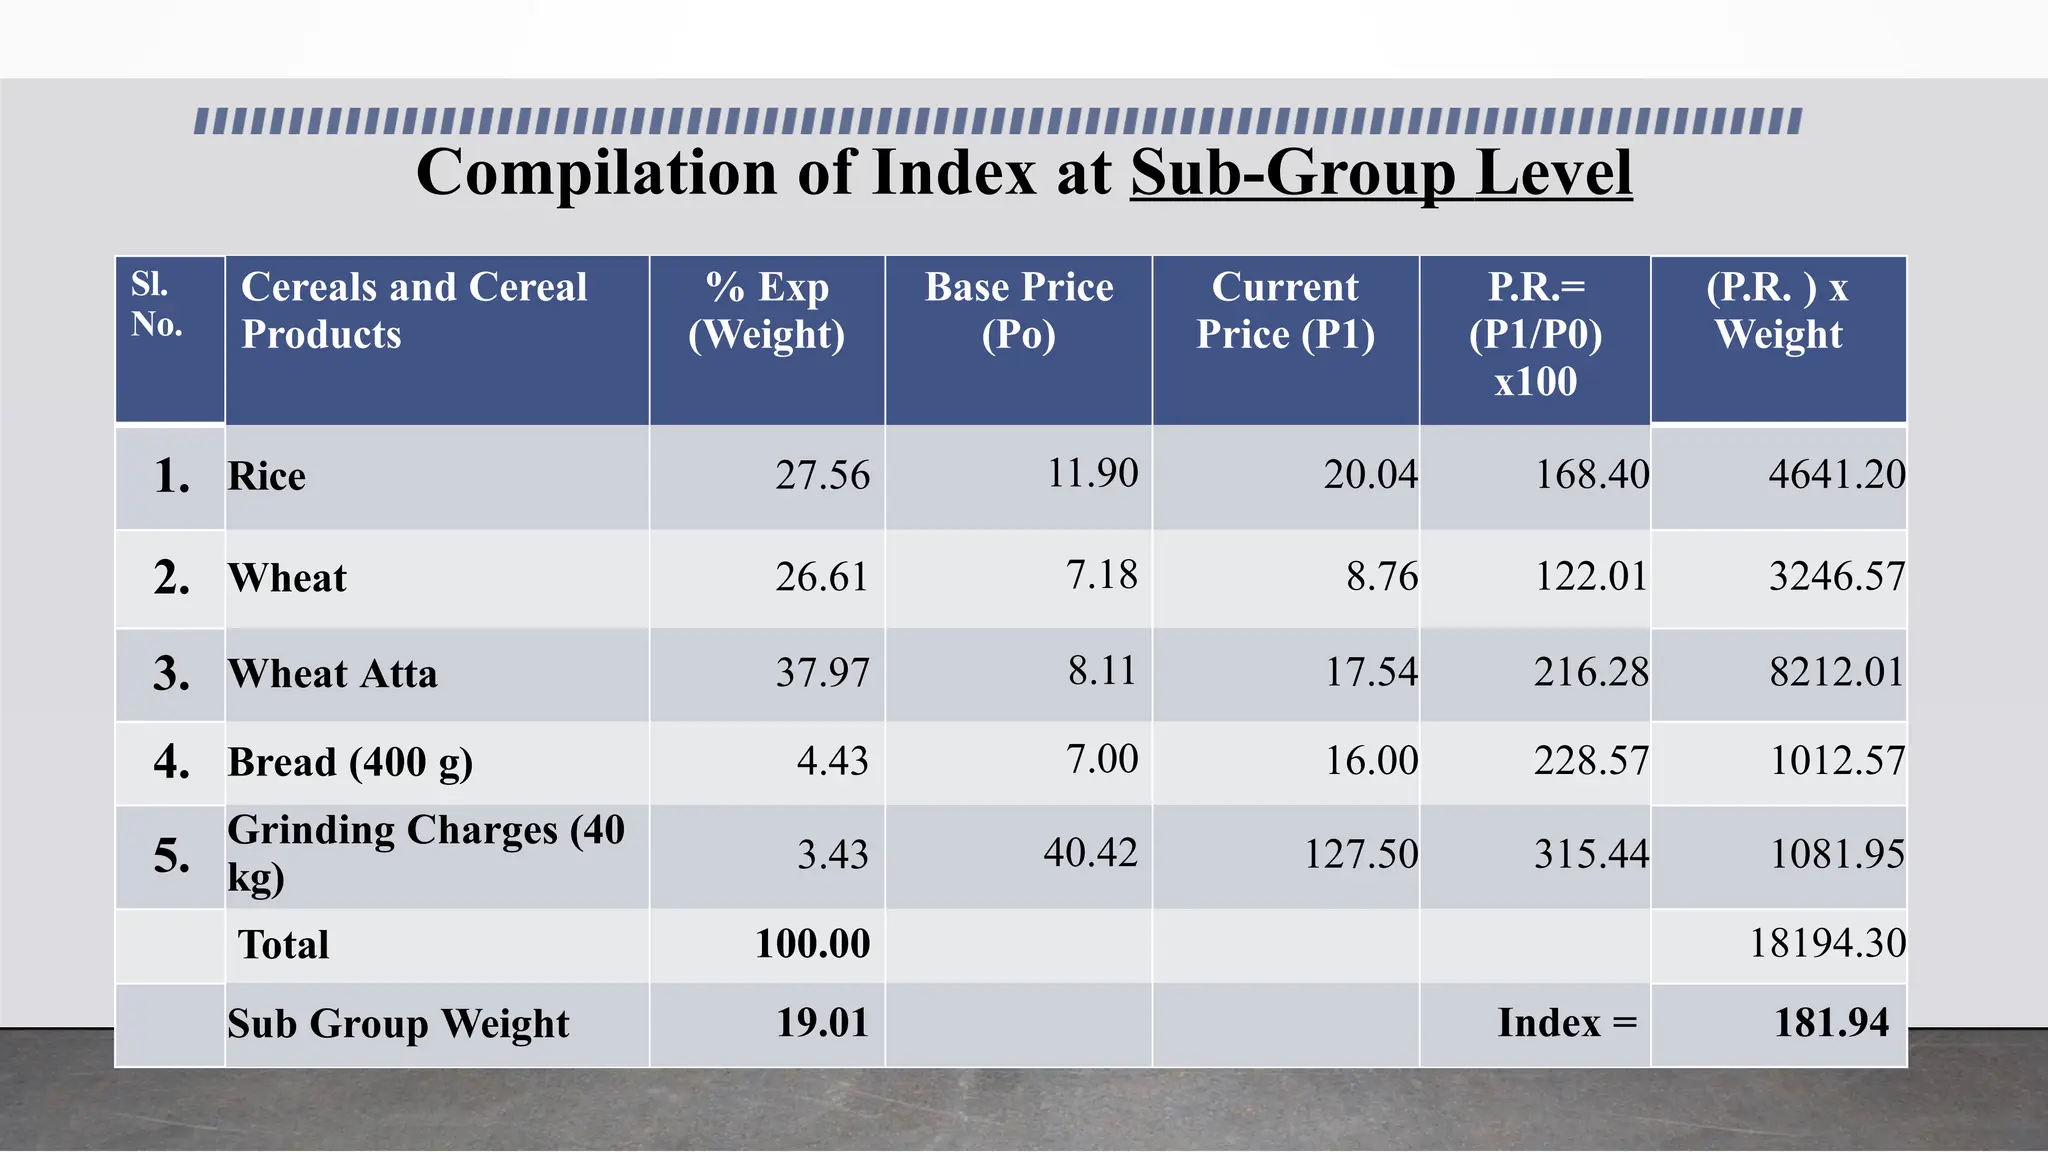
Compilation of Indexat Sub-Group Level
Sl.
No.
Cereals and Cereal
Products
% Exp
(Weight)
Base Price
(Po)
Current
Price (P1)
P.R.=
(P1/P0)
x100
(P.R. ) x
Weight
1. Rice 27.56 11.90 20.04 168.40 4641.20
2. Wheat 26.61 7.18 8.76 122.01 3246.57
3. Wheat Atta 37.97 8.11 17.54 216.28 8212.01
4. Bread (400 g) 4.43 7.00 16.00 228.57 1012.57
5.
Grinding Charges (40
kg)
3.43 40.42 127.50 315.44 1081.95
Total 100.00 18194.30
Sub Group Weight 19.01 Index = 181.94
86.
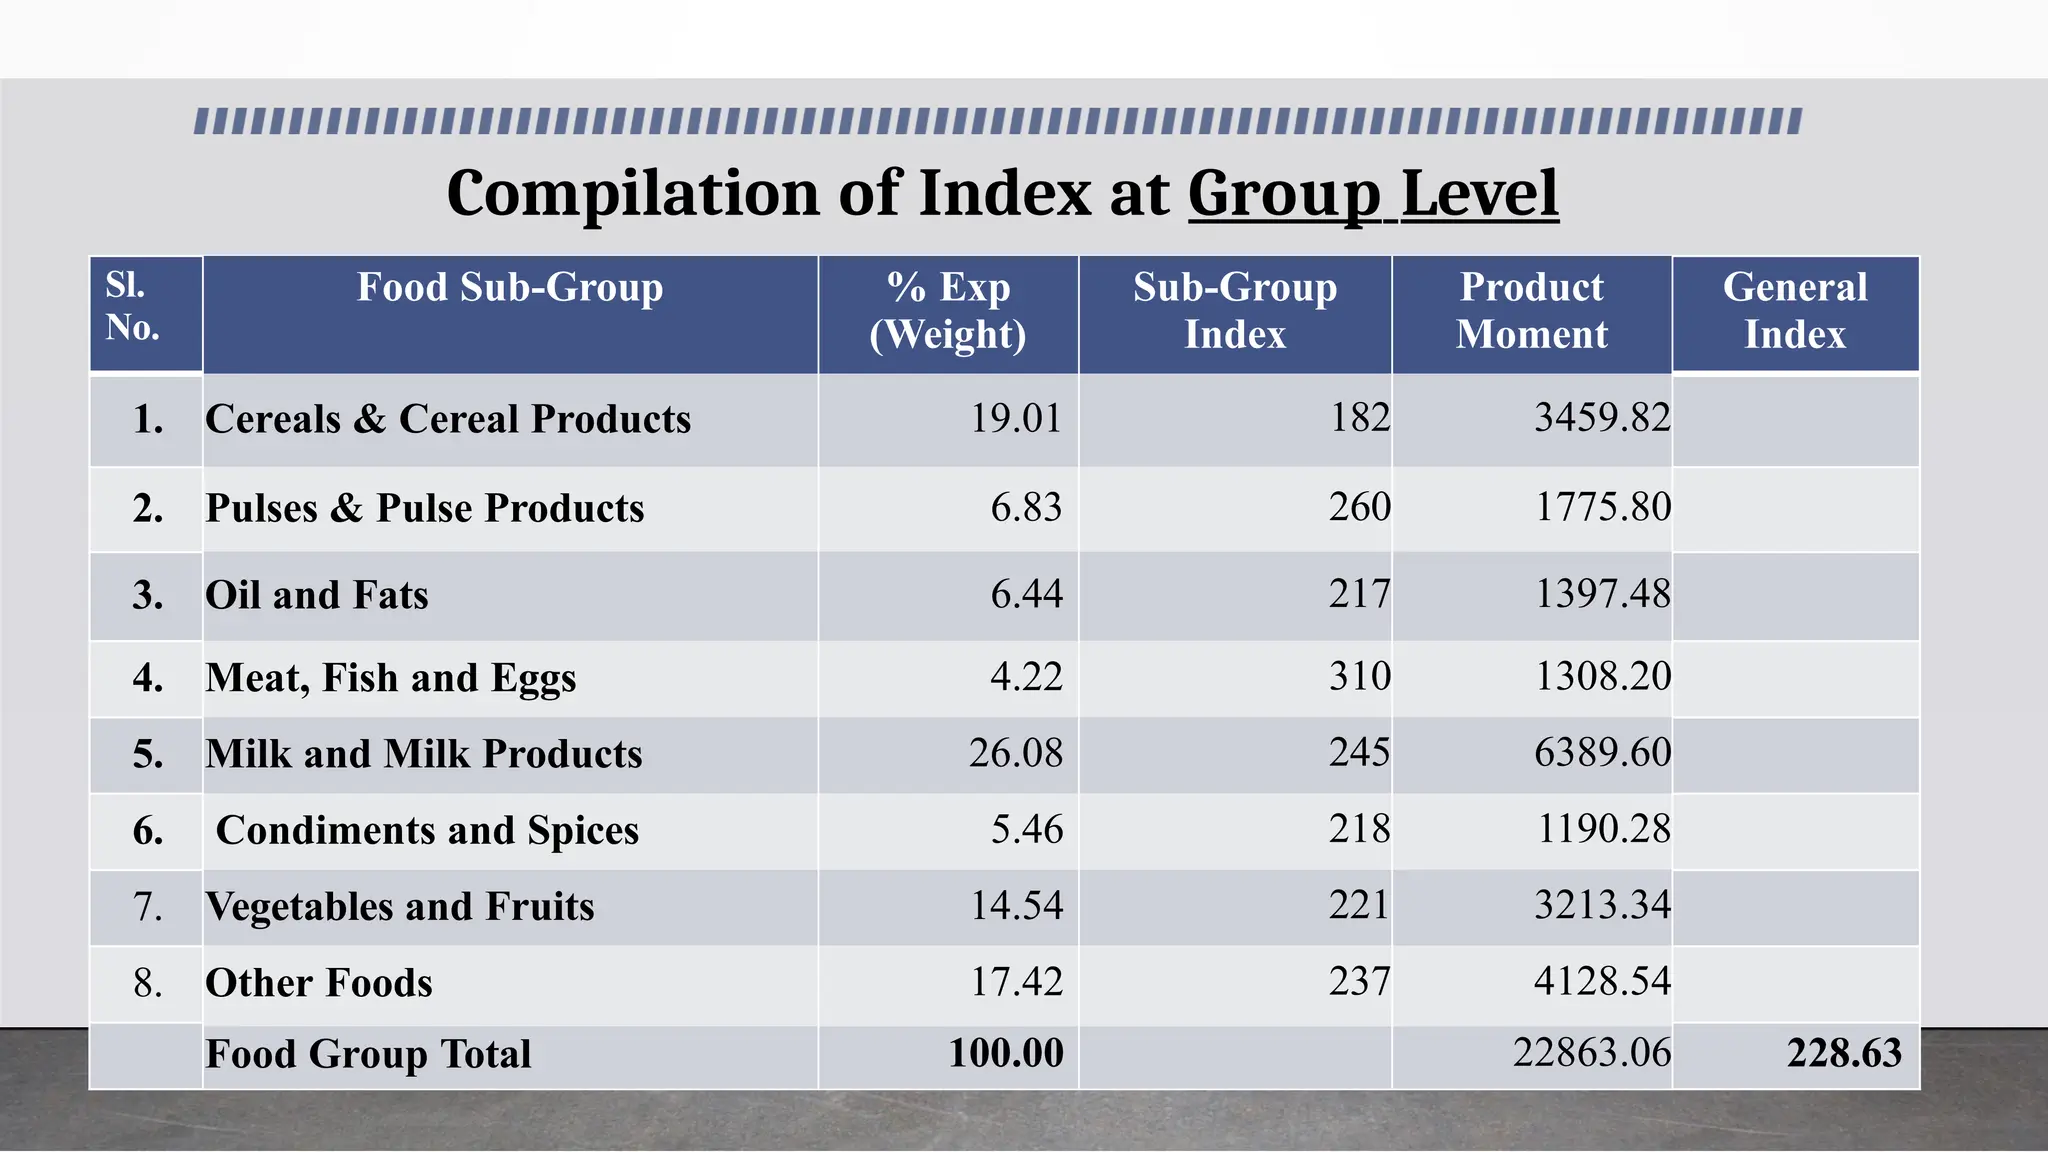
Compilation of Indexat Group Level
Sl.
No.
Food Sub-Group % Exp
(Weight)
Sub-Group
Index
Product
Moment
General
Index
1. Cereals & Cereal Products 19.01 182 3459.82
2. Pulses & Pulse Products 6.83 260 1775.80
3. Oil and Fats 6.44 217 1397.48
4. Meat, Fish and Eggs 4.22 310 1308.20
5. Milk and Milk Products 26.08 245 6389.60
6. Condiments and Spices 5.46 218 1190.28
7. Vegetables and Fruits 14.54 221 3213.34
8. Other Foods 17.42 237 4128.54
Food Group Total 100.00 22863.06 228.63
87.
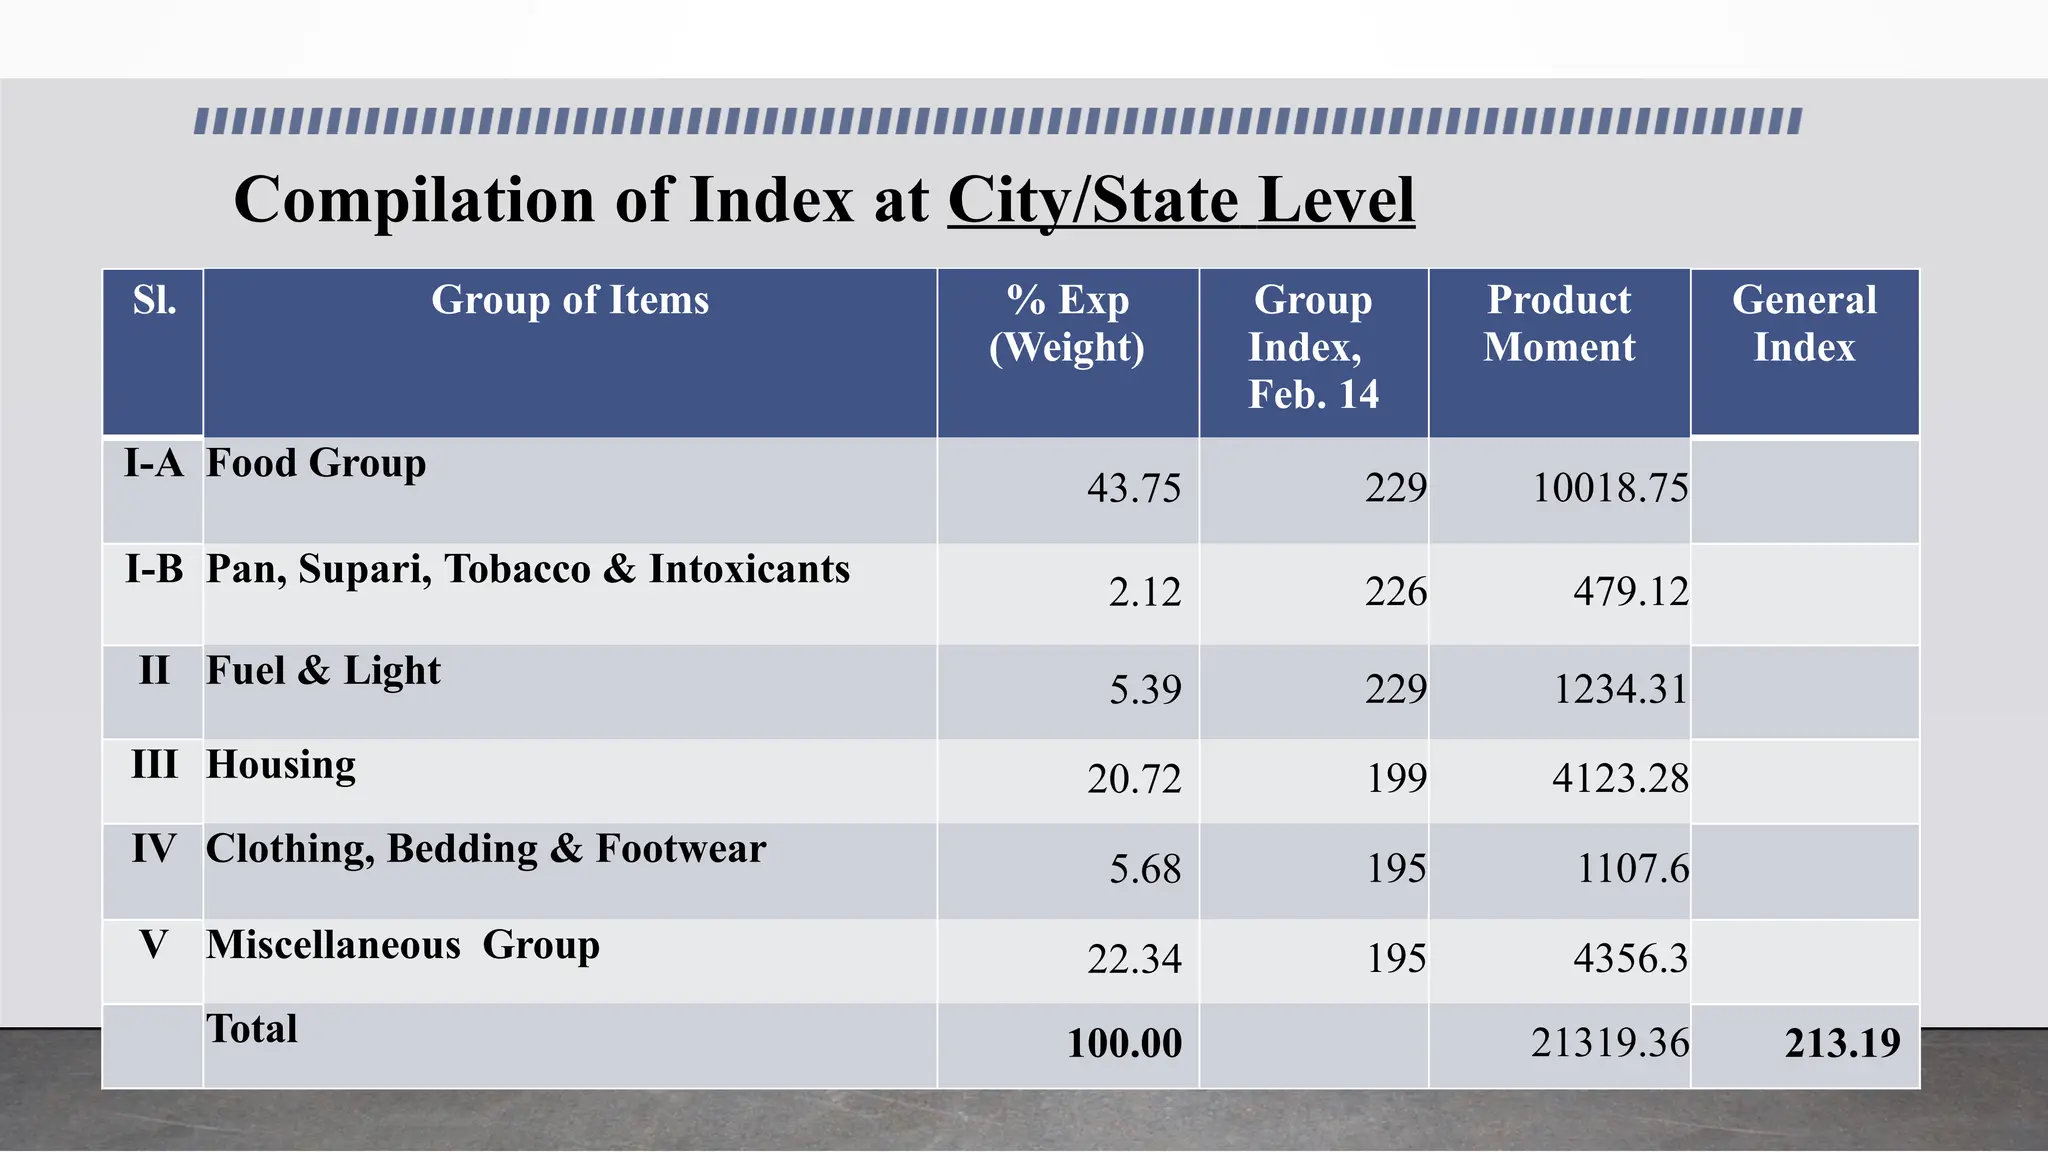
Compilation of Indexat City/State Level
Sl. Group of Items % Exp
(Weight)
Group
Index,
Feb. 14
Product
Moment
General
Index
I-A Food Group
43.75 229 10018.75
I-B Pan, Supari, Tobacco & Intoxicants
2.12 226 479.12
II Fuel & Light 5.39 229 1234.31
III Housing 20.72 199 4123.28
IV Clothing, Bedding & Footwear 5.68 195 1107.6
V Miscellaneous Group 22.34 195 4356.3
Total 100.00 21319.36 213.19
88.
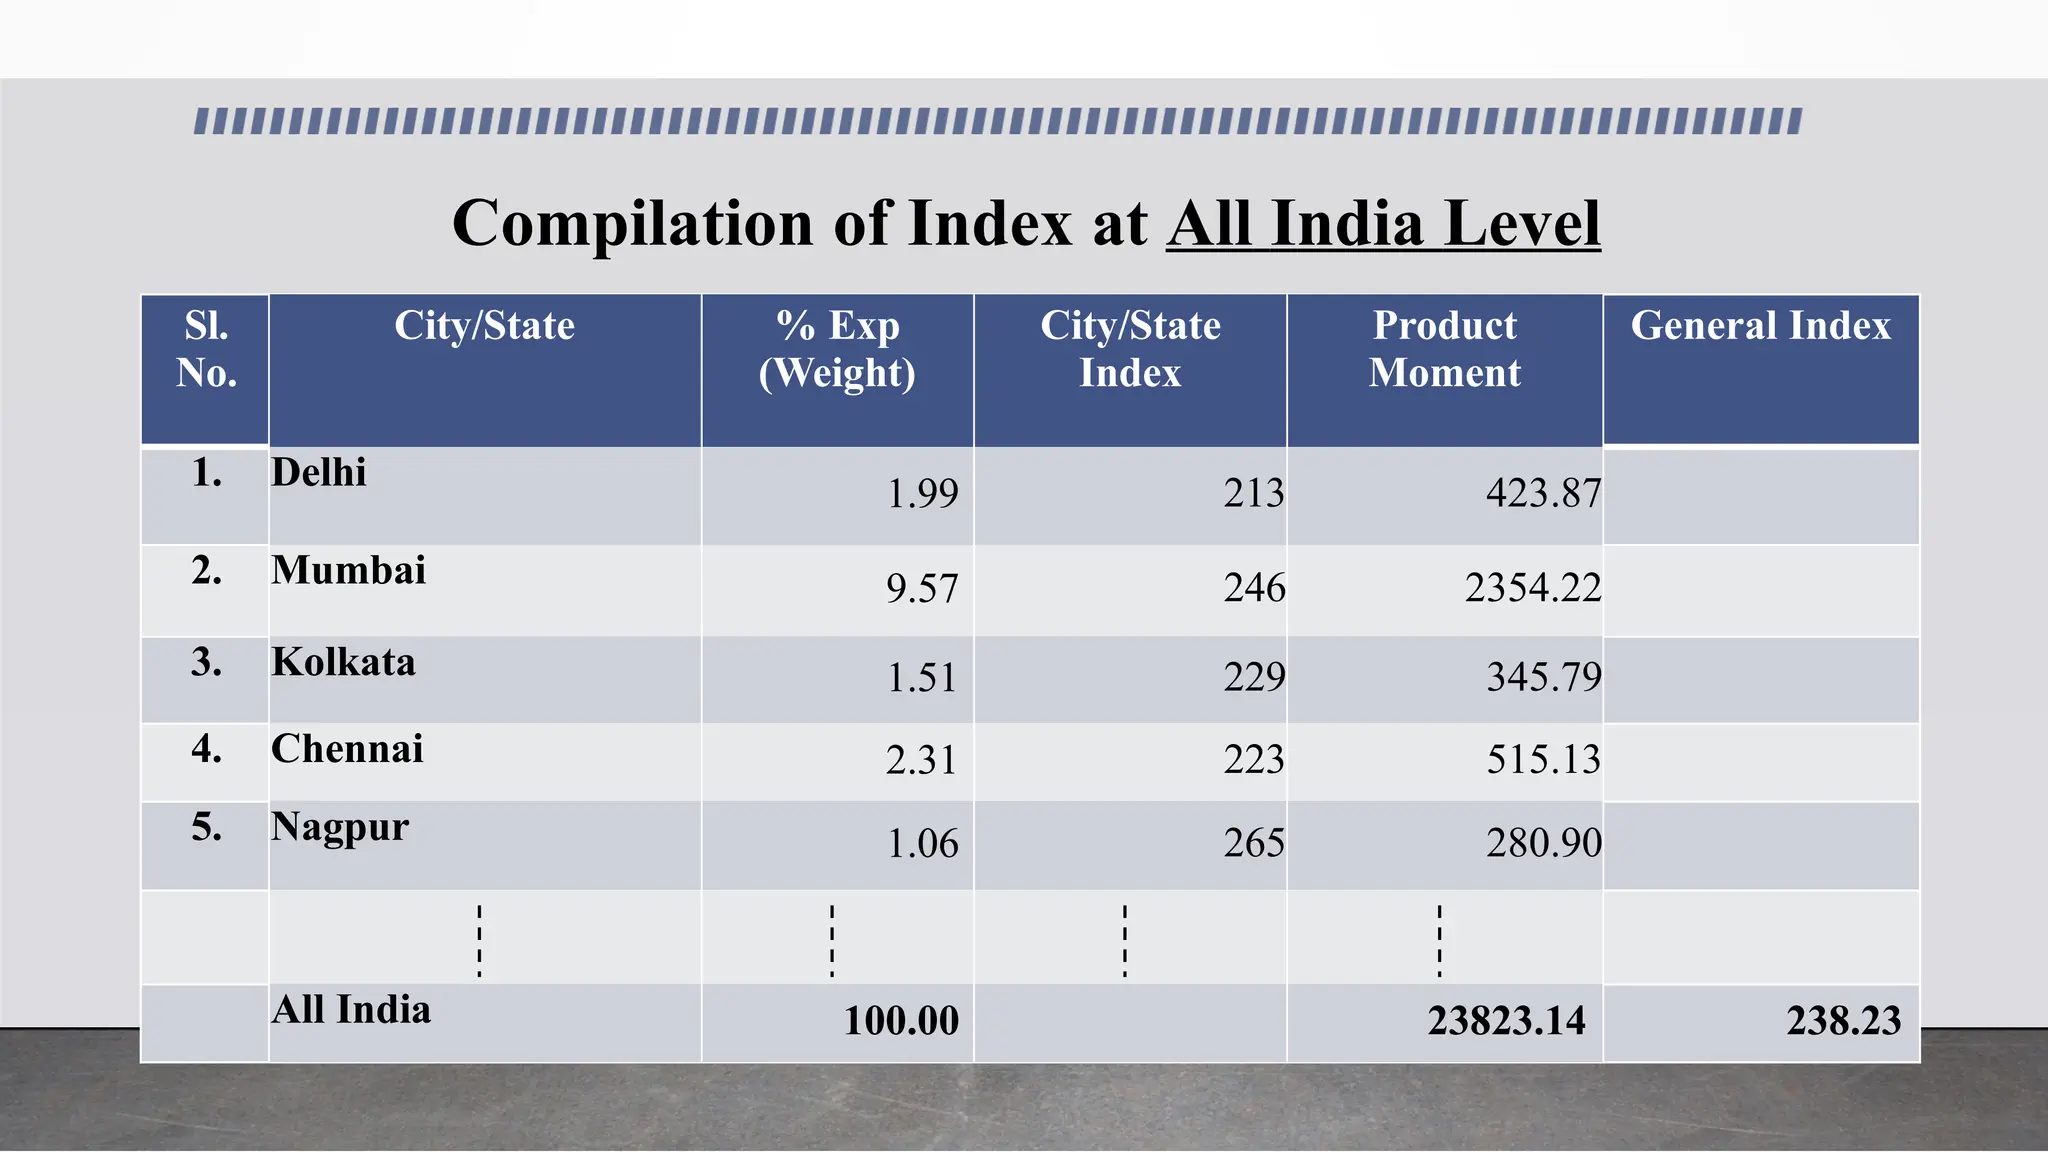
Compilation of Indexat All India Level
Sl.
No.
City/State % Exp
(Weight)
City/State
Index
Product
Moment
General Index
1. Delhi
1.99 213 423.87
2. Mumbai 9.57 246 2354.22
3. Kolkata 1.51 229 345.79
4. Chennai 2.31 223 515.13
5. Nagpur 1.06 265 280.90
All India 100.00 23823.14 238.23
Inflation
• Inflation isan increase in the price of a basket of goods and
services that is representative of segment of population or the
economy as a whole. Inflation is an upward movement in the
average level of prices. Its opposite is Deflation a downward
movement in the average level of prices. The boundary between
inflation and deflation is price stability.
• Inflation is a measure of rise in the general price level or
equivalently average level of prices of all the goods and services in
an economy. The general price level varies inversely with the
purchasing power of a unit of money, say one rupee.
91.
Inflation
• Unanticipated andexcessive inflation in the economy leads to
redistribution of wealth with no regard to social goals money,
consequently, widen the gap in wealth among different sections of
society.
• A macro-economic policy measure mostly used by the countries
across the world, to alleviate the adverse effects of inflation is
indexation. Indexation is the periodic adjustment of money-value
(e.g. wages, salaries, pension, rent, contract amount/charge/rate,
etc.) in relation to changes in a price index that reflects inflation.
The underlying principle of indexation is to enable the society to
live with inflation in such a way that no individual or group suffers
disproportionately.
92.
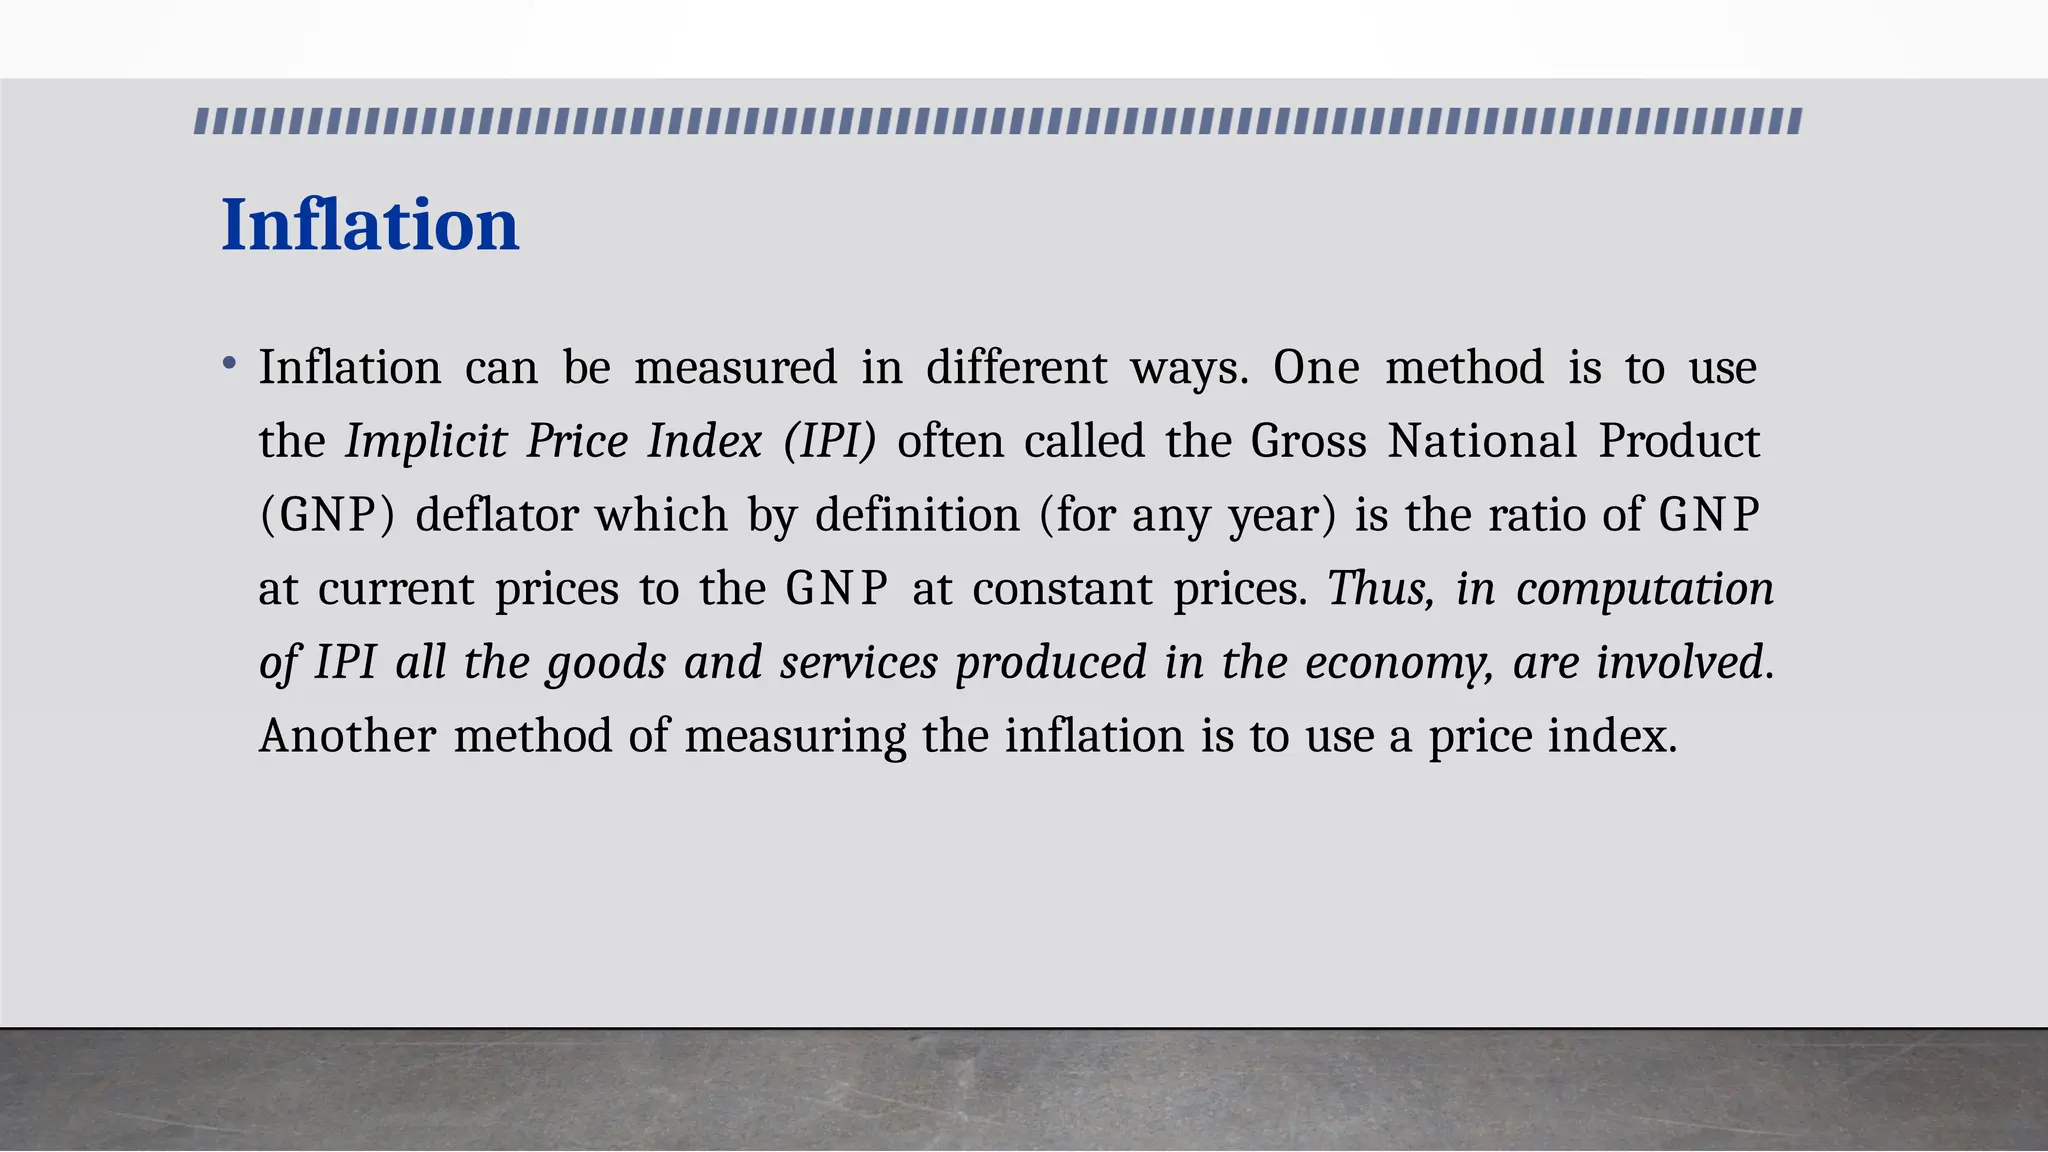
Inflation
• Inflation canbe measured in different ways. One method is to use
the Implicit Price Index (IPI) often called the Gross National Product
(GNP) deflator which by definition (for any year) is the ratio of GNP
at current prices to the GNP at constant prices. Thus, in computation
of IPI all the goods and services produced in the economy, are involved.
Another method of measuring the inflation is to use a price index.
93.
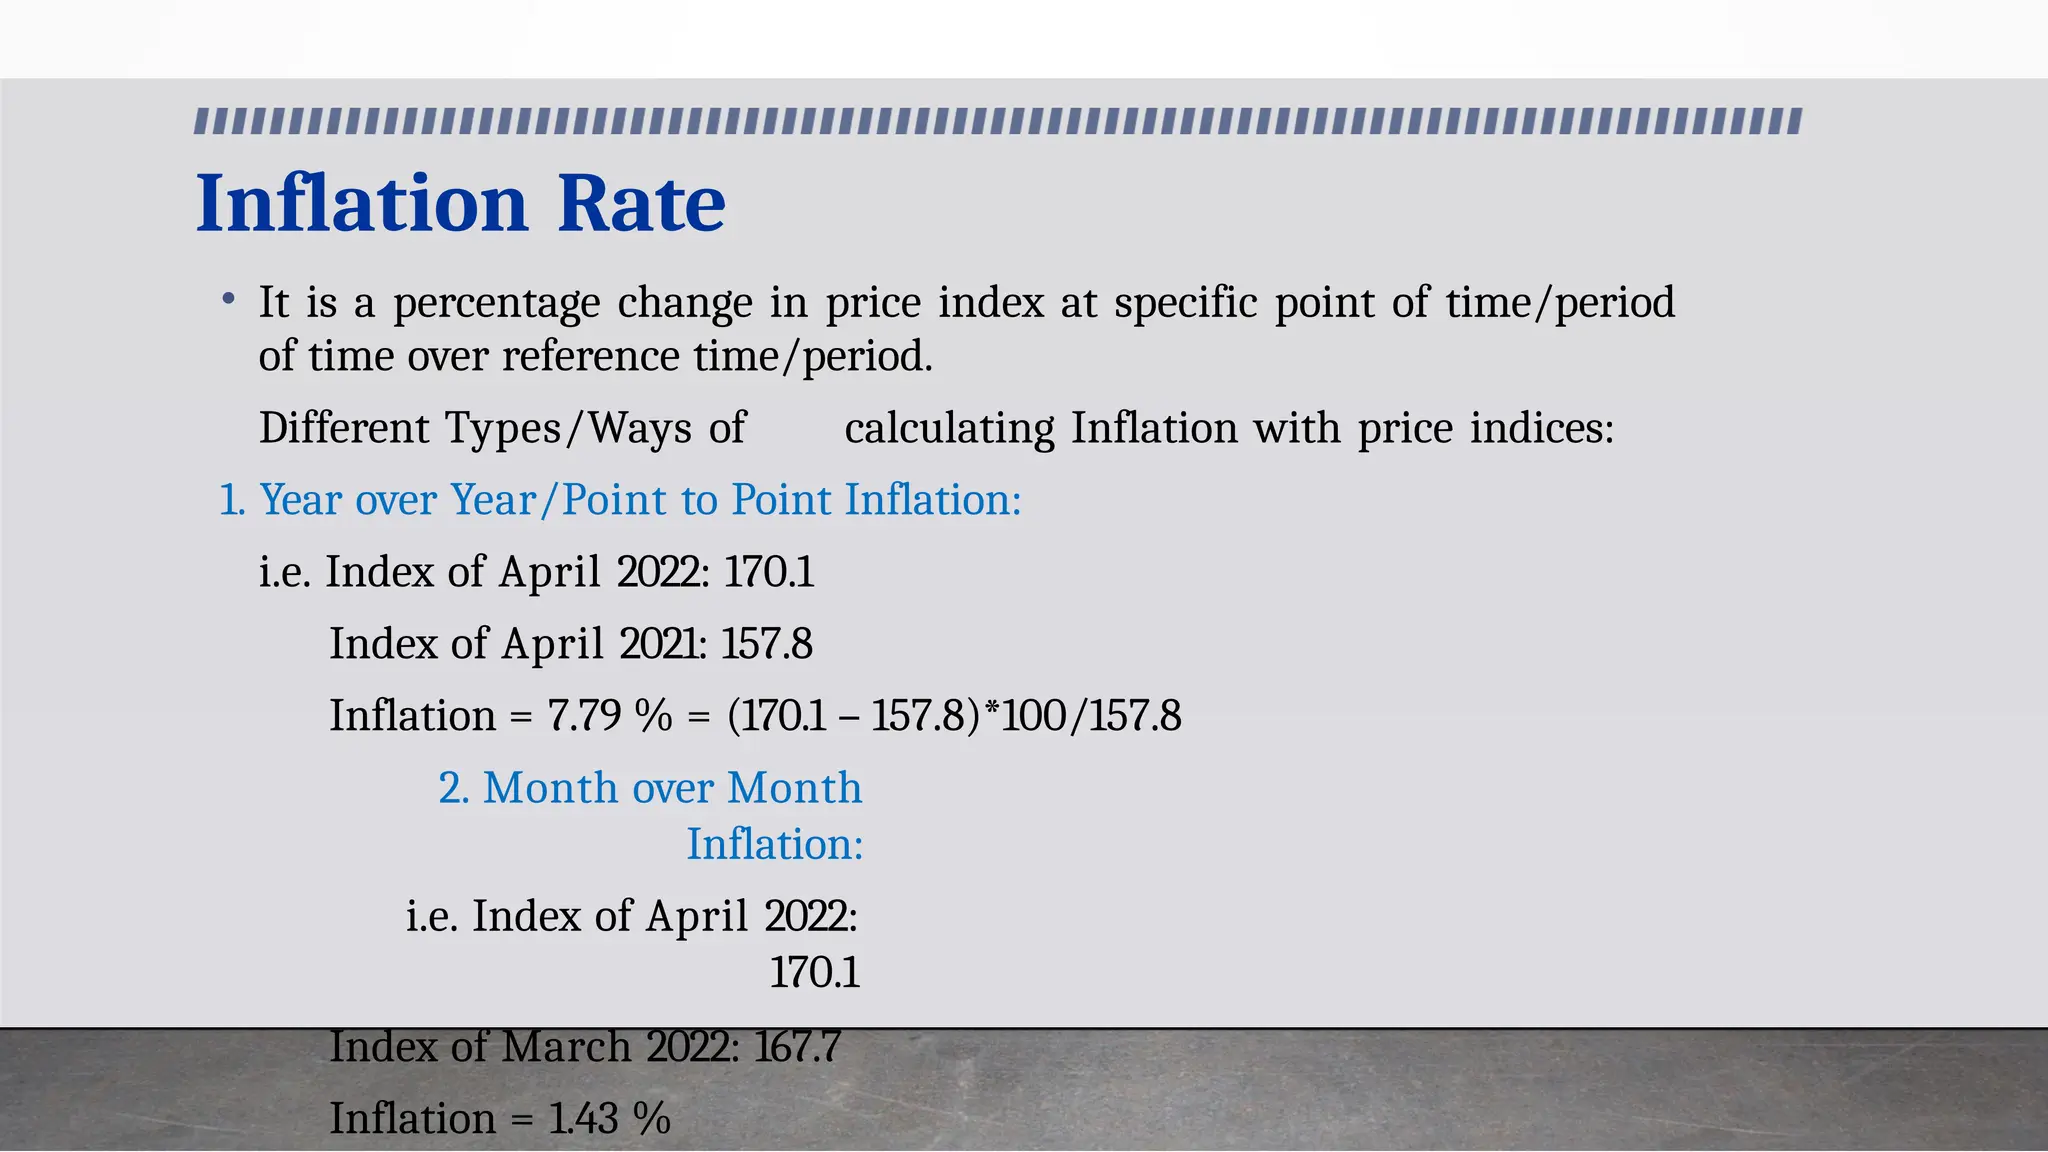
Inflation Rate
• Itis a percentage change in price index at specific point of time/period
of time over reference time/period.
Different Types/Ways of calculating Inflation with price indices:
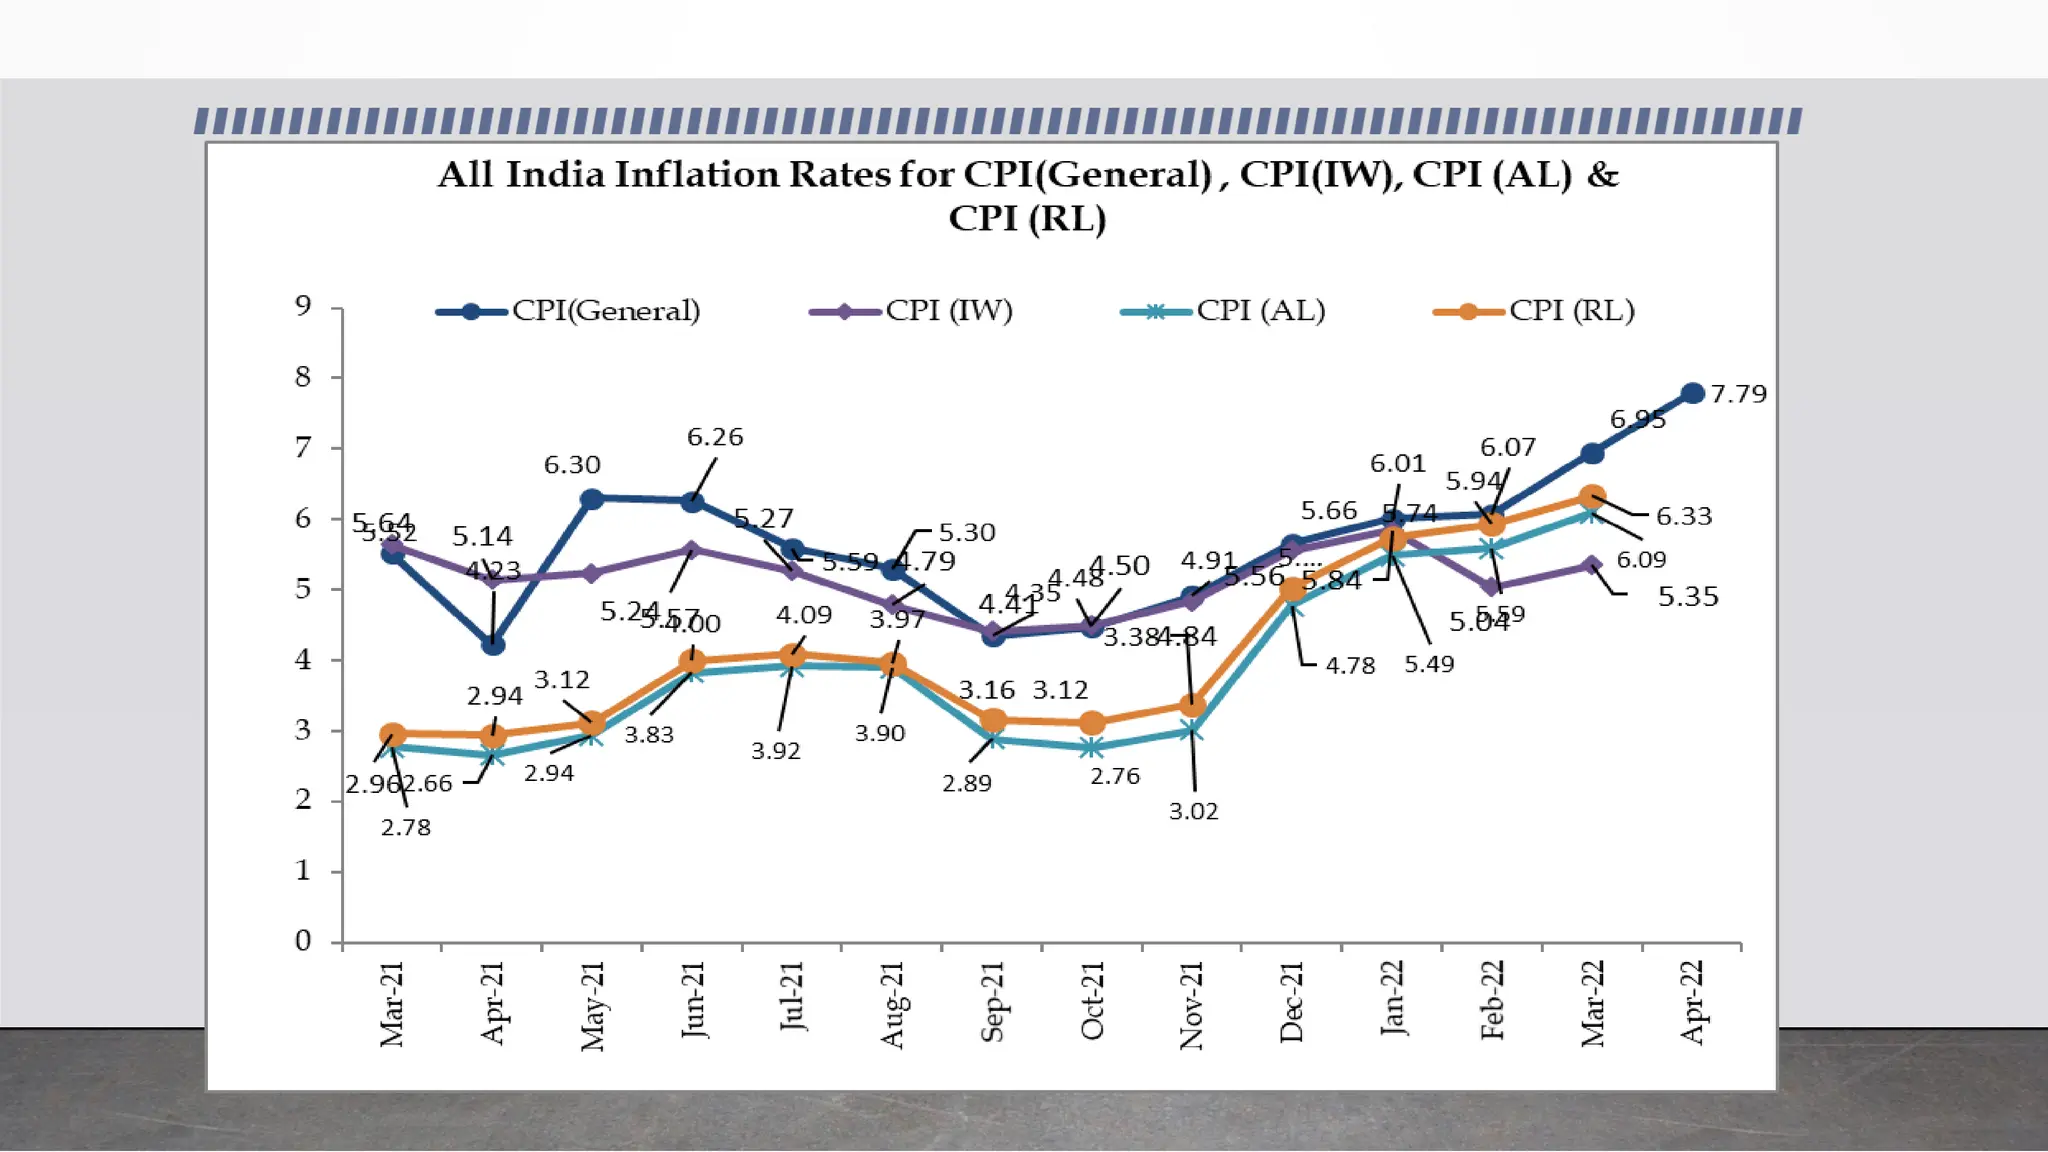
1. Year over Year/Point to Point Inflation:
i.e. Index of April 2022: 170.1
Index of April 2021: 157.8
Inflation = 7.79 % = (170.1 – 157.8)*100/157.8
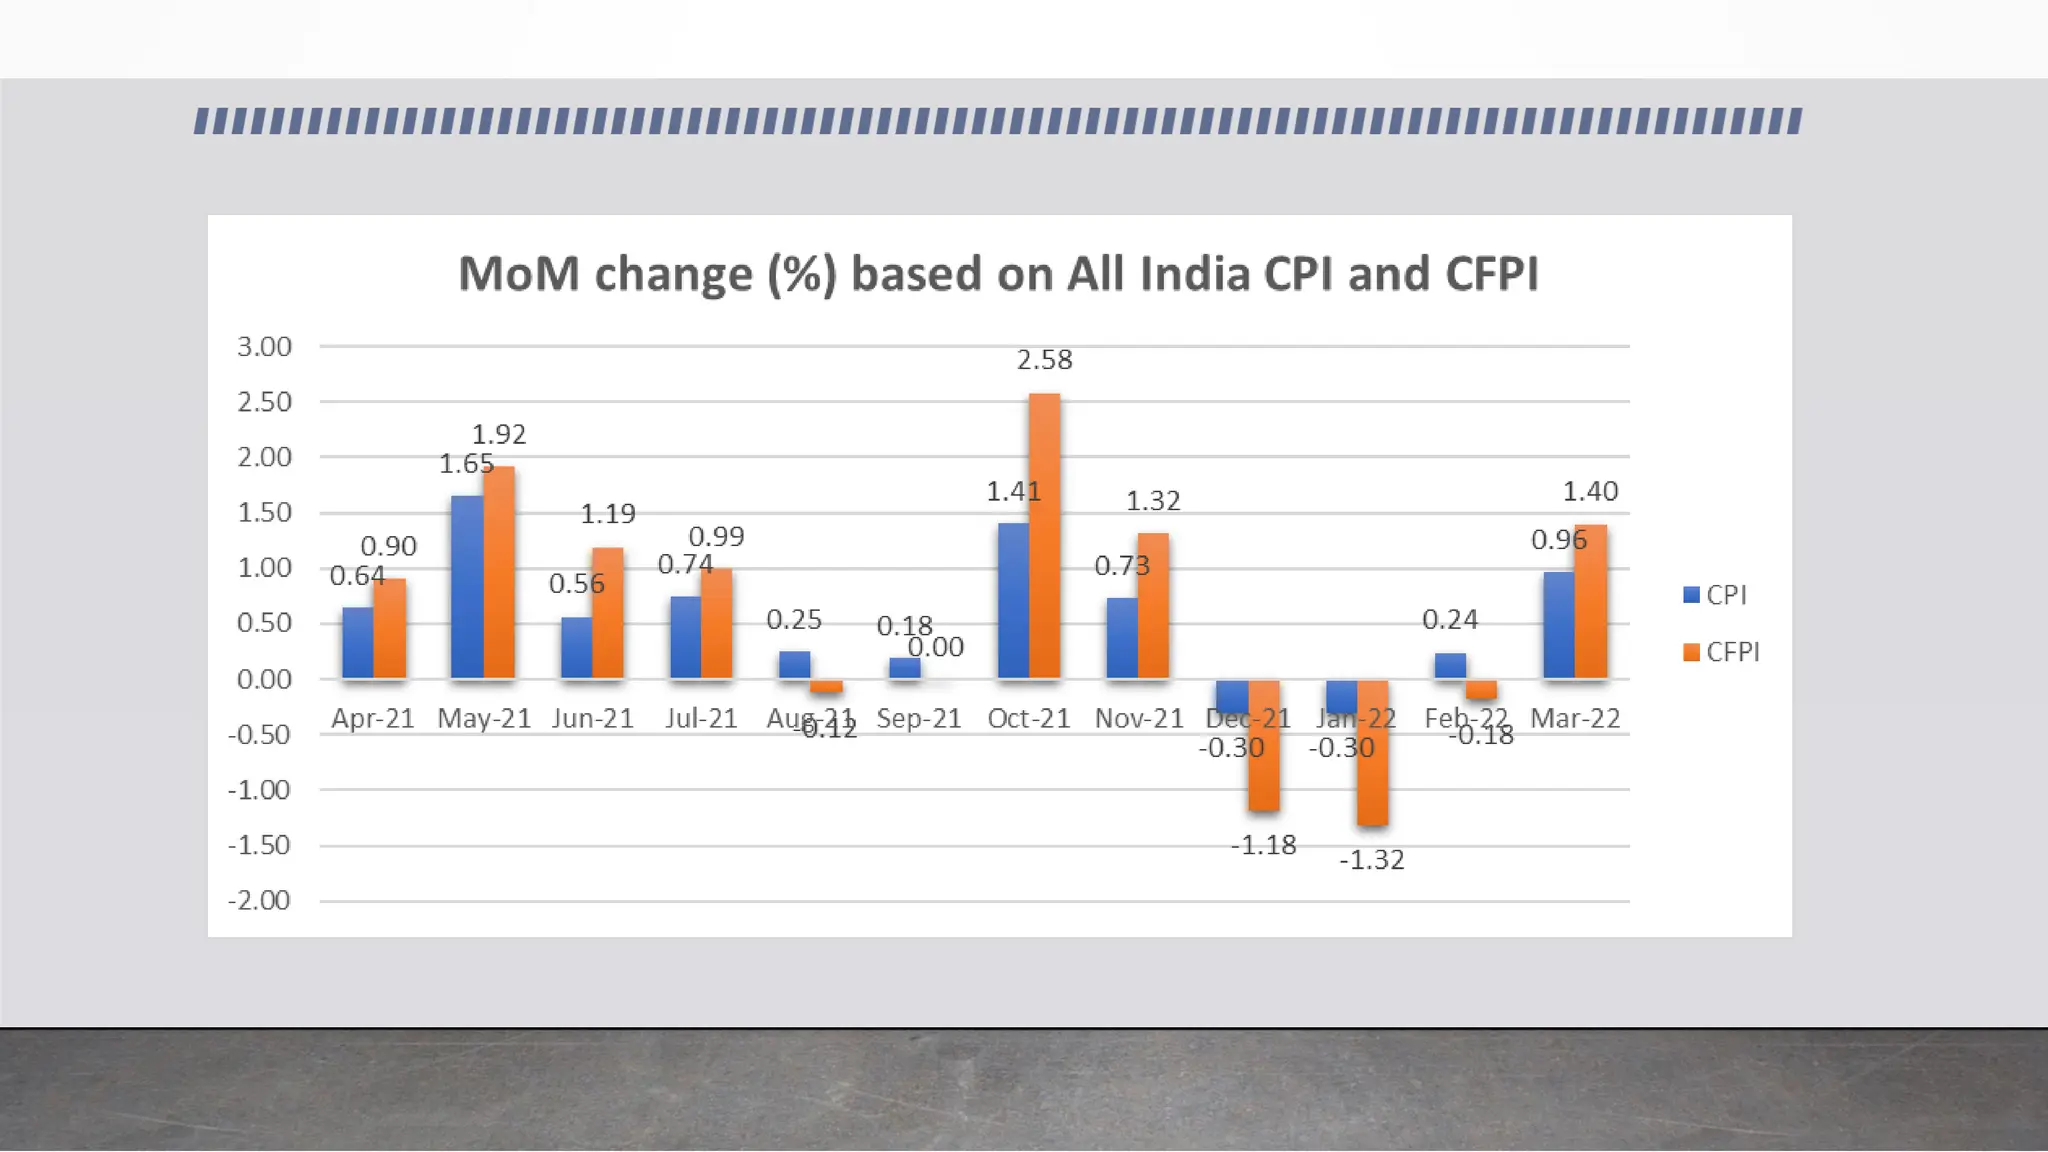
2. Month over Month
Inflation:
i.e. Index of April 2022:
170.1
Index of March 2022: 167.7
Inflation = 1.43 %
94.
Inflation
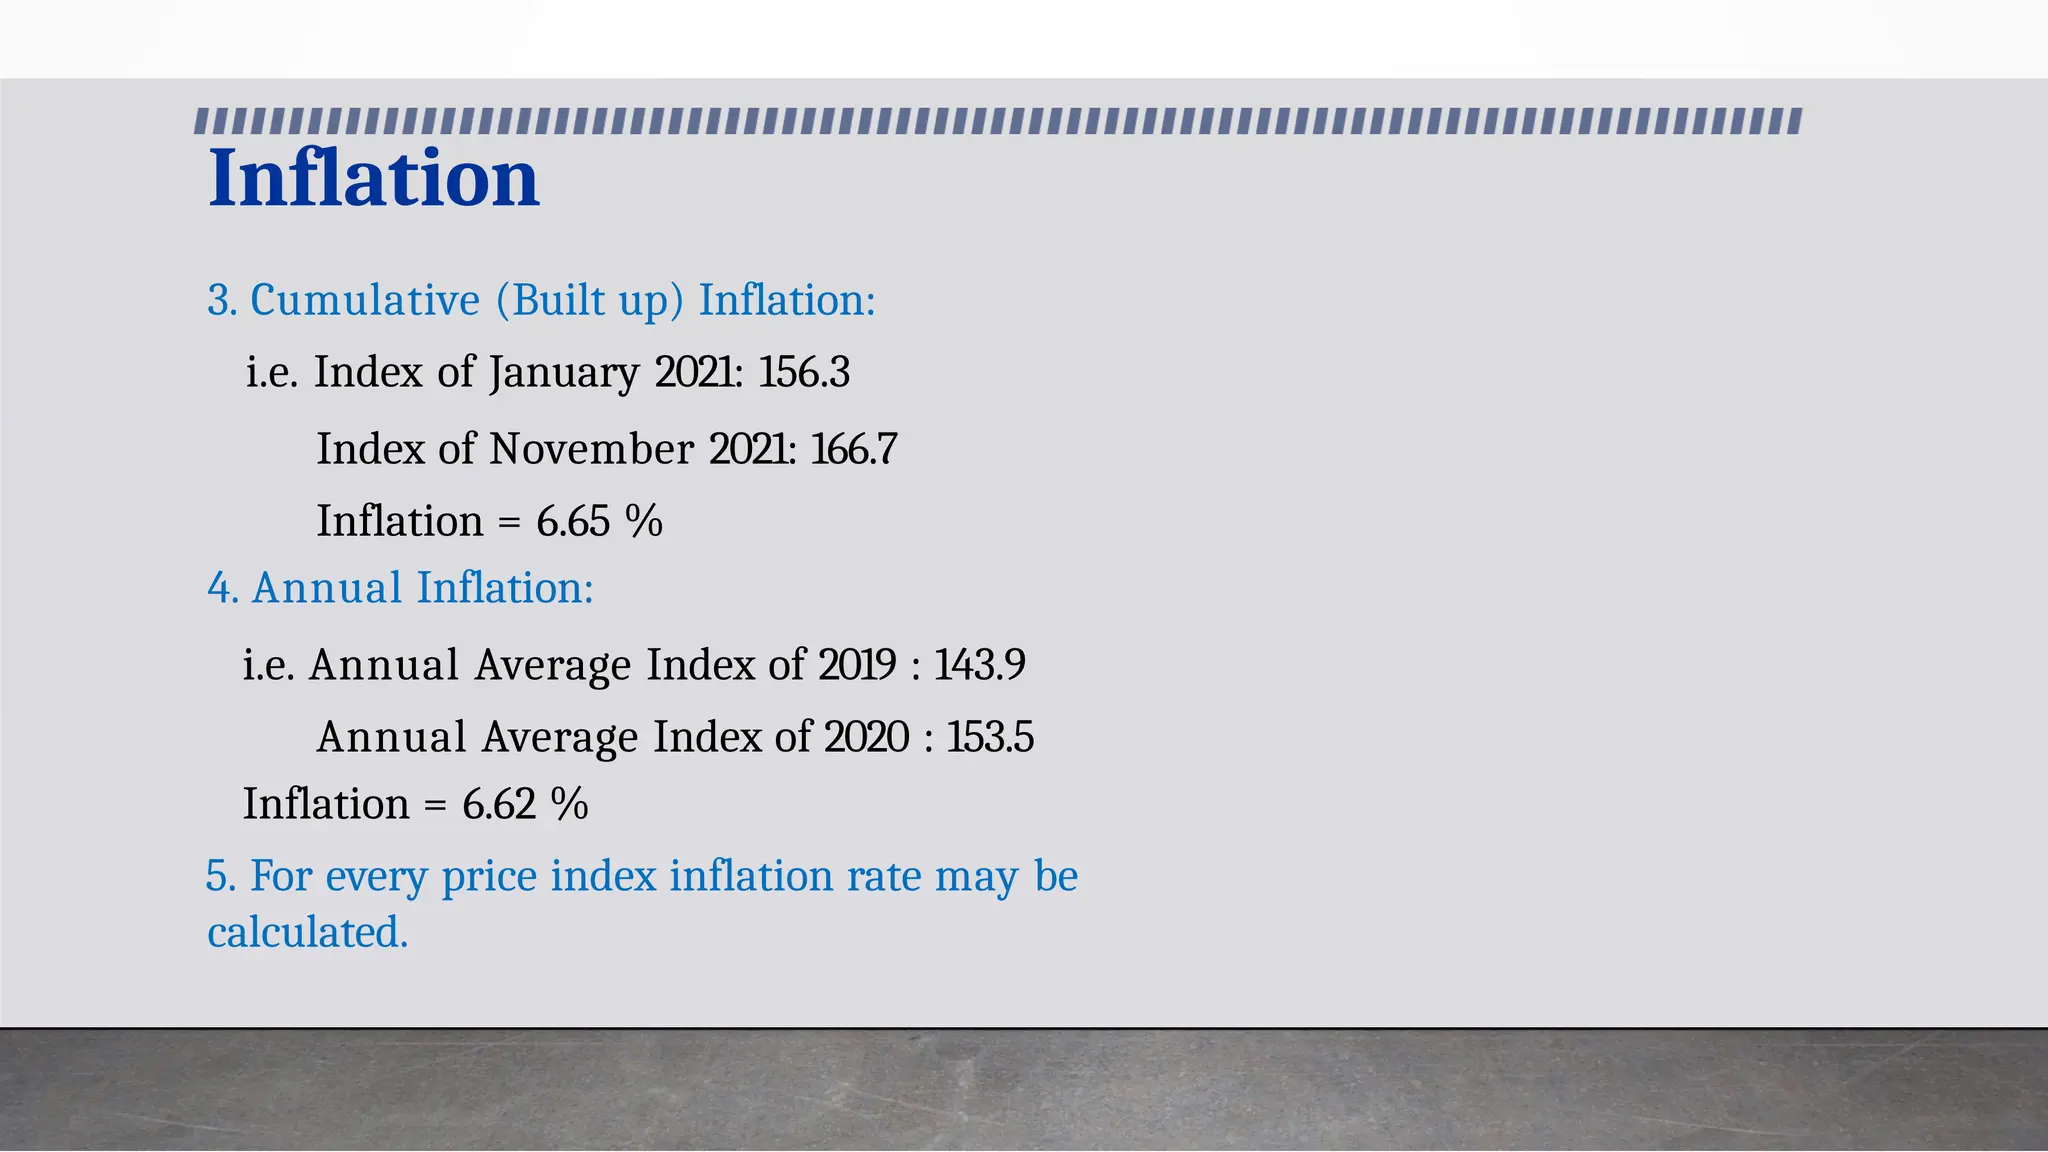
3. Cumulative (Builtup) Inflation:
i.e. Index of January 2021: 156.3
Index of November 2021: 166.7
Inflation = 6.65 %
4. Annual Inflation:
i.e. Annual Average Index of 2019 : 143.9
Annual Average Index of 2020 : 153.5
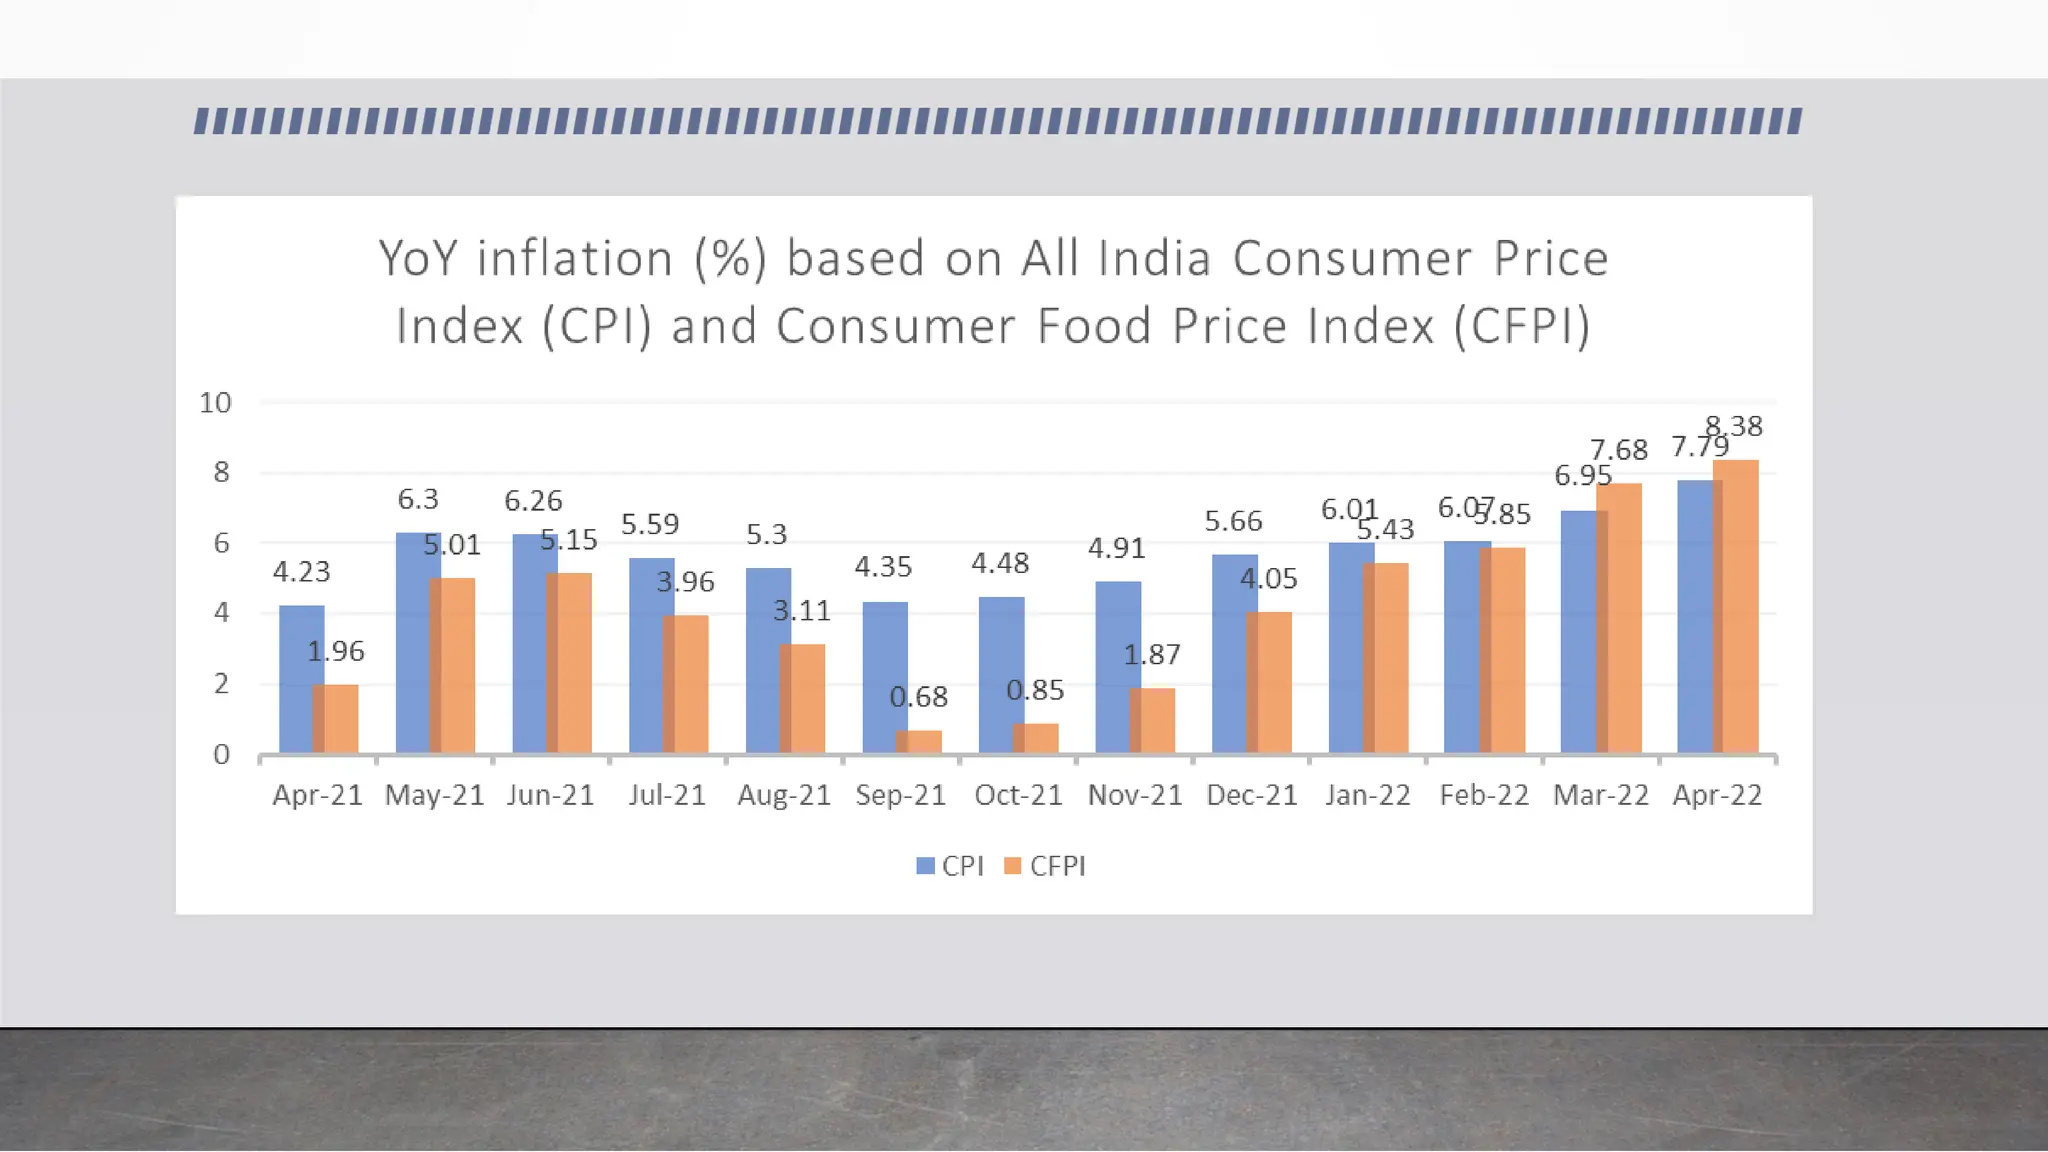
Inflation = 6.62 %
5. For every price index inflation rate may be
calculated.
95.
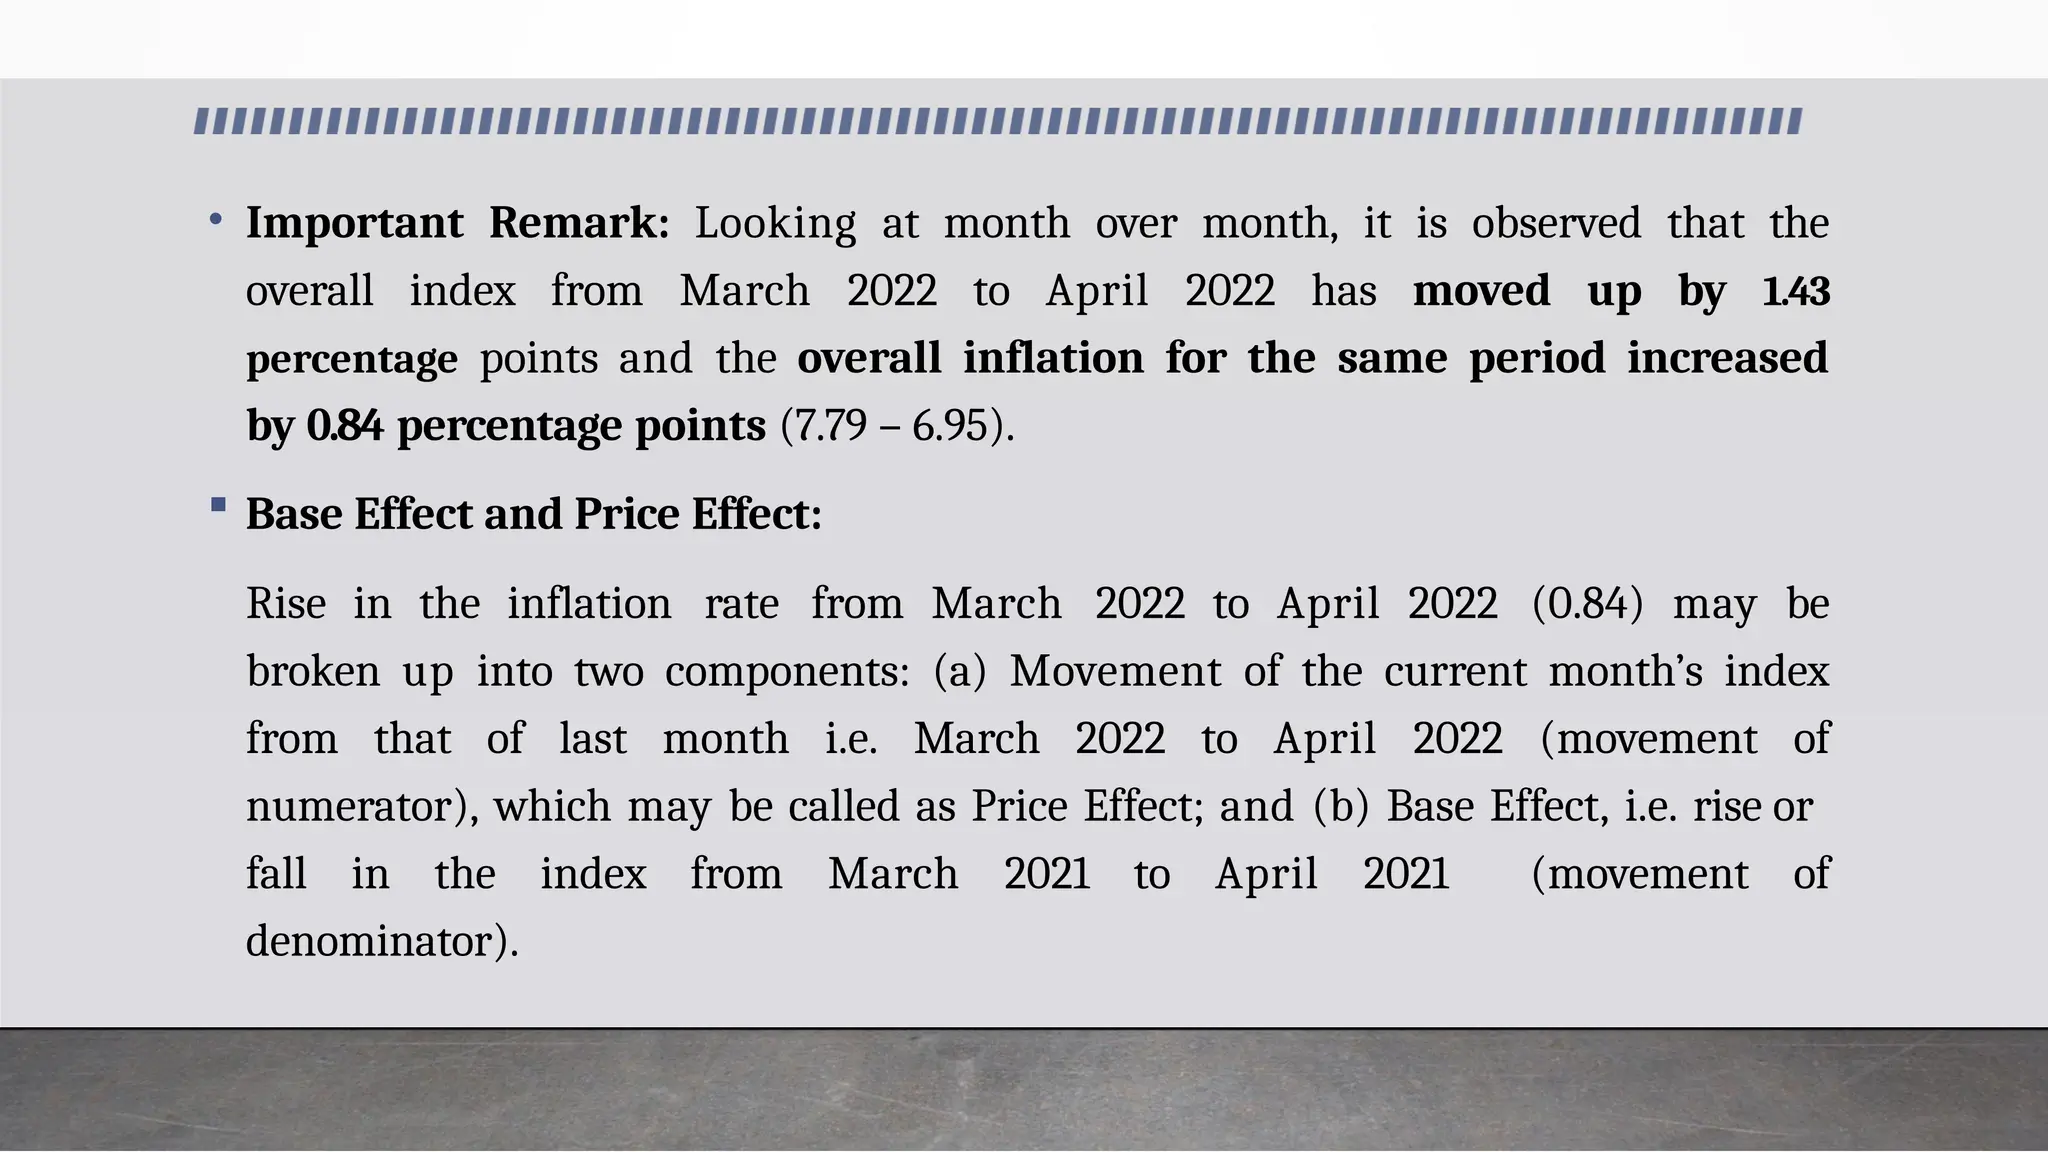
• Important Remark:Looking at month over month, it is observed that the
overall index from March 2022 to April 2022 has moved up by 1.43
percentage points and the overall inflation for the same period increased
by 0.84 percentage points (7.79 – 6.95).
Base Effect and Price Effect:
Rise in the inflation rate from March 2022 to April 2022 (0.84) may be
broken up into two components: (a) Movement of the current month’s index
from that of last month i.e. March 2022 to April 2022 (movement of
numerator), which may be called as Price Effect; and (b) Base Effect, i.e. rise or
fall in the index from March 2021 to April 2021 (movement of
denominator).
96.
Inflation of Mar22 = [(Index of Mar 22/Index of Mar 21)-1] x 100
Inflation of Apr 22 = [(Index of Apr 22/Index of Apr 21)-1] x 100.
Difference = {[(Index of Mar 22/Index of Mar 21)-1] - [(Index of Apr
22/Index of Apr 21)-1]} x 100
= [(Mar 22/Mar 21) - (Mar 22/Apr 21)] + [(Mar 22/Apr 21) - (Apr 22/Apr 21)]
= Base Effect + Price Effect
Base Effect and Price Effect:
97.
After decomposing therise in inflation rate (0.84), we find that the Price
Effect is 1.52 percentage points and the Base Effect is -0.68 percentage
points. Thus, change in overall inflation rate from March 2021 to April
2021 is 0.84 percentage points [0.84= (1.52) + (-0.68)]
Base Effect and Price Effect:
![Chain Index Numbers
In this method, the comparison are not made with fixed base, the base
changes from year to year. For example, for 2018, 2017 will be the base and
for 2019, 2018 will be base, and so on.
Chain Index for current year = [(Average link relative of current year)
x (Chain Index for previous year)]/100 i.e.
100
0 2
p1
LR1 2
p 2 100
L R 1 2 C I P 0 1 , where
CI P](https://image.slidesharecdn.com/khanenterprisespresentation-250316113657-4f17e6d9/75/Introduction-to-Index-Numbers-in-Conceptual-Approach-pptx-31-2048.jpg)
![Conversion of Chain Index to Fixed Base Index
• Current Year F.B.I. = (Chain Index for current
year) x (Fixed Base Index for previous year)]/100 i.e.
100
02
FBIP
CI P12FBIP01
](https://image.slidesharecdn.com/khanenterprisespresentation-250316113657-4f17e6d9/75/Introduction-to-Index-Numbers-in-Conceptual-Approach-pptx-32-2048.jpg)

![Inflation of Mar 22 = [(Index of Mar 22/Index of Mar 21)-1] x 100
Inflation of Apr 22 = [(Index of Apr 22/Index of Apr 21)-1] x 100.
Difference = {[(Index of Mar 22/Index of Mar 21)-1] - [(Index of Apr
22/Index of Apr 21)-1]} x 100
= [(Mar 22/Mar 21) - (Mar 22/Apr 21)] + [(Mar 22/Apr 21) - (Apr 22/Apr 21)]
= Base Effect + Price Effect
Base Effect and Price Effect:](https://image.slidesharecdn.com/khanenterprisespresentation-250316113657-4f17e6d9/75/Introduction-to-Index-Numbers-in-Conceptual-Approach-pptx-96-2048.jpg)
![After decomposing the rise in inflation rate (0.84), we find that the Price
Effect is 1.52 percentage points and the Base Effect is -0.68 percentage
points. Thus, change in overall inflation rate from March 2021 to April
2021 is 0.84 percentage points [0.84= (1.52) + (-0.68)]
Base Effect and Price Effect:](https://image.slidesharecdn.com/khanenterprisespresentation-250316113657-4f17e6d9/75/Introduction-to-Index-Numbers-in-Conceptual-Approach-pptx-97-2048.jpg)


![Module1_IndexNumbers and the use of it[1].pptx](https://cdn.slidesharecdn.com/ss_thumbnails/module1indexnumbers1-250406102019-aab2f565-thumbnail.jpg?width=640&height=640&fit=bounds)


