Download as PDF, PPTX
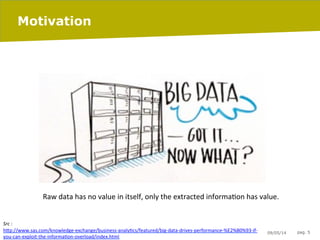
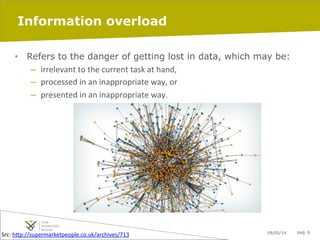
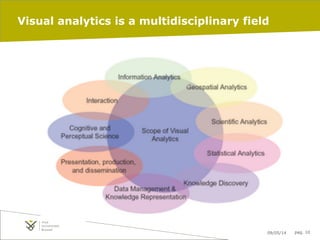
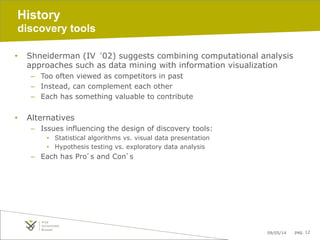
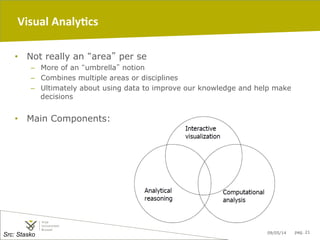
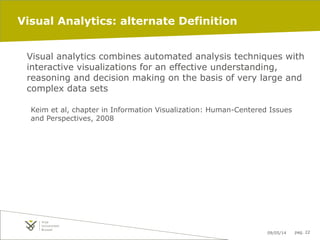
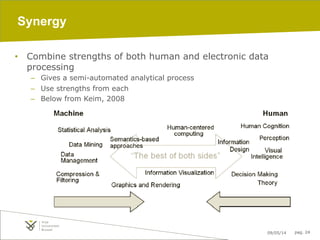

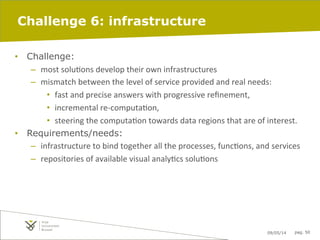

This document provides an overview of visual analytics as presented in a lecture. It discusses the motivation and goals of visual analytics, which aims to facilitate analytical reasoning through interactive visual interfaces. This is done by combining automated analysis techniques with interactive visualizations. The document outlines the history and development of visual analytics as a field, provides examples of challenges and applications, and discusses key aspects of the visual analytics process such as linking multiple views, temporal views, and labeling.


