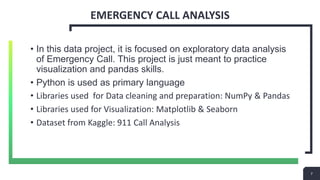
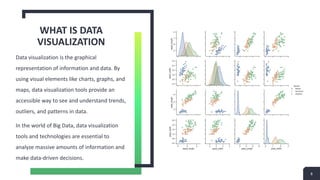
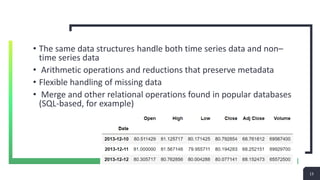
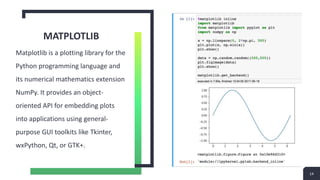
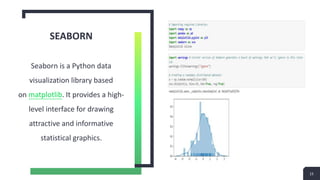
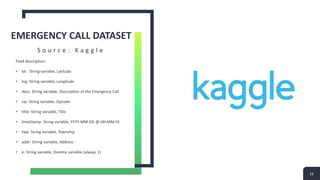
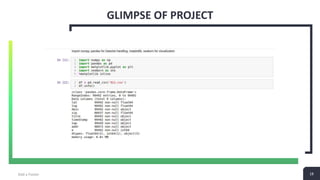
INTERNSHIP
PRESENTATION
S H U B H A M S H R I V A S T A V A
I T 4 t h Y E A R
INTERNSHIP
SITE
Add a Footer 2
BHARAT ELECTRONICS LIMITED
G h a z i a b a d
Bharat Electronics Limited is an Indian state-owned
aerospace and defense company with about nine factories,
and several regional offices in India. It is owned by the
Indian Government and primarily manufactures advanced
electronic products for the Indian Armed Forces.
The second largest Unit at Ghaziabad was set up in 1974 to
manufacture special types of radar for the Air Defense
Ground Environment Systems (Plan ADGES).
3
SOME PRODUCTS
• Border Surveillance System
• Coastal Surveillance System
• Akash Missile System
• Electronic Voter Machine and VVPAT
• Weapon Locating Radar
• Night Vision Devices
• Low level Light-Weight Radar
• Integrated Electronic Warfare System
• Doppler Weather Radar
4
<REDACTED>
<REDACTED>
Project Guide/Mentor:
• <Redacted>
• <Redacted>
Add a Footer 5
PROJECT
UNDERTAKEN:
EMERGENCY
CALL ANALYSIS
( D A T A V I S U A L I Z A T I O N )
6
77
EMERGENCY CALL ANALYSIS
• In this data project, it is focused on exploratory data analysis
of Emergency Call. This project is just meant to practice
visualization and pandas skills.
• Python is used as primary language
• Libraries used for Data cleaning and preparation: NumPy & Pandas
• Libraries used for Visualization: Matplotlib & Seaborn
• Dataset from Kaggle: 911 Call Analysis
WHAT IS DATA
VISUALIZATION
Data visualization is the graphical
representation of information and data. By
using visual elements like charts, graphs, and
maps, data visualization tools provide an
accessible way to see and understand trends,
outliers, and patterns in data.
In the world of Big Data, data visualization
tools and technologies are essential to
analyze massive amounts of information and
make data-driven decisions.
8
99
WHY PYTHON AS PRIMARY LANGUAGE?
Data analysis and interactive computing and data visualization,
Python will inevitably draw comparisons with other open source and
commercial programming languages and tools in wide use, such as R,
MATLAB, SAS, Stata, and others. In recent years, Python’s improved
support for libraries (such as pandas and Scikit-learn) has made it a
popular choice for data analysis tasks. Combined with Python’s
overall strength for general-purpose software engineering, it is an
excellent option as a primary language for building data applications.
1010
NUMPY
NumPy is a Python package. It stands for 'Numerical Python'. It is a
library consisting of multidimensional array objects and a collection
of routines for processing of array.
1111
• A fast and efficient multidimensional array object ndarray
• Functions for performing element-wise computations with arrays
or mathematical operations between arrays
• Tools for reading and writing array-based datasets to disk
• Linear algebra operations, Fourier transform, and random number
generation
• A mature C API to enable Python extensions and native C or C++
code to access
1212
PANDAS
pandas provides high-level data structures and functions
designed to make working with structured or tabular data
fast, easy, and expressive. Since its emergence in 2010, it has
helped enable Python to be a powerful and productive data
analysis environment. The primary objects is the DataFrame,
a tabular, column-oriented data structure with both row and
column labels, and the Series, a one-dimensional labeled
array object.
1313
• The same data structures handle both time series data and non–
time series data
• Arithmetic operations and reductions that preserve metadata
• Flexible handling of missing data
• Merge and other relational operations found in popular databases
(SQL-based, for example)
MATPLOTLIB
Matplotlib is a plotting library for the
Python programming language and
its numerical mathematics extension
NumPy. It provides an object-
oriented API for embedding plots
into applications using general-
purpose GUI toolkits like Tkinter,
wxPython, Qt, or GTK+.
14
SEABORN
Seaborn is a Python data
visualization library based
on matplotlib. It provides a high-
level interface for drawing
attractive and informative
statistical graphics.
15
EMERGENCY CALL DATASET
Field description:
• lat : String variable, Latitude
• lng: String variable, Longitude
• desc: String variable, Description of the Emergency Call
• zip: String variable, Zipcode
• title: String variable, Title
• timeStamp: String variable, YYYY-MM-DD @ HH:MM:SS
• twp: String variable, Township
• addr: String variable, Address
• e: String variable, Dummy variable (always 1)
S o u r c e : K a g g l e
16
1717
18Add a Footer 18
GLIMPSE OF PROJECT
1919
2020
THANK YOU
21

Data Visualization Project Presentation

  • 1.
    INTERNSHIP PRESENTATION S H UB H A M S H R I V A S T A V A I T 4 t h Y E A R
  • 2.
  • 3.
    BHARAT ELECTRONICS LIMITED Gh a z i a b a d Bharat Electronics Limited is an Indian state-owned aerospace and defense company with about nine factories, and several regional offices in India. It is owned by the Indian Government and primarily manufactures advanced electronic products for the Indian Armed Forces. The second largest Unit at Ghaziabad was set up in 1974 to manufacture special types of radar for the Air Defense Ground Environment Systems (Plan ADGES). 3
  • 4.
    SOME PRODUCTS • BorderSurveillance System • Coastal Surveillance System • Akash Missile System • Electronic Voter Machine and VVPAT • Weapon Locating Radar • Night Vision Devices • Low level Light-Weight Radar • Integrated Electronic Warfare System • Doppler Weather Radar 4
  • 5.
  • 6.
    PROJECT UNDERTAKEN: EMERGENCY CALL ANALYSIS ( DA T A V I S U A L I Z A T I O N ) 6
  • 7.
    77 EMERGENCY CALL ANALYSIS •In this data project, it is focused on exploratory data analysis of Emergency Call. This project is just meant to practice visualization and pandas skills. • Python is used as primary language • Libraries used for Data cleaning and preparation: NumPy & Pandas • Libraries used for Visualization: Matplotlib & Seaborn • Dataset from Kaggle: 911 Call Analysis
  • 8.
    WHAT IS DATA VISUALIZATION Datavisualization is the graphical representation of information and data. By using visual elements like charts, graphs, and maps, data visualization tools provide an accessible way to see and understand trends, outliers, and patterns in data. In the world of Big Data, data visualization tools and technologies are essential to analyze massive amounts of information and make data-driven decisions. 8
  • 9.
    99 WHY PYTHON ASPRIMARY LANGUAGE? Data analysis and interactive computing and data visualization, Python will inevitably draw comparisons with other open source and commercial programming languages and tools in wide use, such as R, MATLAB, SAS, Stata, and others. In recent years, Python’s improved support for libraries (such as pandas and Scikit-learn) has made it a popular choice for data analysis tasks. Combined with Python’s overall strength for general-purpose software engineering, it is an excellent option as a primary language for building data applications.
  • 10.
    1010 NUMPY NumPy is aPython package. It stands for 'Numerical Python'. It is a library consisting of multidimensional array objects and a collection of routines for processing of array.
  • 11.
    1111 • A fastand efficient multidimensional array object ndarray • Functions for performing element-wise computations with arrays or mathematical operations between arrays • Tools for reading and writing array-based datasets to disk • Linear algebra operations, Fourier transform, and random number generation • A mature C API to enable Python extensions and native C or C++ code to access
  • 12.
    1212 PANDAS pandas provides high-leveldata structures and functions designed to make working with structured or tabular data fast, easy, and expressive. Since its emergence in 2010, it has helped enable Python to be a powerful and productive data analysis environment. The primary objects is the DataFrame, a tabular, column-oriented data structure with both row and column labels, and the Series, a one-dimensional labeled array object.
  • 13.
    1313 • The samedata structures handle both time series data and non– time series data • Arithmetic operations and reductions that preserve metadata • Flexible handling of missing data • Merge and other relational operations found in popular databases (SQL-based, for example)
  • 14.
    MATPLOTLIB Matplotlib is aplotting library for the Python programming language and its numerical mathematics extension NumPy. It provides an object- oriented API for embedding plots into applications using general- purpose GUI toolkits like Tkinter, wxPython, Qt, or GTK+. 14
  • 15.
    SEABORN Seaborn is aPython data visualization library based on matplotlib. It provides a high- level interface for drawing attractive and informative statistical graphics. 15
  • 16.
    EMERGENCY CALL DATASET Fielddescription: • lat : String variable, Latitude • lng: String variable, Longitude • desc: String variable, Description of the Emergency Call • zip: String variable, Zipcode • title: String variable, Title • timeStamp: String variable, YYYY-MM-DD @ HH:MM:SS • twp: String variable, Township • addr: String variable, Address • e: String variable, Dummy variable (always 1) S o u r c e : K a g g l e 16
  • 17.
  • 18.
    18Add a Footer18 GLIMPSE OF PROJECT
  • 19.
  • 20.
  • 21.