Download as PDF, PPTX

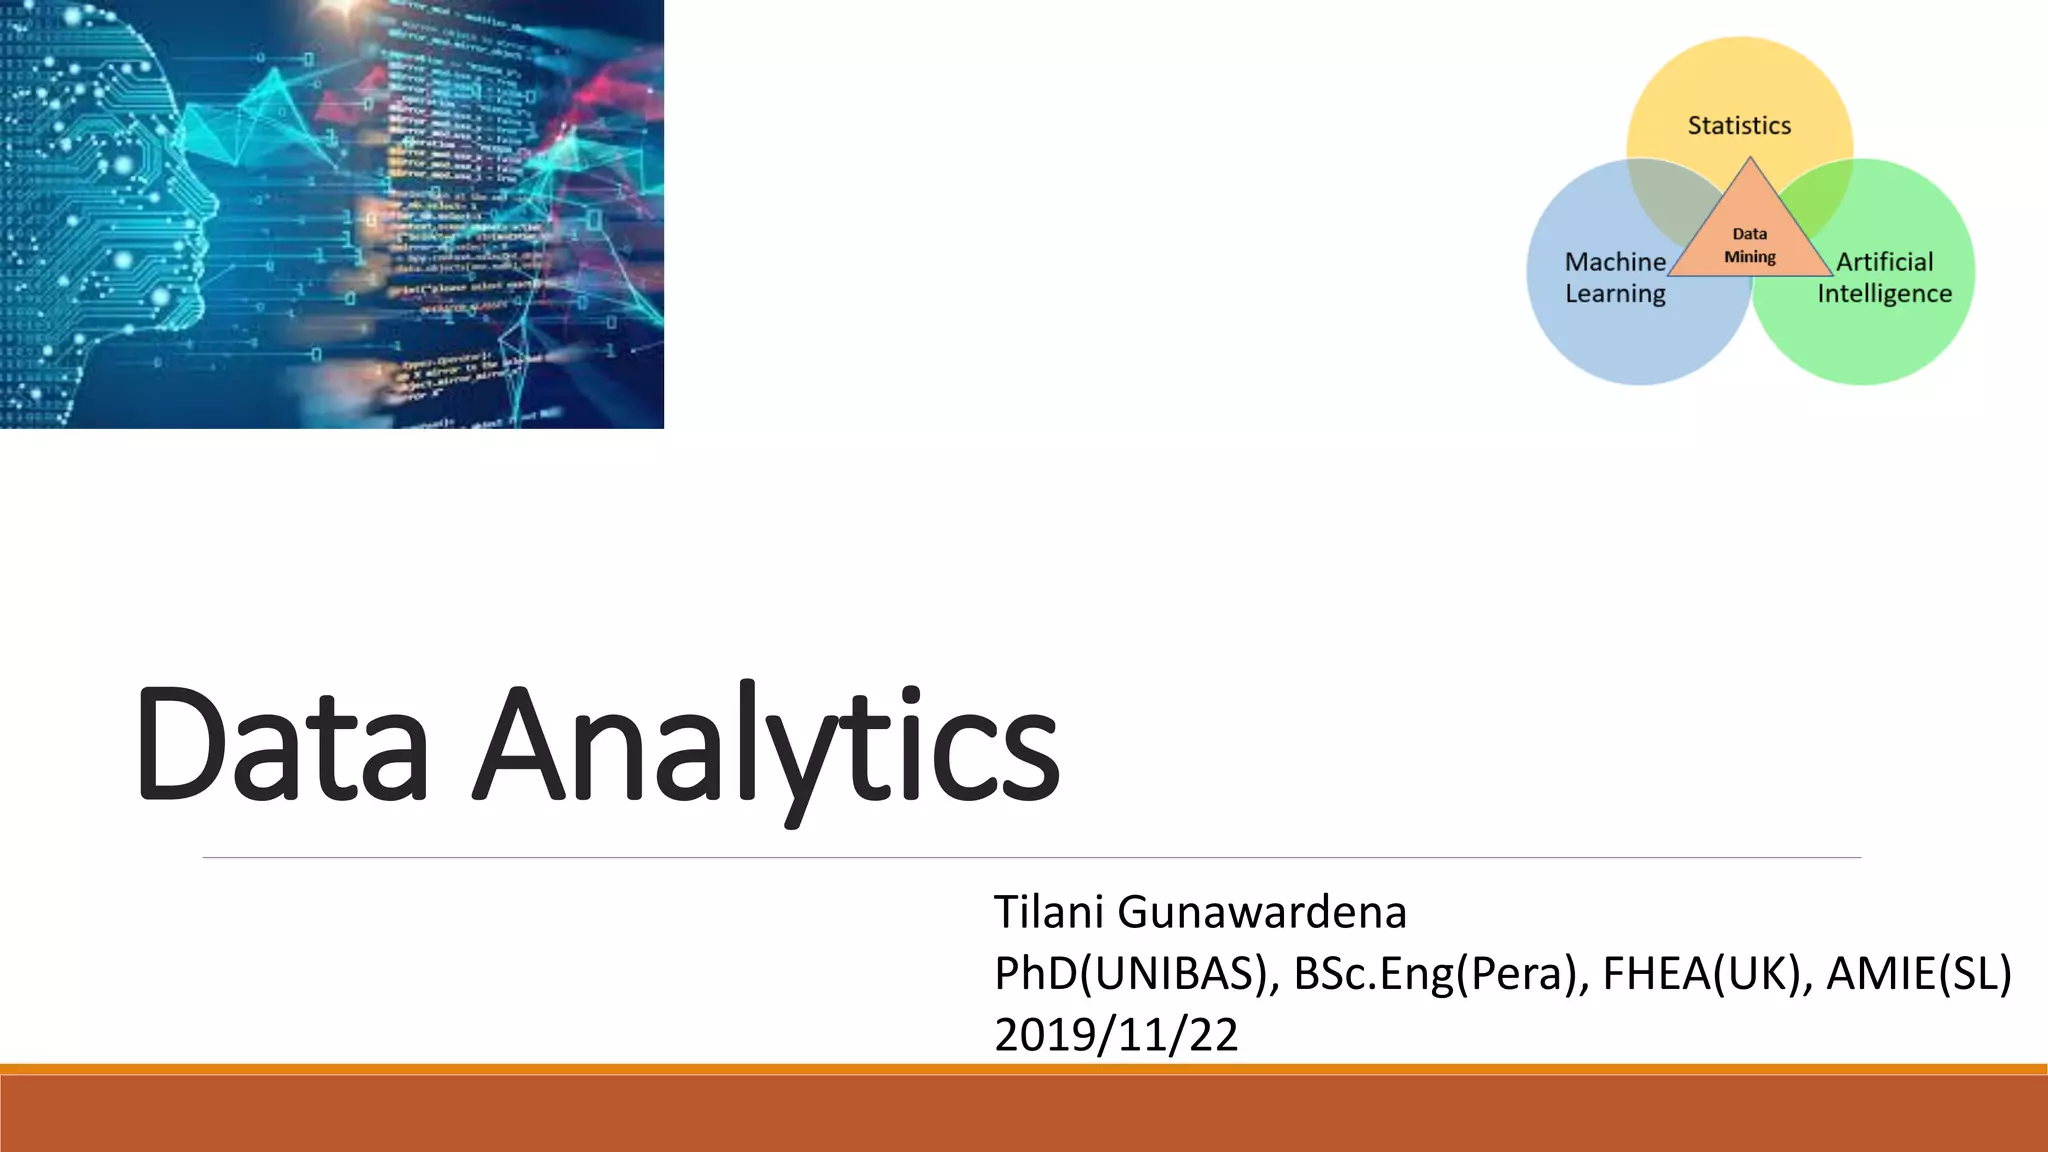
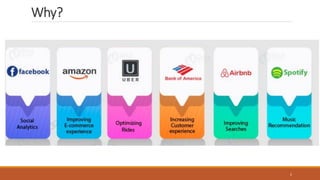
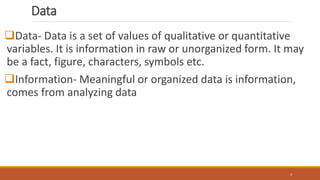
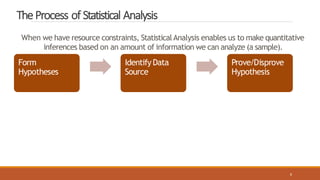
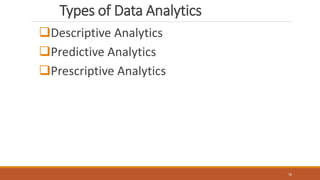
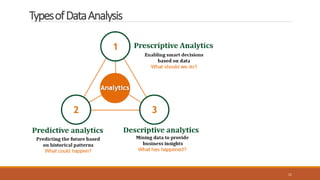
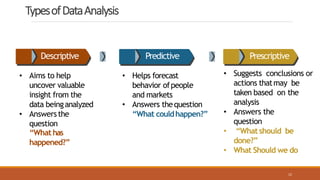
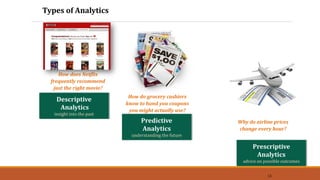
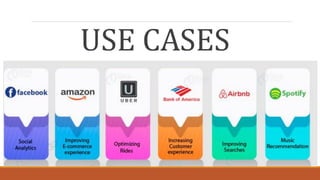
1) Data analytics is the process of examining large data sets to uncover patterns and insights. It involves descriptive, predictive, and prescriptive analysis. 2) Descriptive analysis summarizes past events, predictive analysis forecasts future events, and prescriptive analysis recommends actions. 3) Major companies like Facebook, Amazon, Uber, banks and Spotify extensively use big data and data analytics to improve customer experience, detect fraud, personalize recommendations and gain business insights.