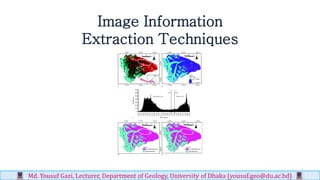
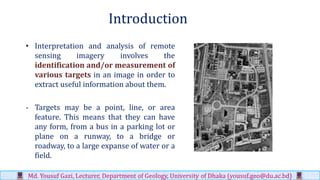
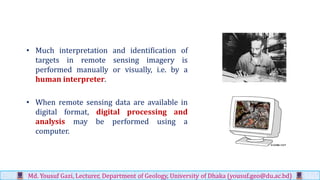
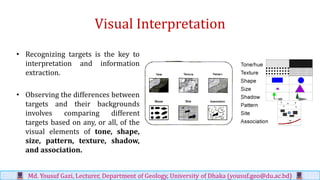
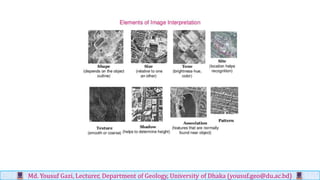
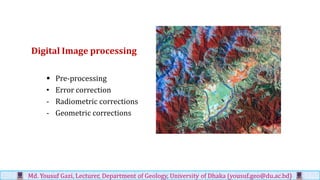
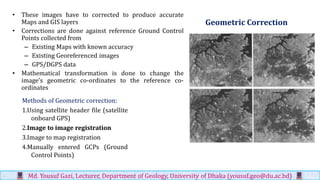
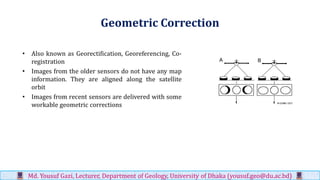
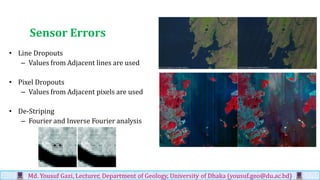
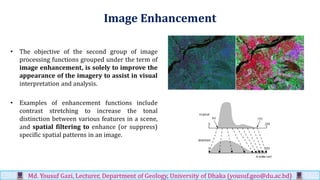
Image Information
Extraction Techniques
Md. Yousuf Gazi, Lecturer, Department of Geology, University of Dhaka (yousuf.geo@du.ac.bd)
Outlines:
• Introduction
• Visual Image interpretation
• Digital Image processing
- Image pre-processing
- Image enhancement and transformations
Md. Yousuf Gazi, Lecturer, Department of Geology, University of Dhaka (yousuf.geo@du.ac.bd)
Introduction
• Interpretation and analysis of remote
sensing imagery involves the
identification and/or measurement of
various targets in an image in order to
extract useful information about them.
- Targets may be a point, line, or area
feature. This means that they can have
any form, from a bus in a parking lot or
plane on a runway, to a bridge or
roadway, to a large expanse of water or a
field.
Md. Yousuf Gazi, Lecturer, Department of Geology, University of Dhaka (yousuf.geo@du.ac.bd)
• Much interpretation and identification of
targets in remote sensing imagery is
performed manually or visually, i.e. by a
human interpreter.
• When remote sensing data are available in
digital format, digital processing and
analysis may be performed using a
computer.
Md. Yousuf Gazi, Lecturer, Department of Geology, University of Dhaka (yousuf.geo@du.ac.bd)
Visual Interpretation
• Recognizing targets is the key to
interpretation and information
extraction.
• Observing the differences between
targets and their backgrounds
involves comparing different
targets based on any, or all, of the
visual elements of tone, shape,
size, pattern, texture, shadow,
and association.
Md. Yousuf Gazi, Lecturer, Department of Geology, University of Dhaka (yousuf.geo@du.ac.bd)
Tone
• Tone refers to the relative brightness or
color of objects in an image. Generally, tone
is the fundamental element for
distinguishing between different targets or
features.
• Variations in tone also allows the elements
of shape, texture, and pattern of objects to
be distinguished.
Md. Yousuf Gazi, Lecturer, Department of Geology, University of Dhaka (yousuf.geo@du.ac.bd)
Shape
• Shape refers to the general form, structure, or
outline of individual objects.
• Shape can be a very distinctive clue for
interpretation.
• Straight edge shapes typically represent urban or
agricultural (field) targets, while natural features,
such as forest edges, are generally more irregular in
shape, except where man has created a road or clear
cuts.
• Farm or crop land irrigated by rotating sprinkler
systems would appear as circular shapes.
Md. Yousuf Gazi, Lecturer, Department of Geology, University of Dhaka (yousuf.geo@du.ac.bd)
Size
• Size of objects in an image is a function of scale.
• It is important to assess the size of a target relative
to other objects in a scene, as well as the absolute
size, to aid in the interpretation of that target.
• A quick approximation of target size can direct
interpretation to an appropriate result more
quickly.
Md. Yousuf Gazi, Lecturer, Department of Geology, University of Dhaka (yousuf.geo@du.ac.bd)
Pattern
• Pattern refers to the spatial arrangement
of visibly discernible objects.
• Typically an orderly repetition of similar
tones and textures will produce a distinctive
and ultimately recognizable pattern.
• Orchards with evenly spaced trees, and urban
streets with regularly spaced houses are good
examples of pattern.
Md. Yousuf Gazi, Lecturer, Department of Geology, University of Dhaka (yousuf.geo@du.ac.bd)
Texture
• Texture refers to the arrangement and frequency of
tonal variation in particular areas of an image.
• Rough textures would consist of a mottled tone where
the grey levels change abruptly in a small area, whereas
smooth textures would have very little tonal variation.
• Smooth textures are most often the result of uniform,
even surfaces, such as fields, asphalt, or grasslands.
• A target with a rough surface and irregular structure,
such as a forest canopy, results in a rough textured
appearance.
•
• Texture is one of the most important elements for
distinguishing features in radar imagery.
Md. Yousuf Gazi, Lecturer, Department of Geology, University of Dhaka (yousuf.geo@du.ac.bd)
Shadow
• Shadow is also helpful in interpretation as it may
provide an idea of the profile and relative height of
a target or targets which may make identification
easier.
• However, shadows can also reduce or eliminate
interpretation in their area of influence, since targets
within shadows are much less (or not at all) discernible
from their surroundings.
• Shadow is also useful for enhancing or identifying
topography and landforms, particularly in radar
imagery.
Md. Yousuf Gazi, Lecturer, Department of Geology, University of Dhaka (yousuf.geo@du.ac.bd)
Association
• Association takes into account the relationship between other
recognizable objects or features in proximity to the target of
interest.
• The identification of features that one would expect to
associate with other features may provide information to
facilitate identification.
• In the example given above, commercial properties may be
associated with proximity to major transportation routes,
whereas residential areas would be associated with
schools, playgrounds, and sports fields.
• In our example, a lake is associated with boats, a marina,
and adjacent recreational land.
Md. Yousuf Gazi, Lecturer, Department of Geology, University of Dhaka (yousuf.geo@du.ac.bd)
Digital Image processing
▪ Pre-processing
• Error correction
- Radiometric corrections
- Geometric corrections
Md. Yousuf Gazi, Lecturer, Department of Geology, University of Dhaka (yousuf.geo@du.ac.bd)
Sources of Radiometric Distortion
▪ When image data is recorded by sensors on satellites and aircraft
it can contain errors in geometry and in the measured
brightness values of the pixels can result from the effect of the
atmosphere.
▪ Absorption by atmospheric molecules is a selective process that
converts incoming energy into heat. In particular, molecules of
oxygen, carbon dioxide, ozone and water attenuate the radiation
very strongly in certain wavebands.
▪ Scattering by atmospheric particles is then the dominant
mechanism that leads to radiometric distortion in image data.
▪ Transmittance. In the absence of atmosphere, transmittance is
100%. However because of scattering and absorption not all of
the available solar irradiance reaches the ground.
▪ Sky irradiance. Because the radiation is scattered on its travel
down through the atmosphere a particular pixel will be irradiated
both by energy on the direct path in Fig. and also by energy
scattered from atmospheric constituents. A pixel can also receive
some energy that has been reflected from surrounding pixels and
then, by atmospheric scattering, is again directed downwards.
▪ Path radiance. Again because of scattering alone, radiation can
reach the sensor from adjacent pixels and also via diffuse
scattering of the incoming radiation that is actually scattered
towards the sensor by the atmospheric constituents before it
reaches the ground.
Md. Yousuf Gazi, Lecturer, Department of Geology, University of Dhaka (yousuf.geo@du.ac.bd)
Sources of Geometric Distortion
• There are potentially many more sources of geometric
distortion of image data than radiometric distortion and
their effects are more severe. They can be related to a
number of factors, including
(i) the rotation of the earth during image acquisition,
(ii) The relative motions of the platform, its scanners and
the earth
(iii) the wide field of view of some sensors,
(iv) the curvature of the earth,
(v) sensor non-idealities,
(vi) uncontrolled variations in the position and attitude
of the remote sensing platform
(vii) panoramic effects related to the imaging geometry.
Md. Yousuf Gazi, Lecturer, Department of Geology, University of Dhaka (yousuf.geo@du.ac.bd)
Atmospheric Corrections
• Effects of Scattering (wavelength)
– Mie Scattering
– Rayleigh Scattering
• Effect of Haze
– Usually over large cities/Industrial Complexes
– Combination scattering and absorption
• Both sensor error and haze correcting programs are in-built
most IP software
• Special programs are built to correct atmospheric effect with
some user inputs
Md. Yousuf Gazi, Lecturer, Department of Geology, University of Dhaka (yousuf.geo@du.ac.bd)
Radiometric Correction
• Relative Correction between image set using
one image as the reference
– Dark Pixel method
– PIFs (Pseudo Invariant Features)
• Absolute Correction converts DN values to
percent reflectance
– requires atmospheric corrections
– Sensor calibration
– Observation geometry
Md. Yousuf Gazi, Lecturer, Department of Geology, University of Dhaka (yousuf.geo@du.ac.bd)
Panoramic Distortion
pθ = βh sec2θ = p sec2θ
Md. Yousuf Gazi, Lecturer, Department of Geology, University of Dhaka (yousuf.geo@du.ac.bd)
Earth Curvature
Md. Yousuf Gazi, Lecturer, Department of Geology, University of Dhaka (yousuf.geo@du.ac.bd)
Earth rotation effects
Geometric Correction
• These images have to corrected to produce accurate
Maps and GIS layers
• Corrections are done against reference Ground Control
Points collected from
– Existing Maps with known accuracy
– Existing Georeferenced images
– GPS/DGPS data
• Mathematical transformation is done to change the
image’s geometric co-ordinates to the reference co-
ordinates
Md. Yousuf Gazi, Lecturer, Department of Geology, University of Dhaka (yousuf.geo@du.ac.bd)
Methods of Geometric correction:
1.Using satellite header file (satellite
onboard GPS)
2.Image to image registration
3.Image to map registration
4.Manually entered GCPs (Ground
Control Points)
Geometric Correction
• Also known as Georectification, Georeferencing, Co-
registration
• Images from the older sensors do not have any map
information. They are aligned along the satellite
orbit
• Images from recent sensors are delivered with some
workable geometric corrections
Md. Yousuf Gazi, Lecturer, Department of Geology, University of Dhaka (yousuf.geo@du.ac.bd)
Sensor Errors
• Line Dropouts
– Values from Adjacent lines are used
• Pixel Dropouts
– Values from Adjacent pixels are used
• De-Striping
– Fourier and Inverse Fourier analysis
Md. Yousuf Gazi, Lecturer, Department of Geology, University of Dhaka (yousuf.geo@du.ac.bd)
Image Enhancement
• The objective of the second group of image
processing functions grouped under the term of
image enhancement, is solely to improve the
appearance of the imagery to assist in visual
interpretation and analysis.
• Examples of enhancement functions include
contrast stretching to increase the tonal
distinction between various features in a scene,
and spatial filtering to enhance (or suppress)
specific spatial patterns in an image.
Md. Yousuf Gazi, Lecturer, Department of Geology, University of Dhaka (yousuf.geo@du.ac.bd)
Image Enhancement
• Some are considered pre-processing and some
are hard to categorize
• Contrast, Color manipulations and Filtering are
definitely pre-processing
• Resolution Merging, Image Fusion, Band
Ratioing (indices), and Principal Component
Analysis (PCA) can also fall under information
Extraction
Md. Yousuf Gazi, Lecturer, Department of Geology, University of Dhaka (yousuf.geo@du.ac.bd)
Contrast Manipulations
• Stretching a part of the Histogram to
enhance certain features. Various ways of
doing it
• Thresholding
• Level Slicing
Md. Yousuf Gazi, Lecturer, Department of Geology, University of Dhaka (yousuf.geo@du.ac.bd)
• Linear Contrast Stretch: This involves identifying
lower and upper bounds from the histogram (usually
the minimum and maximum brightness values in the
image) and applying a transformation to stretch this
range to fill the full range.
• Equalized Contrast Stretch: This stretch assigns more
display values (range) to the frequently occurring
portions of the histogram. In this way, the detail in
these areas will be better enhanced relative to those
areas of the original histogram where values occur less
frequently.
• The linear contrast stretch enhances the contrast in the
image with light toned areas appearing lighter and dark
areas appearing darker, making visual interpretation
much easier. This example illustrates the increase in
contrast in an image before (left) and after (right) a
linear contrast stretch.
Md. Yousuf Gazi, Lecturer, Department of Geology, University of Dhaka (yousuf.geo@du.ac.bd)
Before Linear Stretch After Linear Stretch
Convolution Filtering
• Low Pass- A low-pass filter is designed to emphasize
larger, homogeneous areas of similar tone and reduce
the smaller detail in an image. Thus, low-pass filters
generally serve to smooth the appearance of an
image.
• High Pass- do the opposite and serve to sharpen the
appearance of fine detail in an image,
• Directional Filters- Directional, or edge detection
filters are designed to highlight linear features, such
as roads or field boundaries.
• Edge enhance
• Edge detect
Md. Yousuf Gazi, Lecturer, Department of Geology, University of Dhaka (yousuf.geo@du.ac.bd)
Resolution Merge & Image Fusion
• High resolution pan images merged with Low resolution
multispectrals
• Brovey method:
- Brovey, is also called the color normalization transform
because it involves a red-green-blue (RGB) color transform
method. The Brovey transformation was developed to avoid
the disadvantages of the multiplicative method.
- The formulae used for the Brovey transform can be described
as follows
- Red = (band1/Σ band n)∗ High Resolution Band
- Green = (band2/Σ band n)∗ High Resolution Band
- Blue = (band3/Σ band n)∗ High Resolution Band
- High resolution band = PAN band .
- Multiplicative method
- Principal Component method
- Optical images fused with Radar images
Md. Yousuf Gazi, Lecturer, Department of Geology, University of Dhaka (yousuf.geo@du.ac.bd)
Principal Component Analysis
• Image data in different bands
are highly correlated and
therefore redundant
• PCA reduces these
Redundancy by reprojecting
the Data in different Axes
• New bands of data are
created
• Data is in the earlier bands,
noises later
• Can be subjected to further
analysis
Image Transformations
Md. Yousuf Gazi, Lecturer, Department of Geology, University of Dhaka (yousuf.geo@du.ac.bd)
Original DN Values Transformed DNs and PC Axis
DNpc = a11DNA+a12 DNB
Band or Spectral Ratioing
• Compensates for brightness variation in scene
(shadowed vs. illuminated area)
• Very useful in vegetation studies specially in
differentiating stress
– Simple Ratio
– Vegetation Index
– Normalized Difference Vegetation Index
Md. Yousuf Gazi, Lecturer, Department of Geology, University of Dhaka (yousuf.geo@du.ac.bd)
Vegetation Indices
• Simple Ratio – NIR/Red band
– High reflection from Chlorophyll in NIR
and absorption in Red allows
identification
– High values are healthy vegetation
• NDVI allows –
– Net production calculation
– Monitor Phenological patterns
– Length of Growing season
NDVI =
NIR − red
NIR + red
Md. Yousuf Gazi, Lecturer, Department of Geology, University of Dhaka (yousuf.geo@du.ac.bd)
Other Ratios in ERDAS Imagine
• Mostly for Vegetation and Minerals
• Vegetation Index – NIR-Red
• Iron Oxide – Red/Blue
• Clay Minerals – Landsat Band 5/7
• Ferrous Minerals - Landsat Band 5/4
• For other sensors not supported by ERDAS write custom
models
Md. Yousuf Gazi, Lecturer, Department of Geology, University of Dhaka (yousuf.geo@du.ac.bd)
Other Image Transformations
• Textural; Rough or smooth
– Segment and classify based on Texture
• Tasseled Cap
– Alters data structure axes to match viewing
axes for vegetation, soil and water
• RGB-IHS Transformation
– Transform color to Intensity, Hue & Saturation
• Decorrelation Stretch
– for highly correlated data saturation is
exaggerated along PC axes
Md. Yousuf Gazi, Lecturer, Department of Geology, University of Dhaka (yousuf.geo@du.ac.bd)

Image information extraction techniques gazi

  • 1.
    Image Information Extraction Techniques Md.Yousuf Gazi, Lecturer, Department of Geology, University of Dhaka (yousuf.geo@du.ac.bd)
  • 2.
    Outlines: • Introduction • VisualImage interpretation • Digital Image processing - Image pre-processing - Image enhancement and transformations Md. Yousuf Gazi, Lecturer, Department of Geology, University of Dhaka (yousuf.geo@du.ac.bd)
  • 3.
    Introduction • Interpretation andanalysis of remote sensing imagery involves the identification and/or measurement of various targets in an image in order to extract useful information about them. - Targets may be a point, line, or area feature. This means that they can have any form, from a bus in a parking lot or plane on a runway, to a bridge or roadway, to a large expanse of water or a field. Md. Yousuf Gazi, Lecturer, Department of Geology, University of Dhaka (yousuf.geo@du.ac.bd)
  • 4.
    • Much interpretationand identification of targets in remote sensing imagery is performed manually or visually, i.e. by a human interpreter. • When remote sensing data are available in digital format, digital processing and analysis may be performed using a computer. Md. Yousuf Gazi, Lecturer, Department of Geology, University of Dhaka (yousuf.geo@du.ac.bd)
  • 5.
    Visual Interpretation • Recognizingtargets is the key to interpretation and information extraction. • Observing the differences between targets and their backgrounds involves comparing different targets based on any, or all, of the visual elements of tone, shape, size, pattern, texture, shadow, and association. Md. Yousuf Gazi, Lecturer, Department of Geology, University of Dhaka (yousuf.geo@du.ac.bd)
  • 6.
    Tone • Tone refersto the relative brightness or color of objects in an image. Generally, tone is the fundamental element for distinguishing between different targets or features. • Variations in tone also allows the elements of shape, texture, and pattern of objects to be distinguished. Md. Yousuf Gazi, Lecturer, Department of Geology, University of Dhaka (yousuf.geo@du.ac.bd)
  • 7.
    Shape • Shape refersto the general form, structure, or outline of individual objects. • Shape can be a very distinctive clue for interpretation. • Straight edge shapes typically represent urban or agricultural (field) targets, while natural features, such as forest edges, are generally more irregular in shape, except where man has created a road or clear cuts. • Farm or crop land irrigated by rotating sprinkler systems would appear as circular shapes. Md. Yousuf Gazi, Lecturer, Department of Geology, University of Dhaka (yousuf.geo@du.ac.bd)
  • 8.
    Size • Size ofobjects in an image is a function of scale. • It is important to assess the size of a target relative to other objects in a scene, as well as the absolute size, to aid in the interpretation of that target. • A quick approximation of target size can direct interpretation to an appropriate result more quickly. Md. Yousuf Gazi, Lecturer, Department of Geology, University of Dhaka (yousuf.geo@du.ac.bd)
  • 9.
    Pattern • Pattern refersto the spatial arrangement of visibly discernible objects. • Typically an orderly repetition of similar tones and textures will produce a distinctive and ultimately recognizable pattern. • Orchards with evenly spaced trees, and urban streets with regularly spaced houses are good examples of pattern. Md. Yousuf Gazi, Lecturer, Department of Geology, University of Dhaka (yousuf.geo@du.ac.bd)
  • 10.
    Texture • Texture refersto the arrangement and frequency of tonal variation in particular areas of an image. • Rough textures would consist of a mottled tone where the grey levels change abruptly in a small area, whereas smooth textures would have very little tonal variation. • Smooth textures are most often the result of uniform, even surfaces, such as fields, asphalt, or grasslands. • A target with a rough surface and irregular structure, such as a forest canopy, results in a rough textured appearance. • • Texture is one of the most important elements for distinguishing features in radar imagery. Md. Yousuf Gazi, Lecturer, Department of Geology, University of Dhaka (yousuf.geo@du.ac.bd)
  • 11.
    Shadow • Shadow isalso helpful in interpretation as it may provide an idea of the profile and relative height of a target or targets which may make identification easier. • However, shadows can also reduce or eliminate interpretation in their area of influence, since targets within shadows are much less (or not at all) discernible from their surroundings. • Shadow is also useful for enhancing or identifying topography and landforms, particularly in radar imagery. Md. Yousuf Gazi, Lecturer, Department of Geology, University of Dhaka (yousuf.geo@du.ac.bd)
  • 12.
    Association • Association takesinto account the relationship between other recognizable objects or features in proximity to the target of interest. • The identification of features that one would expect to associate with other features may provide information to facilitate identification. • In the example given above, commercial properties may be associated with proximity to major transportation routes, whereas residential areas would be associated with schools, playgrounds, and sports fields. • In our example, a lake is associated with boats, a marina, and adjacent recreational land. Md. Yousuf Gazi, Lecturer, Department of Geology, University of Dhaka (yousuf.geo@du.ac.bd)
  • 13.
    Md. Yousuf Gazi,Lecturer, Department of Geology, University of Dhaka (yousuf.geo@du.ac.bd)
  • 14.
    Digital Image processing ▪Pre-processing • Error correction - Radiometric corrections - Geometric corrections Md. Yousuf Gazi, Lecturer, Department of Geology, University of Dhaka (yousuf.geo@du.ac.bd)
  • 15.
    Sources of RadiometricDistortion ▪ When image data is recorded by sensors on satellites and aircraft it can contain errors in geometry and in the measured brightness values of the pixels can result from the effect of the atmosphere. ▪ Absorption by atmospheric molecules is a selective process that converts incoming energy into heat. In particular, molecules of oxygen, carbon dioxide, ozone and water attenuate the radiation very strongly in certain wavebands. ▪ Scattering by atmospheric particles is then the dominant mechanism that leads to radiometric distortion in image data. ▪ Transmittance. In the absence of atmosphere, transmittance is 100%. However because of scattering and absorption not all of the available solar irradiance reaches the ground. ▪ Sky irradiance. Because the radiation is scattered on its travel down through the atmosphere a particular pixel will be irradiated both by energy on the direct path in Fig. and also by energy scattered from atmospheric constituents. A pixel can also receive some energy that has been reflected from surrounding pixels and then, by atmospheric scattering, is again directed downwards. ▪ Path radiance. Again because of scattering alone, radiation can reach the sensor from adjacent pixels and also via diffuse scattering of the incoming radiation that is actually scattered towards the sensor by the atmospheric constituents before it reaches the ground. Md. Yousuf Gazi, Lecturer, Department of Geology, University of Dhaka (yousuf.geo@du.ac.bd)
  • 16.
    Sources of GeometricDistortion • There are potentially many more sources of geometric distortion of image data than radiometric distortion and their effects are more severe. They can be related to a number of factors, including (i) the rotation of the earth during image acquisition, (ii) The relative motions of the platform, its scanners and the earth (iii) the wide field of view of some sensors, (iv) the curvature of the earth, (v) sensor non-idealities, (vi) uncontrolled variations in the position and attitude of the remote sensing platform (vii) panoramic effects related to the imaging geometry. Md. Yousuf Gazi, Lecturer, Department of Geology, University of Dhaka (yousuf.geo@du.ac.bd)
  • 17.
    Atmospheric Corrections • Effectsof Scattering (wavelength) – Mie Scattering – Rayleigh Scattering • Effect of Haze – Usually over large cities/Industrial Complexes – Combination scattering and absorption • Both sensor error and haze correcting programs are in-built most IP software • Special programs are built to correct atmospheric effect with some user inputs Md. Yousuf Gazi, Lecturer, Department of Geology, University of Dhaka (yousuf.geo@du.ac.bd)
  • 18.
    Radiometric Correction • RelativeCorrection between image set using one image as the reference – Dark Pixel method – PIFs (Pseudo Invariant Features) • Absolute Correction converts DN values to percent reflectance – requires atmospheric corrections – Sensor calibration – Observation geometry Md. Yousuf Gazi, Lecturer, Department of Geology, University of Dhaka (yousuf.geo@du.ac.bd)
  • 19.
    Panoramic Distortion pθ =βh sec2θ = p sec2θ Md. Yousuf Gazi, Lecturer, Department of Geology, University of Dhaka (yousuf.geo@du.ac.bd)
  • 20.
    Earth Curvature Md. YousufGazi, Lecturer, Department of Geology, University of Dhaka (yousuf.geo@du.ac.bd) Earth rotation effects
  • 21.
    Geometric Correction • Theseimages have to corrected to produce accurate Maps and GIS layers • Corrections are done against reference Ground Control Points collected from – Existing Maps with known accuracy – Existing Georeferenced images – GPS/DGPS data • Mathematical transformation is done to change the image’s geometric co-ordinates to the reference co- ordinates Md. Yousuf Gazi, Lecturer, Department of Geology, University of Dhaka (yousuf.geo@du.ac.bd) Methods of Geometric correction: 1.Using satellite header file (satellite onboard GPS) 2.Image to image registration 3.Image to map registration 4.Manually entered GCPs (Ground Control Points)
  • 22.
    Geometric Correction • Alsoknown as Georectification, Georeferencing, Co- registration • Images from the older sensors do not have any map information. They are aligned along the satellite orbit • Images from recent sensors are delivered with some workable geometric corrections Md. Yousuf Gazi, Lecturer, Department of Geology, University of Dhaka (yousuf.geo@du.ac.bd)
  • 23.
    Sensor Errors • LineDropouts – Values from Adjacent lines are used • Pixel Dropouts – Values from Adjacent pixels are used • De-Striping – Fourier and Inverse Fourier analysis Md. Yousuf Gazi, Lecturer, Department of Geology, University of Dhaka (yousuf.geo@du.ac.bd)
  • 24.
    Image Enhancement • Theobjective of the second group of image processing functions grouped under the term of image enhancement, is solely to improve the appearance of the imagery to assist in visual interpretation and analysis. • Examples of enhancement functions include contrast stretching to increase the tonal distinction between various features in a scene, and spatial filtering to enhance (or suppress) specific spatial patterns in an image. Md. Yousuf Gazi, Lecturer, Department of Geology, University of Dhaka (yousuf.geo@du.ac.bd)
  • 25.
    Image Enhancement • Someare considered pre-processing and some are hard to categorize • Contrast, Color manipulations and Filtering are definitely pre-processing • Resolution Merging, Image Fusion, Band Ratioing (indices), and Principal Component Analysis (PCA) can also fall under information Extraction Md. Yousuf Gazi, Lecturer, Department of Geology, University of Dhaka (yousuf.geo@du.ac.bd)
  • 26.
    Contrast Manipulations • Stretchinga part of the Histogram to enhance certain features. Various ways of doing it • Thresholding • Level Slicing Md. Yousuf Gazi, Lecturer, Department of Geology, University of Dhaka (yousuf.geo@du.ac.bd)
  • 27.
    • Linear ContrastStretch: This involves identifying lower and upper bounds from the histogram (usually the minimum and maximum brightness values in the image) and applying a transformation to stretch this range to fill the full range. • Equalized Contrast Stretch: This stretch assigns more display values (range) to the frequently occurring portions of the histogram. In this way, the detail in these areas will be better enhanced relative to those areas of the original histogram where values occur less frequently. • The linear contrast stretch enhances the contrast in the image with light toned areas appearing lighter and dark areas appearing darker, making visual interpretation much easier. This example illustrates the increase in contrast in an image before (left) and after (right) a linear contrast stretch. Md. Yousuf Gazi, Lecturer, Department of Geology, University of Dhaka (yousuf.geo@du.ac.bd) Before Linear Stretch After Linear Stretch
  • 28.
    Convolution Filtering • LowPass- A low-pass filter is designed to emphasize larger, homogeneous areas of similar tone and reduce the smaller detail in an image. Thus, low-pass filters generally serve to smooth the appearance of an image. • High Pass- do the opposite and serve to sharpen the appearance of fine detail in an image, • Directional Filters- Directional, or edge detection filters are designed to highlight linear features, such as roads or field boundaries. • Edge enhance • Edge detect Md. Yousuf Gazi, Lecturer, Department of Geology, University of Dhaka (yousuf.geo@du.ac.bd)
  • 29.
    Resolution Merge &Image Fusion • High resolution pan images merged with Low resolution multispectrals • Brovey method: - Brovey, is also called the color normalization transform because it involves a red-green-blue (RGB) color transform method. The Brovey transformation was developed to avoid the disadvantages of the multiplicative method. - The formulae used for the Brovey transform can be described as follows - Red = (band1/Σ band n)∗ High Resolution Band - Green = (band2/Σ band n)∗ High Resolution Band - Blue = (band3/Σ band n)∗ High Resolution Band - High resolution band = PAN band . - Multiplicative method - Principal Component method - Optical images fused with Radar images Md. Yousuf Gazi, Lecturer, Department of Geology, University of Dhaka (yousuf.geo@du.ac.bd)
  • 30.
    Principal Component Analysis •Image data in different bands are highly correlated and therefore redundant • PCA reduces these Redundancy by reprojecting the Data in different Axes • New bands of data are created • Data is in the earlier bands, noises later • Can be subjected to further analysis Image Transformations Md. Yousuf Gazi, Lecturer, Department of Geology, University of Dhaka (yousuf.geo@du.ac.bd) Original DN Values Transformed DNs and PC Axis DNpc = a11DNA+a12 DNB
  • 31.
    Band or SpectralRatioing • Compensates for brightness variation in scene (shadowed vs. illuminated area) • Very useful in vegetation studies specially in differentiating stress – Simple Ratio – Vegetation Index – Normalized Difference Vegetation Index Md. Yousuf Gazi, Lecturer, Department of Geology, University of Dhaka (yousuf.geo@du.ac.bd)
  • 32.
    Vegetation Indices • SimpleRatio – NIR/Red band – High reflection from Chlorophyll in NIR and absorption in Red allows identification – High values are healthy vegetation • NDVI allows – – Net production calculation – Monitor Phenological patterns – Length of Growing season NDVI = NIR − red NIR + red Md. Yousuf Gazi, Lecturer, Department of Geology, University of Dhaka (yousuf.geo@du.ac.bd)
  • 33.
    Other Ratios inERDAS Imagine • Mostly for Vegetation and Minerals • Vegetation Index – NIR-Red • Iron Oxide – Red/Blue • Clay Minerals – Landsat Band 5/7 • Ferrous Minerals - Landsat Band 5/4 • For other sensors not supported by ERDAS write custom models Md. Yousuf Gazi, Lecturer, Department of Geology, University of Dhaka (yousuf.geo@du.ac.bd)
  • 34.
    Other Image Transformations •Textural; Rough or smooth – Segment and classify based on Texture • Tasseled Cap – Alters data structure axes to match viewing axes for vegetation, soil and water • RGB-IHS Transformation – Transform color to Intensity, Hue & Saturation • Decorrelation Stretch – for highly correlated data saturation is exaggerated along PC axes Md. Yousuf Gazi, Lecturer, Department of Geology, University of Dhaka (yousuf.geo@du.ac.bd)
  • 35.
    Md. Yousuf Gazi,Lecturer, Department of Geology, University of Dhaka (yousuf.geo@du.ac.bd)