1) The document discusses using remote sensing and GIS techniques to map geomorphological units around Shivpuri City, India using IRS-1D LISS-III satellite imagery from 2006.
2) Six main geomorphic units were identified and mapped - denudational hills, structural hills, residual hills, pediments, pediplains, and alluvial plains.
3) Remote sensing and GIS allowed efficient mapping of the geomorphic units over a large area to inform land use planning decisions by local authorities.
Indexing of toposheets, in Introduction to Million sheet, degree sheet, toposheet, and their scales.
Some practice questions based on toposheet indexing and map scale has also been given for best practice.
Indexing of toposheets, in Introduction to Million sheet, degree sheet, toposheet, and their scales.
Some practice questions based on toposheet indexing and map scale has also been given for best practice.
THE PRESENCE AND VARIETY OF A PARTICULAR PLANTS
SPECIES IN THE AREA OF MINERALISATION HAVE BEEN RECOGNISED AS A GUIDE TO LOCATING ORE, METHOD,UNIVERSAL INDICATORS , UNIVERSAL INDICATOR ,LOCAL INDICATOR
Drainage pattern & morphometric analyses of drainage basinsUjjavalPatel16
Drainage Pattern & Morphometric analyses of drainage basins.
In geomorphology, the patterns formed by the streams, rivers, and lakes in a particular drainage basin. Also known as drainage systems or river systems.
According to the configuration of the channels, drainage systems can fall into one of several categories known as drainage patterns. Drainage patterns depend on the topography & geology of the land.
Drainage basins: The total land surface drained by a system of stream leading to the same outflow.
Drainage system: The stream, tributaries, and other bodies of water by which a region is called drained.
Drainage divide: The boundary between adjacent drainage basins.
An area of land drained by a river and its tributaries.
It is also called the Catchment area.
Any precipitation which falls into the basin is collected and drains into the main river or its tributaries by runoff, throughflow or groundwater flow.
Its boundary marked by a ridge of high land called watershed.
Drainage basins have one main stream and many tributaries.
Each tributaries of main stream forms sub-drainage basin.
Comparison between Peninsula India and Extra-Peninsular India.Tahsin Islam Ornee
The Peninsula India and Extra-Peninsular India both are the physiographic subdivision of India. The presentation deals with the comparison between the two.
Gravity anomaly across reagional structuresAmit K. Mishra
Gravity Anomaly across continents and ocean, gravity anomaly across mid-oceanic ridges, gravity anomaly across orogenic belts, and gravity anomaly across subduction zones.
“Cadastral Maps for Socio-Economic Data Visualization and Integration for Lan...irjes
The impact of mining and mineral extraction activities can be significant on the surrounding land,
water and air bodies, in any operational area. The environmental degradation ranges from localized surface and
ground water contamination to the damaging effects of airborne pollutants on the regional ecosystem; which
need the properly designed geospatial database. The monitoring of these environmental impacts requires a userfriendly
and cost effective method to quantify the land cover changes over large time periods. Now-a-days, it
has become compulsory to use the remote sensing techniques for regular monitoring of these environmental
hazards in-and-around the mining areas using cadastral map. This paper provides a case study on the use of
geospatial techniques for environmental monitoring in the mining areas.
International Journal of Engineering Research and DevelopmentIJERD Editor
• Electrical, Electronics and Computer Engineering,
• Information Engineering and Technology,
• Mechanical, Industrial and Manufacturing Engineering,
• Automation and Mechatronics Engineering,
• Material and Chemical Engineering,
• Civil and Architecture Engineering,
• Biotechnology and Bio Engineering,
• Environmental Engineering,
• Petroleum and Mining Engineering,
• Marine and Agriculture engineering,
• Aerospace Engineering.
Land use Land Cover Highlight for Jibia Local Government, Nigeriaijtsrd
Land use and land cover is very important for appropriate planning and budget of a community. In Jibia several activities are carried on the land without actually knowing the percentage of the land cover of features. Remote sensing and GIS technology are valuable tools in managing land use and land cover. This research described the land use and land cover coverage of the entire LGA land using Remote Sensing and GIS. Landsat Satellite imagery of 2009 of the study area was processed and classified into 5 groups namely Build up sharp sand, Farm Land trees, Vegetation shrubs, Water body and Barren land. Statistical analysis was employed to show the percentage distribution of the land. The study shows the percentage coverage of land physical feature which in turn describe the land use. The research revealed that agriculture is the major activity in the study area. It also concluded by recommending the need for adequate measures to avoid desert encroachment and government support to enhance agricultural produce. Lugga M. S | Babale Z. T | Yamel A. G "Land use Land Cover Highlight for Jibia Local Government, Nigeria" Published in International Journal of Trend in Scientific Research and Development (ijtsrd), ISSN: 2456-6470, Volume-4 | Issue-4 , June 2020, URL: https://www.ijtsrd.com/papers/ijtsrd31134.pdf Paper Url :https://www.ijtsrd.com/other-scientific-research-area/other/31134/land-use-land-cover-highlight-for-jibia-local-government-nigeria/lugga-m-s
International Journal of Engineering Research and DevelopmentIJERD Editor
Electrical, Electronics and Computer Engineering,
Information Engineering and Technology,
Mechanical, Industrial and Manufacturing Engineering,
Automation and Mechatronics Engineering,
Material and Chemical Engineering,
Civil and Architecture Engineering,
Biotechnology and Bio Engineering,
Environmental Engineering,
Petroleum and Mining Engineering,
Marine and Agriculture engineering,
Aerospace Engineering.
Application of Remote Sensing Techniques for Change Detection in Land Use/ La...iosrjce
IOSR Journal of Applied Geology and Geophysics (IOSR-JAGG) is a double blind peer reviewed International Journal that provides rapid publication (within a month) of articles in all areas of Applied Geology and Geophysics. The journal welcomes publications of high quality papers on theoretical developments and practical applications in Applied Geology and Geophysics. Original research papers, state-of-the-art reviews, and high quality technical notes are invited for publications.
Land Use/Land Cover Mapping Of Allahabad City by Using Remote Sensing & GIS IJMER
The present study was carried out to produce and evaluate the land use/land cover maps by on
screen visual interpretation. The studies of land cover of Allahabad city (study area) consist of 87517.47 ha
out of which 5500.35 ha is build up land (Urban / Rural) Area. In this respect, the Build up land (Urban /
Rural) area scorers 6.28% of the total area. It has also been found that about 17155.001ha (19.60 %) of
area is covered by current fallow land. The double/triple crop land of 30178.44ha (34.84%). The area
covered by gullied / ravines is 1539.20 ha (1.75 %) and that of the kharif crop land is 2828.00 ha (3.23 %).
The area covered by other wasteland is 2551.05ha (2.91%). Table 4.1 shows the area distribution of the
various land use and land cover of Allahabad city.
International Journal of Engineering and Science Invention (IJESI)inventionjournals
International Journal of Engineering and Science Invention (IJESI) is an international journal intended for professionals and researchers in all fields of computer science and electronics. IJESI publishes research articles and reviews within the whole field Engineering Science and Technology, new teaching methods, assessment, validation and the impact of new technologies and it will continue to provide information on the latest trends and developments in this ever-expanding subject. The publications of papers are selected through double peer reviewed to ensure originality, relevance, and readability. The articles published in our journal can be accessed online.
Wastelands are essentially understood as low-quality land from an agricultural point of view,
often referred to as degraded land. Unscientific handling of land resources has resulted in the
development of vast stretches of wastelands and also formed one of the major factors of decrease in
per capita arable land causing ecological imbalances. The present paper aims to identify the
Wastelands of Chitradurga District, Karnataka through hi-tech tools of Geoinformatics. The major
causes of land degradation and subsequent formation of wastelands can be primarily attributed to
'faculty agricultural practice and indiscriminate deforestation'. Agricultural practices include the lack
of soil conservation measures and irrigation practices that often lead to the formation of the salt
affected soils. The study was taken up to map and record the wastelands using Survey of India (SoI)
toposheets of 1:50,000 scale, IRS 1D PAN+LISS III satellite data and Google Earth software with
limited Ground Truth Check (GTC) and final wasteland layer is generated. The database provides
spatial baseline information in distribution, extent and temporal behavior of wastelands
Abstract Remote sensing has its application in various fields like geology and mineral exploration, geomorphology and modern geomorphic process modeling, nature mitigation studies, hazard zone mapping, eco system study in hills, plains, riverine, coastal, marine and volcanic landforms, forest and biomass inventory, fishery. Remote sensing plays a vital in various fields. This technique along with the GIS has been to study the geomorphological, hydro geological, land use/land cover, lithological, structural aspects/ features in the parts of Anaimalai, Pollachi and Udumalpet block of TamilNadu. Integrated approach using geographic information system provides cost effective support in resources inventory including land use mapping, comprehensive data base for resources, analytical tools for decision making and impact analysis for plan evaluation. GIS accept large volumes of spatial data derived from a variety of sources and effectively store, retrieve, manipulate, analyze and display all forms of geographically referenced information. Maps and statistical data can be obtained from the spatial integration and analysis of an area using GIS software. In order to assess the natural resource availability and its potentiality in parts of Anaimalai, Pollachi and Udumalpet block, Tamil Nadu, an integrated remote sensing and GIS based study has been conducted by adopting the standard procedures. The groundwater potential zone of any area is depends on geological formations; geomorphologic unit’s recharges characters, topography, and thickness of weathered and fractured zones. In the present study, area was taken to locate groundwater potential zones by integrated different thematic maps, remote sensing and geographic information system techniques. To find out the ground water potential zones, different thematic maps have been prepared and integrated each of them. They are mainly geology, geomorphology, land use / land cover, lineament etc. Groundwater potential zones have been prepared with help of integrating different thematic maps. This study area is finally to get the groundwater potential zones we have to classified few area such as high, moderate and low potential zones. Index Terms: Remote sensing, GIS, lithology, Geomorphology, Hydrology, landforms etc.
IJRET : International Journal of Research in Engineering and Technology is an international peer reviewed, online journal published by eSAT Publishing House for the enhancement of research in various disciplines of Engineering and Technology. The aim and scope of the journal is to provide an academic medium and an important reference for the advancement and dissemination of research results that support high-level learning, teaching and research in the fields of Engineering and Technology. We bring together Scientists, Academician, Field Engineers, Scholars and Students of related fields of Engineering and Technology.
Change detection analysis in land use / land cover of Pune city using remotel...Nitin Mundhe
Lecture delivered in the National Conference entitled “Monitoring Degraded Lands” jointly organized by Agasti Arts, Commerce and Dadasaheb Rupwate Science
College, Akole and Maharashtra Bhugolshastra Parishad Pune to be held on 4 to 6 February 2014.
Mapping of the Groundwater Potential Zones Using Remote Sensing and Geograph...AzanAlsameey
Water is perhaps the most vital natural resource of any country. Economic activities, including industry and agriculture, require water. The health of the population is dependent upon an adequate and clean water supply. Problems of water supply, both in terms of quality and quantity, are experienced by many countries but felt especially in the developing world, where population pressure is greatest and the infrastructure is less well developed. Water is the most basic component of any urban, industrial or agricultural development project (Moussa 2007).
With the advent of remote sensing and computer technology in the geosciences, geological investigation and interpretation have entered a new era. Remote sensing technology is very efficient for collecting data. Computer technology, such as computerbased geographic information system (GIS), supplies a different method for data storage, integration, analysis, and display. The combination of remote sensing and GIS provides an optimum system for various geological investigations such as groundwater exploration (Chen 2001).
Land Use Land Cover Change Detection of Gulbarga City Using Remote Sensing an...ijsrd.com
Land use and land cover(LULC) recently these days became a major component to handle natural resources and managing changes occurring in the environment.which is due to expansion of the urban area it has lead to critical losses of agriculture land,vegetation land and water bodies.followed by this the urban sprawl created a environmental issues. For example :decreased air quality and increase in the temperature etc. Land use and land cover change is driven by human actions and also drives changes that limit availability of products and services for human and animals, and it can undermine ecological wellbeing also. Land use and land cover is an important component in understanding various interactions of the human activities with the environment and thus it is necessary to be able to simulate changes. Therefore, this study was aimed at understanding land use and land cover change in Gulbarga city. In this work we took Gulbarga city to study the urban expansion and LULC change that took place in 2001 and 2012 to know the changes happened in the year 2012 by comparing with data of 2001.remote sensing methodology is used in this study which provides major coverage mapping & classification of land cover features such as vegetation,soil,water,forest etc. A wide range of environmental parameters can be measured including the land use, vegetation types, surface temperatures , soil types, precipitation, phytoplankton, turbidity, surface elevation and geology.satellite images of two different years i.e 2001 and 2012 are taken in to consideration.after image processing classification is done so as to classify images in to various different land use categories.
DevOps and Testing slides at DASA ConnectKari Kakkonen
My and Rik Marselis slides at 30.5.2024 DASA Connect conference. We discuss about what is testing, then what is agile testing and finally what is Testing in DevOps. Finally we had lovely workshop with the participants trying to find out different ways to think about quality and testing in different parts of the DevOps infinity loop.
Software Delivery At the Speed of AI: Inflectra Invests In AI-Powered QualityInflectra
In this insightful webinar, Inflectra explores how artificial intelligence (AI) is transforming software development and testing. Discover how AI-powered tools are revolutionizing every stage of the software development lifecycle (SDLC), from design and prototyping to testing, deployment, and monitoring.
Learn about:
• The Future of Testing: How AI is shifting testing towards verification, analysis, and higher-level skills, while reducing repetitive tasks.
• Test Automation: How AI-powered test case generation, optimization, and self-healing tests are making testing more efficient and effective.
• Visual Testing: Explore the emerging capabilities of AI in visual testing and how it's set to revolutionize UI verification.
• Inflectra's AI Solutions: See demonstrations of Inflectra's cutting-edge AI tools like the ChatGPT plugin and Azure Open AI platform, designed to streamline your testing process.
Whether you're a developer, tester, or QA professional, this webinar will give you valuable insights into how AI is shaping the future of software delivery.
Builder.ai Founder Sachin Dev Duggal's Strategic Approach to Create an Innova...Ramesh Iyer
In today's fast-changing business world, Companies that adapt and embrace new ideas often need help to keep up with the competition. However, fostering a culture of innovation takes much work. It takes vision, leadership and willingness to take risks in the right proportion. Sachin Dev Duggal, co-founder of Builder.ai, has perfected the art of this balance, creating a company culture where creativity and growth are nurtured at each stage.
LF Energy Webinar: Electrical Grid Modelling and Simulation Through PowSyBl -...DanBrown980551
Do you want to learn how to model and simulate an electrical network from scratch in under an hour?
Then welcome to this PowSyBl workshop, hosted by Rte, the French Transmission System Operator (TSO)!
During the webinar, you will discover the PowSyBl ecosystem as well as handle and study an electrical network through an interactive Python notebook.
PowSyBl is an open source project hosted by LF Energy, which offers a comprehensive set of features for electrical grid modelling and simulation. Among other advanced features, PowSyBl provides:
- A fully editable and extendable library for grid component modelling;
- Visualization tools to display your network;
- Grid simulation tools, such as power flows, security analyses (with or without remedial actions) and sensitivity analyses;
The framework is mostly written in Java, with a Python binding so that Python developers can access PowSyBl functionalities as well.
What you will learn during the webinar:
- For beginners: discover PowSyBl's functionalities through a quick general presentation and the notebook, without needing any expert coding skills;
- For advanced developers: master the skills to efficiently apply PowSyBl functionalities to your real-world scenarios.
JMeter webinar - integration with InfluxDB and GrafanaRTTS
Watch this recorded webinar about real-time monitoring of application performance. See how to integrate Apache JMeter, the open-source leader in performance testing, with InfluxDB, the open-source time-series database, and Grafana, the open-source analytics and visualization application.
In this webinar, we will review the benefits of leveraging InfluxDB and Grafana when executing load tests and demonstrate how these tools are used to visualize performance metrics.
Length: 30 minutes
Session Overview
-------------------------------------------
During this webinar, we will cover the following topics while demonstrating the integrations of JMeter, InfluxDB and Grafana:
- What out-of-the-box solutions are available for real-time monitoring JMeter tests?
- What are the benefits of integrating InfluxDB and Grafana into the load testing stack?
- Which features are provided by Grafana?
- Demonstration of InfluxDB and Grafana using a practice web application
To view the webinar recording, go to:
https://www.rttsweb.com/jmeter-integration-webinar
"Impact of front-end architecture on development cost", Viktor TurskyiFwdays
I have heard many times that architecture is not important for the front-end. Also, many times I have seen how developers implement features on the front-end just following the standard rules for a framework and think that this is enough to successfully launch the project, and then the project fails. How to prevent this and what approach to choose? I have launched dozens of complex projects and during the talk we will analyze which approaches have worked for me and which have not.
Neuro-symbolic is not enough, we need neuro-*semantic*Frank van Harmelen
Neuro-symbolic (NeSy) AI is on the rise. However, simply machine learning on just any symbolic structure is not sufficient to really harvest the gains of NeSy. These will only be gained when the symbolic structures have an actual semantics. I give an operational definition of semantics as “predictable inference”.
All of this illustrated with link prediction over knowledge graphs, but the argument is general.
UiPath Test Automation using UiPath Test Suite series, part 4DianaGray10
Welcome to UiPath Test Automation using UiPath Test Suite series part 4. In this session, we will cover Test Manager overview along with SAP heatmap.
The UiPath Test Manager overview with SAP heatmap webinar offers a concise yet comprehensive exploration of the role of a Test Manager within SAP environments, coupled with the utilization of heatmaps for effective testing strategies.
Participants will gain insights into the responsibilities, challenges, and best practices associated with test management in SAP projects. Additionally, the webinar delves into the significance of heatmaps as a visual aid for identifying testing priorities, areas of risk, and resource allocation within SAP landscapes. Through this session, attendees can expect to enhance their understanding of test management principles while learning practical approaches to optimize testing processes in SAP environments using heatmap visualization techniques
What will you get from this session?
1. Insights into SAP testing best practices
2. Heatmap utilization for testing
3. Optimization of testing processes
4. Demo
Topics covered:
Execution from the test manager
Orchestrator execution result
Defect reporting
SAP heatmap example with demo
Speaker:
Deepak Rai, Automation Practice Lead, Boundaryless Group and UiPath MVP
Smart TV Buyer Insights Survey 2024 by 91mobiles.pdf91mobiles
91mobiles recently conducted a Smart TV Buyer Insights Survey in which we asked over 3,000 respondents about the TV they own, aspects they look at on a new TV, and their TV buying preferences.
Transcript: Selling digital books in 2024: Insights from industry leaders - T...BookNet Canada
The publishing industry has been selling digital audiobooks and ebooks for over a decade and has found its groove. What’s changed? What has stayed the same? Where do we go from here? Join a group of leading sales peers from across the industry for a conversation about the lessons learned since the popularization of digital books, best practices, digital book supply chain management, and more.
Link to video recording: https://bnctechforum.ca/sessions/selling-digital-books-in-2024-insights-from-industry-leaders/
Presented by BookNet Canada on May 28, 2024, with support from the Department of Canadian Heritage.
Epistemic Interaction - tuning interfaces to provide information for AI supportAlan Dix
Paper presented at SYNERGY workshop at AVI 2024, Genoa, Italy. 3rd June 2024
https://alandix.com/academic/papers/synergy2024-epistemic/
As machine learning integrates deeper into human-computer interactions, the concept of epistemic interaction emerges, aiming to refine these interactions to enhance system adaptability. This approach encourages minor, intentional adjustments in user behaviour to enrich the data available for system learning. This paper introduces epistemic interaction within the context of human-system communication, illustrating how deliberate interaction design can improve system understanding and adaptation. Through concrete examples, we demonstrate the potential of epistemic interaction to significantly advance human-computer interaction by leveraging intuitive human communication strategies to inform system design and functionality, offering a novel pathway for enriching user-system engagements.
Epistemic Interaction - tuning interfaces to provide information for AI support
Geomorphological Mapping Using Remote Sensing and GIS A Tool for Land Use Planning Around Shivpuri City, M.P., India
1. IOSR Journal of Computer Engineering (IOSRJCE)
ISSN: 2278-0661 Volume 5, Issue 1 (Sep-Oct. 2012), PP 28-30
www.iosrjournals.org
www.iosrjournals.org 28 | Page
Geomorphological Mapping Using Remote Sensing and GIS
A Tool for Land Use Planning Around Shivpuri City, M.P., India
Ajay Singh Tomar1
, U.C.Singh2
1,2
(S.O.S Earth Science, Jiwaji University Gwalior, M.P., India)
Abstract: Landforms on the earth surface are expensive to map or monitor. Remote Sensing observations
from space platforms provide a synoptic view of terrain on images. Satellite multispectral data have an
advantage in that the image data in various bands can be subjected to digital enhancement techniques for
highlighting contrasts in objects for improving image interpretability. Landforms are interpreted on the basis of
interpretation element keys namely such as- tone, texture, size, shape, color etc. and extract the specific
information from the false color composites LISS-III sensor images. Geomorphological units are classified on
the basis differential erosion processes. In the study area, mainly presentational hills of Vindhyan sediments and
pediments of granites are predominant landforms. Apart from these above geomorphic units, alluvial plain,
pediplain, structural hills and residual hills are mapped using IRS-ID LISS-III satellite imagery using visual
interpretation technique along with field check. Remote Sensing and GIS offers detecting, analyzing and time-
cost effective way to fulfill these goals.
Keywords– Geomorphology mapping, GIS, IRS-1D, LISS-III, Remote Sensing
I. Introduction
Now-a-days, Land use planning is important task for local and government authority to provide
suitable land for human activities in the study area so it is realized that land use planning need to be developed
in an integrated and comprehensive manner based on geomorphic study. In this study, Remote Sensing and GIS,
tools and techniques are used to identify landform, geomorphic units and area mapping because geomorphology
is the base of land use planning.
II. Study Area
The area under study lies between 25°20’-25°30’ degrees latitude and 77°35’-77°45’ degrees longitude
and falls in SOI toposheet number 54G/11 covering total area of approximately- 309 sq. km and height from the
mean sea level is 521.5m. It forms a part of Shivpuri district which is bounded on the north and south by
Gwalior and Guna districts of M.P. respectively, on the east by Jhansi district (U.P.), and on the west by Kota
district of Rajasthan Figure 2.1.
Figure I: location map of the study area with irs-1d liss-III (24th
january, 2006) image
III. Data Used And Methodology
NRSA (National Remote Sensing Agency, Hyderabad) collected the IRS-1D LISS-III data (24th
January, 2006) in digital form and topographic map 54G/11 at scale 1:50,000 published by Survey of India
(SOI) have been utilized. Digital data registered with SOI toposheet and identified different
hydrogeomorphological units, mapping with image interpretation techniques, digital image processing, exiting
geology and geomorphology map using Erdas 8.6 and ArcGIS 9.0 and verified with GCPs collection.
2. Geomorphological Mapping Using Remote Sensing And GISA Tool For Land Use Planning Around
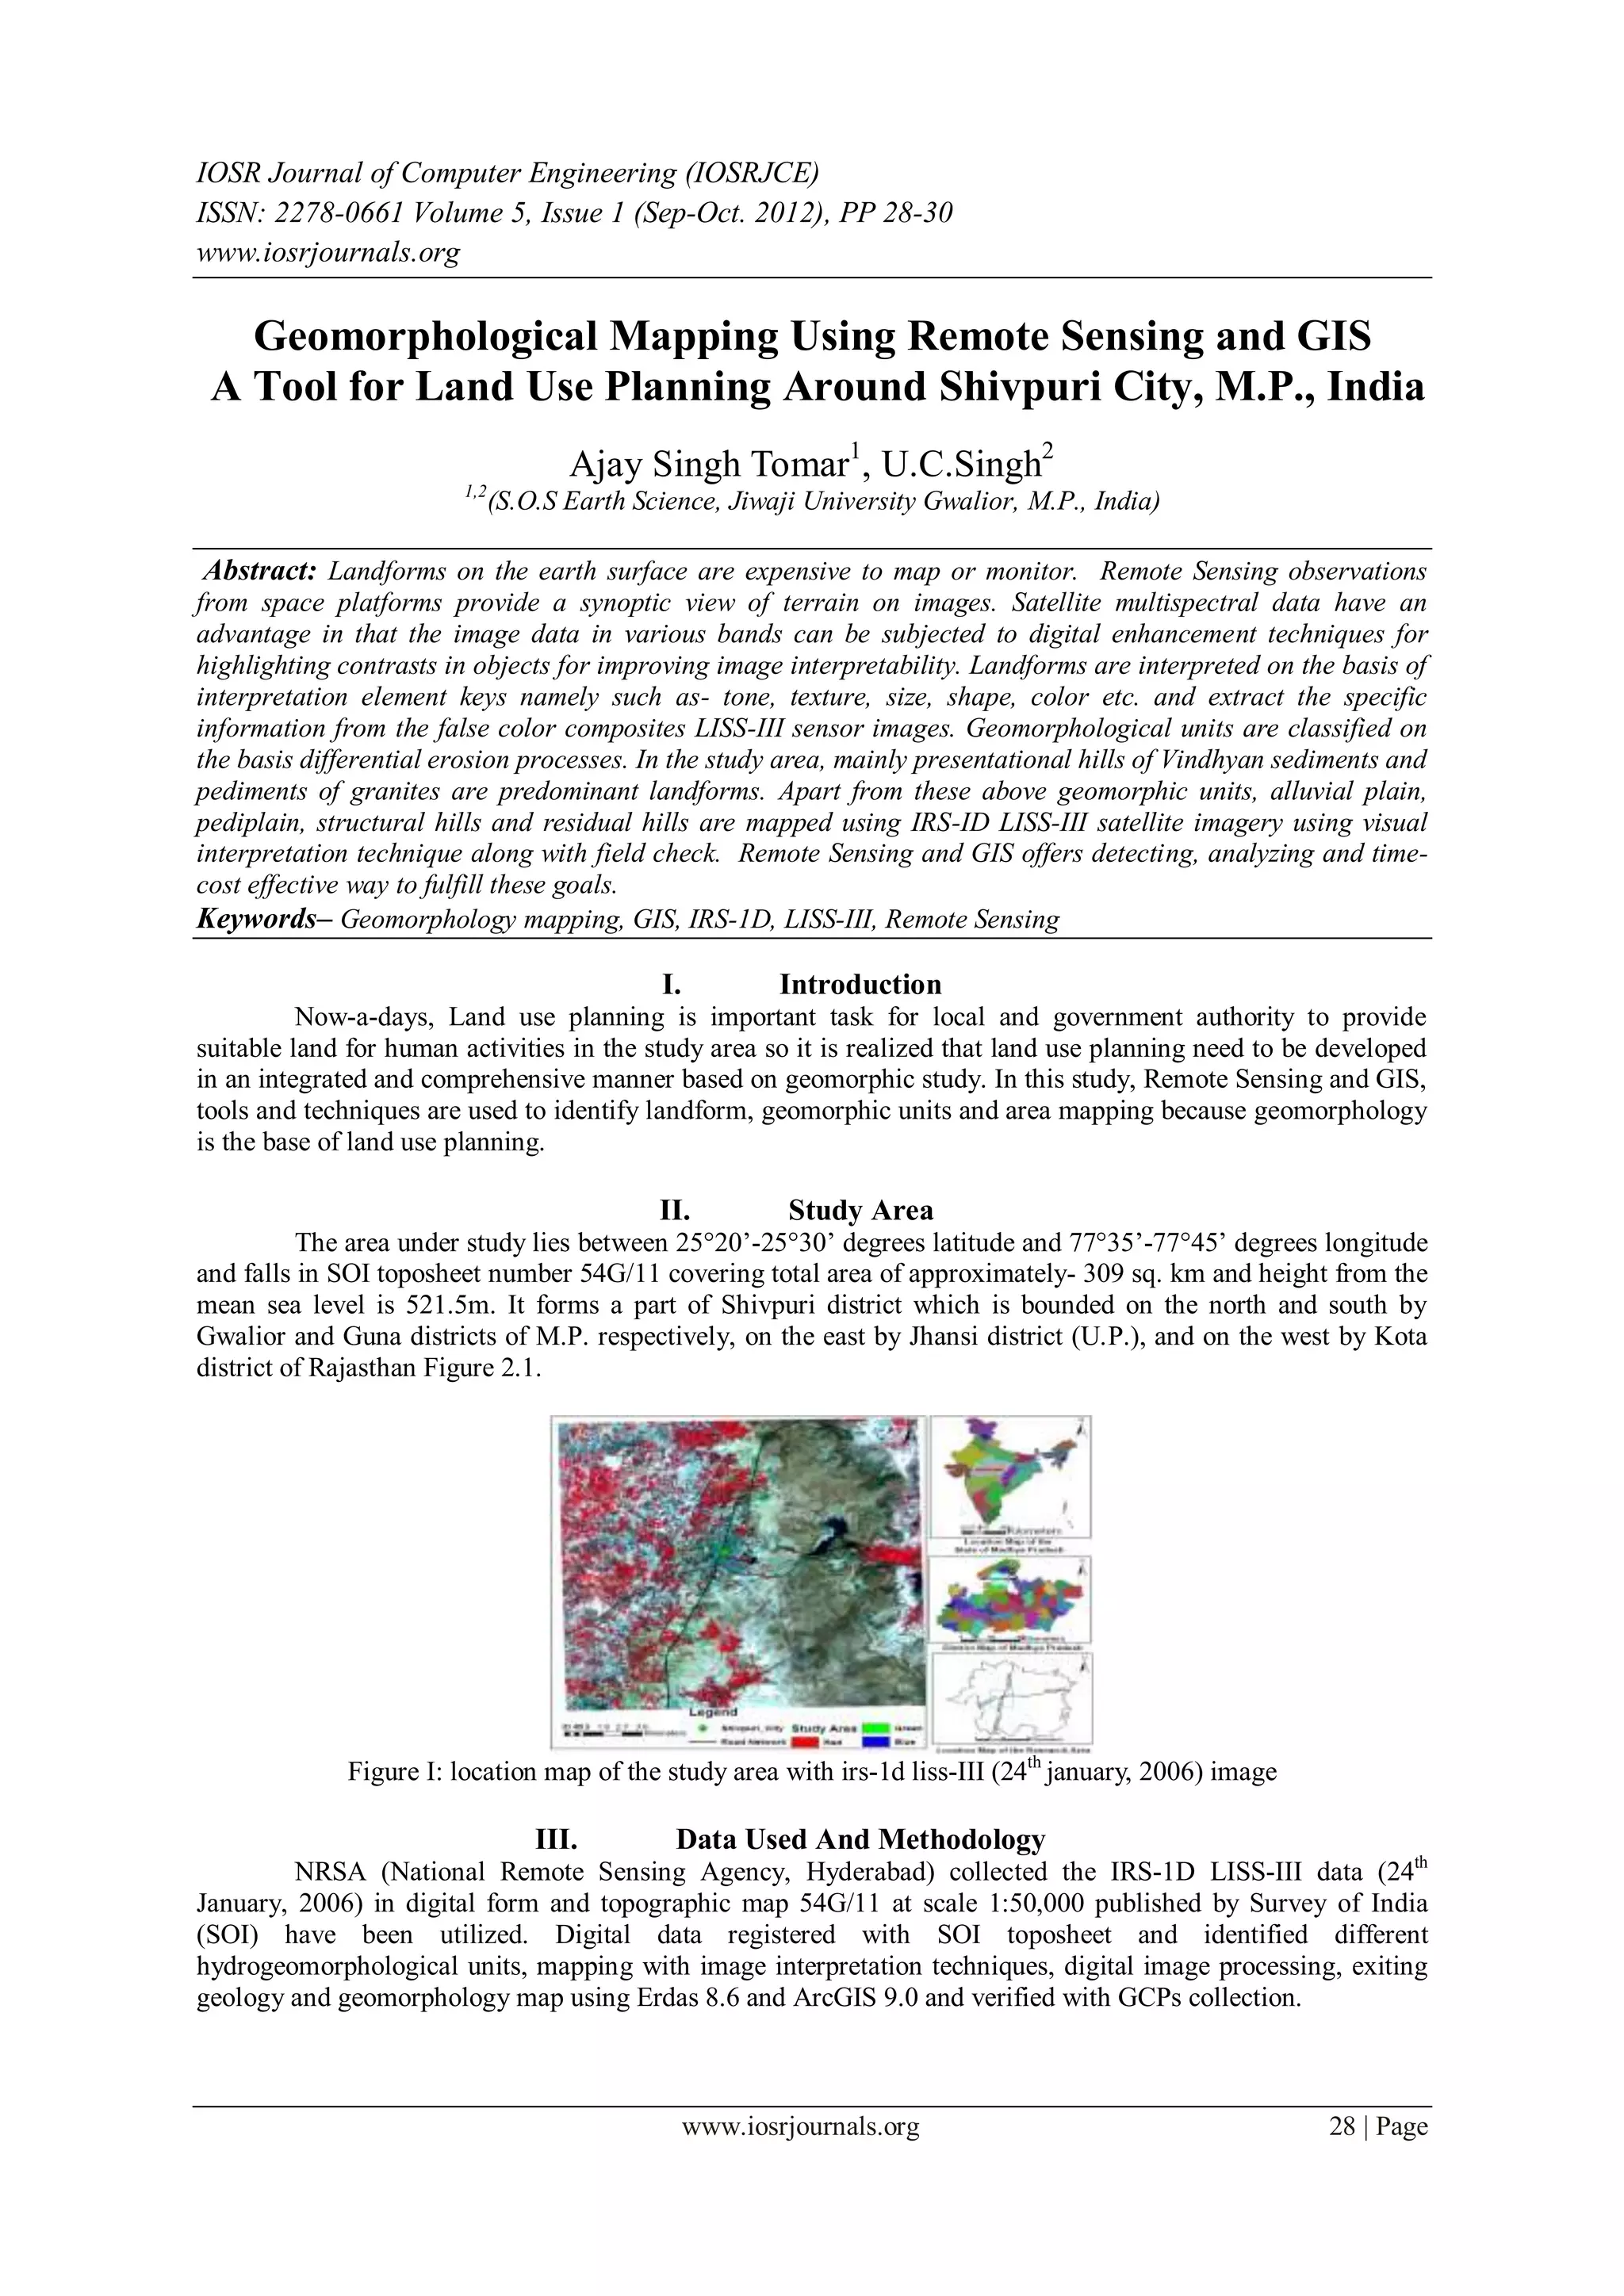
www.iosrjournals.org 29 | Page
IV. Results And Discussion
The earth’s surface forms are primarily due to hypogene or endogenous processes. Geomorphology is
the science and study of landforms on the earth. Both the disciplines are exhaustively covered in literature [1].
Today, all land use planning processes in most of the countries are based on geomorphological units [2]. The
shivpuri city is the smallest area, for development of land use; all planning should be based on the character of
the geomorphological environment of study area. Geomorphology unit are dynamic in nature as they are
affected by various human activities, including the expansion of cultivated and irrigated lands, industrialization,
urbanization and others because it need to monitoring, mapping for land use planning [3]. Geomorphic units are
classified on the basis of differential erosion processes [4]. Mainly denudational hills of Vindhyan sediments
and pediments of granites are predominant landforms.
Figure II: geomorphological map of the study area
Geomorphic
Units
Denudatio
nal Hills
Structur
al Hills
Residual
Hills
Pediment Pediplain Alluvial
Plain
LISS-III
(2006) Area
(sq.km)
66.341 37.330 18.571 27.272 27.194 132.292
Table 1: geomorphic units
IV.I Denudational Hills
Denudational hills are the massive hills with resistant rock bodies that are formed due to differential
erosional and weathering processes [4]. These hills are composed of Vindhyan sediments which are fractured,
jointed having no soil cover moderate to steep slope. On the satellite image, these landforms were identified by
light or dark brownish with mix green color due to thick forest cover. Denudational hills occupying eastern and
western portions of the study area cover about 66 66.341sq.km in geomorphic maps (Fig. 2) and (Table 1).
IV.II Structural Hills
Structural hills are representing the geologic structures such as- bedding, joint, lineaments etc [5]. in
the study area. They are located in the eastern parts of the study area having greenish and reddish tone with
rough texture on the satellite image. Approximately, the area under structural hills covers 37.330sq.km in
geomorphic maps (Fig. 2) and (Table 1).
IV.III Residual Hill
Residual Hills Are The End Products Of The Process Of Pediplanation, Which Reduces The Original
Mountain Masses Into A Series Of Scattered Knolls Standing On The Pediplains [5]. Residual Hills Occur As
Small Hills Comprise Of More Resistant Formations Formed Due To Differential Erosion Are Found In The
Western And South Western Portions Of The Study Area. In The Imageries, These Features Occur As Dark
Greenish Brown Patches With Forest Cover. The Cover An Area 18.571 Sq.Km In Geomorphic Maps (Fig. 2)
And (Table 1).
IV. IV Pediment
In The Study Area, Pediments Are Gently Sloping Areas Or Erosional Surface Of Bed Rock.
Pediments May Or May Not Be Covered By A Thin Layer Of Alluvium And Are Mostly Developed At The
Foot Of The Hills Occuring Along The Eastern Margin And In The Southern Portion Of The Study Area. These
Landforms Are Showing Light Greenish Color And Fine Texture. It Covers An Area Of 27.272 Sq.Km In
Geomorphic Maps (Fig. 2) And (Table 1).
3. Geomorphological Mapping Using Remote Sensing And GISA Tool For Land Use Planning Around
www.iosrjournals.org 30 | Page
IV.V Pediplain
Pediplains are formed due to intensive weathering under semi arid climatic conditions, representing
final stage of the cyclic erosion [6]. These are identified in the imageries due to grey tone on false color
composite. Pediplain have developed in the western and north eastern portions of area under in investigation as
a result of continuous erosional process. It covers an area of 27.194 sq.km in geomorphic maps (Fig. 2) and
(Table 1).
IV.VI Alluvial Plain
An alluvial plain is a relatively flat landform and created by the deposition of highlands eroded due to
weathering and water flow in study area [7]. The sediment from the hills is transported to the lower plain over a
long period of time. It identified on the imageries dark reddish moderate to fine texture due to agriculture
activities. Alluvial deposits of the area constitute gravel, sand, silt or clay sized unconsolidated material. It
covers an area of 132.292 sq.km in the central and western portions of geomorphic maps (Fig. 2) and (Table 1).
IV.VII GIS Layer Generation and Analysis
A GIS is an automated tool for efficient storage, analysis and presentation of geographically referenced
data means facilitating the creation and use of information. It aims at storage and retrieval of all types of data at
a particular location in space and identifying data needs acquisition of data, management, processing and
decision making [8]. In the present study, various thematic geomorphic units namely are pediment, pediplain,
alluvial plain, residual hills, structural hills and denudational hills have been generated.
V. Conclusion
The approach and results discussed in this paper. Land use planning is continuous process due to
natural and human causes. For future land use planning, it is necessary to understand the existing geomorphic
units and extents. Remote Sensing and GIS have capability to mapping geomorphic units [9]. It is provides the
large view of earth surface features on the satellite and have various tools, technique to explore the geographic
features. The geomorphic units mapped from satellite image as denudational hills majorly occupying eastern and
western portions, structural hills eastern parts, residual hills western and south western portions, pediment
eastern margin and in the southern portion, pediplain western and north eastern, alluvial plain central and
western portions of the map. Now, based on mapped geomorphic units local and government authority can make
decision to land use planning for human activities.
REFERENCES
[1]. Blaschke T., Object-based image analysis for remote sensing, ISPRS journal of Photogrammetry and Remote Sensing 65(1), 2010,
pp. 2-16.
[2]. Drăguţ, L., Blaschke, T., Automated classification of landform elements using object-based image analysis, Geomorphology, 81,
2006, pp. 330–344.
[3]. Jenson, S. K., J. Domingue. J.O., 1988. Extracting Topographic Structure from Digital Elevation Data for Geographic Information
System Analysis. Photogrammetric Engineering and Remote Sensing 54, pp. 1593-1600.
[4]. Yokoyama R, Shirasawa M., Pike R.J., Visualizing topography by openness: a new application of image processing to digital
elevation models, Photogrammetric Engineering and Remote Sensing, 68, 2002, pp. 257-265.
[5]. Mith M. J., Clark C. D., Methods for the Visualization of Digital Elevation Models for Landform Mapping, Earth Surface
Processes and Landforms, Vol. 30, 2005, Pages 885 – 900.
[6]. Krishnamurthy J and Srinivas G, Role of geological and geomorphological factors in groundwater exploration: a study using IRS
LISS data, International Journal of Remote Sensing 16(14), 1995, pp 2595–2618.
[7]. Kalluri, S.; Gilruth, P.; Bergman, R. The potential of remote sensing data for decision makers at the state, local and tribal level:
experiences from NASA’s Synergy program, Environmental Science Policy 6, 2003, 487-500.
[8]. Jaiswal RK, Krishnamurthy J, Mukhergee S, Regional study for mapping the natural resource prospects & Problem zones using
remote sensing and GIS, Geocarto International 20 (3), 2005, 21-31.
[9]. G. P. Obi Reddy, A. K. Maji, Dleineation and characterization of geomorphological features in a part of lower maharahstra
metamorphic plateau using IRS-ID LISS-III Data, Journal of the Indian Society of Remote Sensing, Volume 31, Issue 4, 2003, pp
241-250.