Download as PDF, PPTX
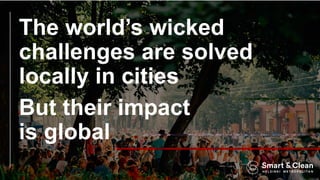
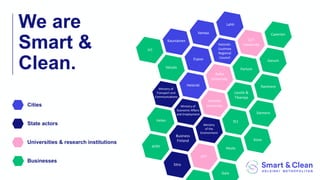
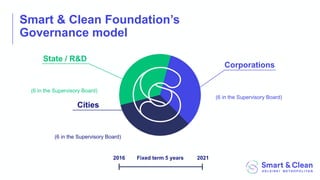
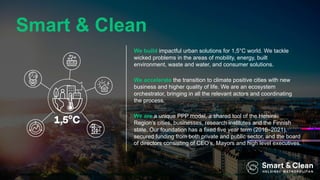
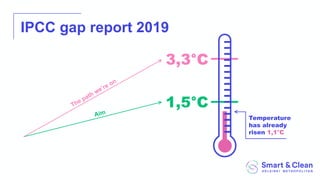
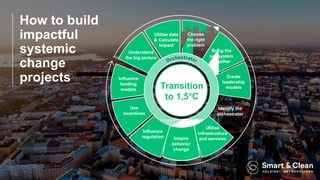
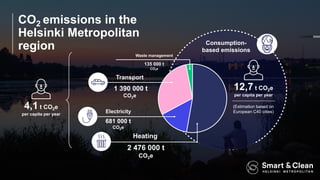

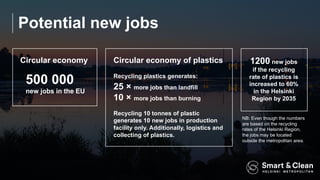
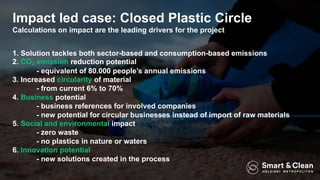

The document outlines the Smart & Clean Foundation's initiatives aimed at creating impactful urban solutions to address climate change and achieve carbon neutrality by 2035, particularly in the Helsinki metropolitan area. It emphasizes collaboration among various stakeholders, including cities, universities, businesses, and government bodies, to tackle systemic challenges in mobility, energy, waste, and water management. The foundation's approach involves utilizing data to inform decisions, incentivizing change, and fostering innovation to reduce consumption-based emissions and enhance recycling efforts.


