Downloaded 163 times
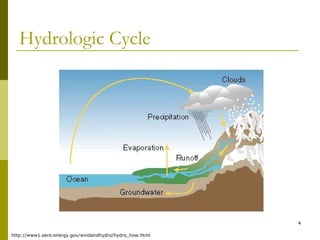
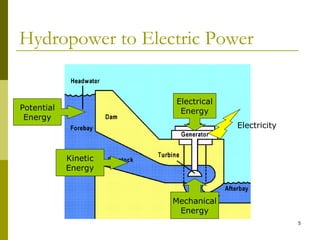
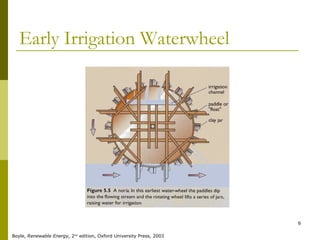


This document provides an overview of hydropower, including its history, design, types of installations, and efficiency. It discusses the hydrologic cycle, turbine designs, and various scales of hydropower projects, alongside considerations of environmental impacts and economics. The future of hydropower is also addressed, indicating potential for untapped resources.