![Thank You For further details or clarifications, you may contact: Pinaki Bhadury [email_address]](https://image.slidesharecdn.com/cogen-v3-1229524685883347-1/85/Cogeneration-30-320.jpg)

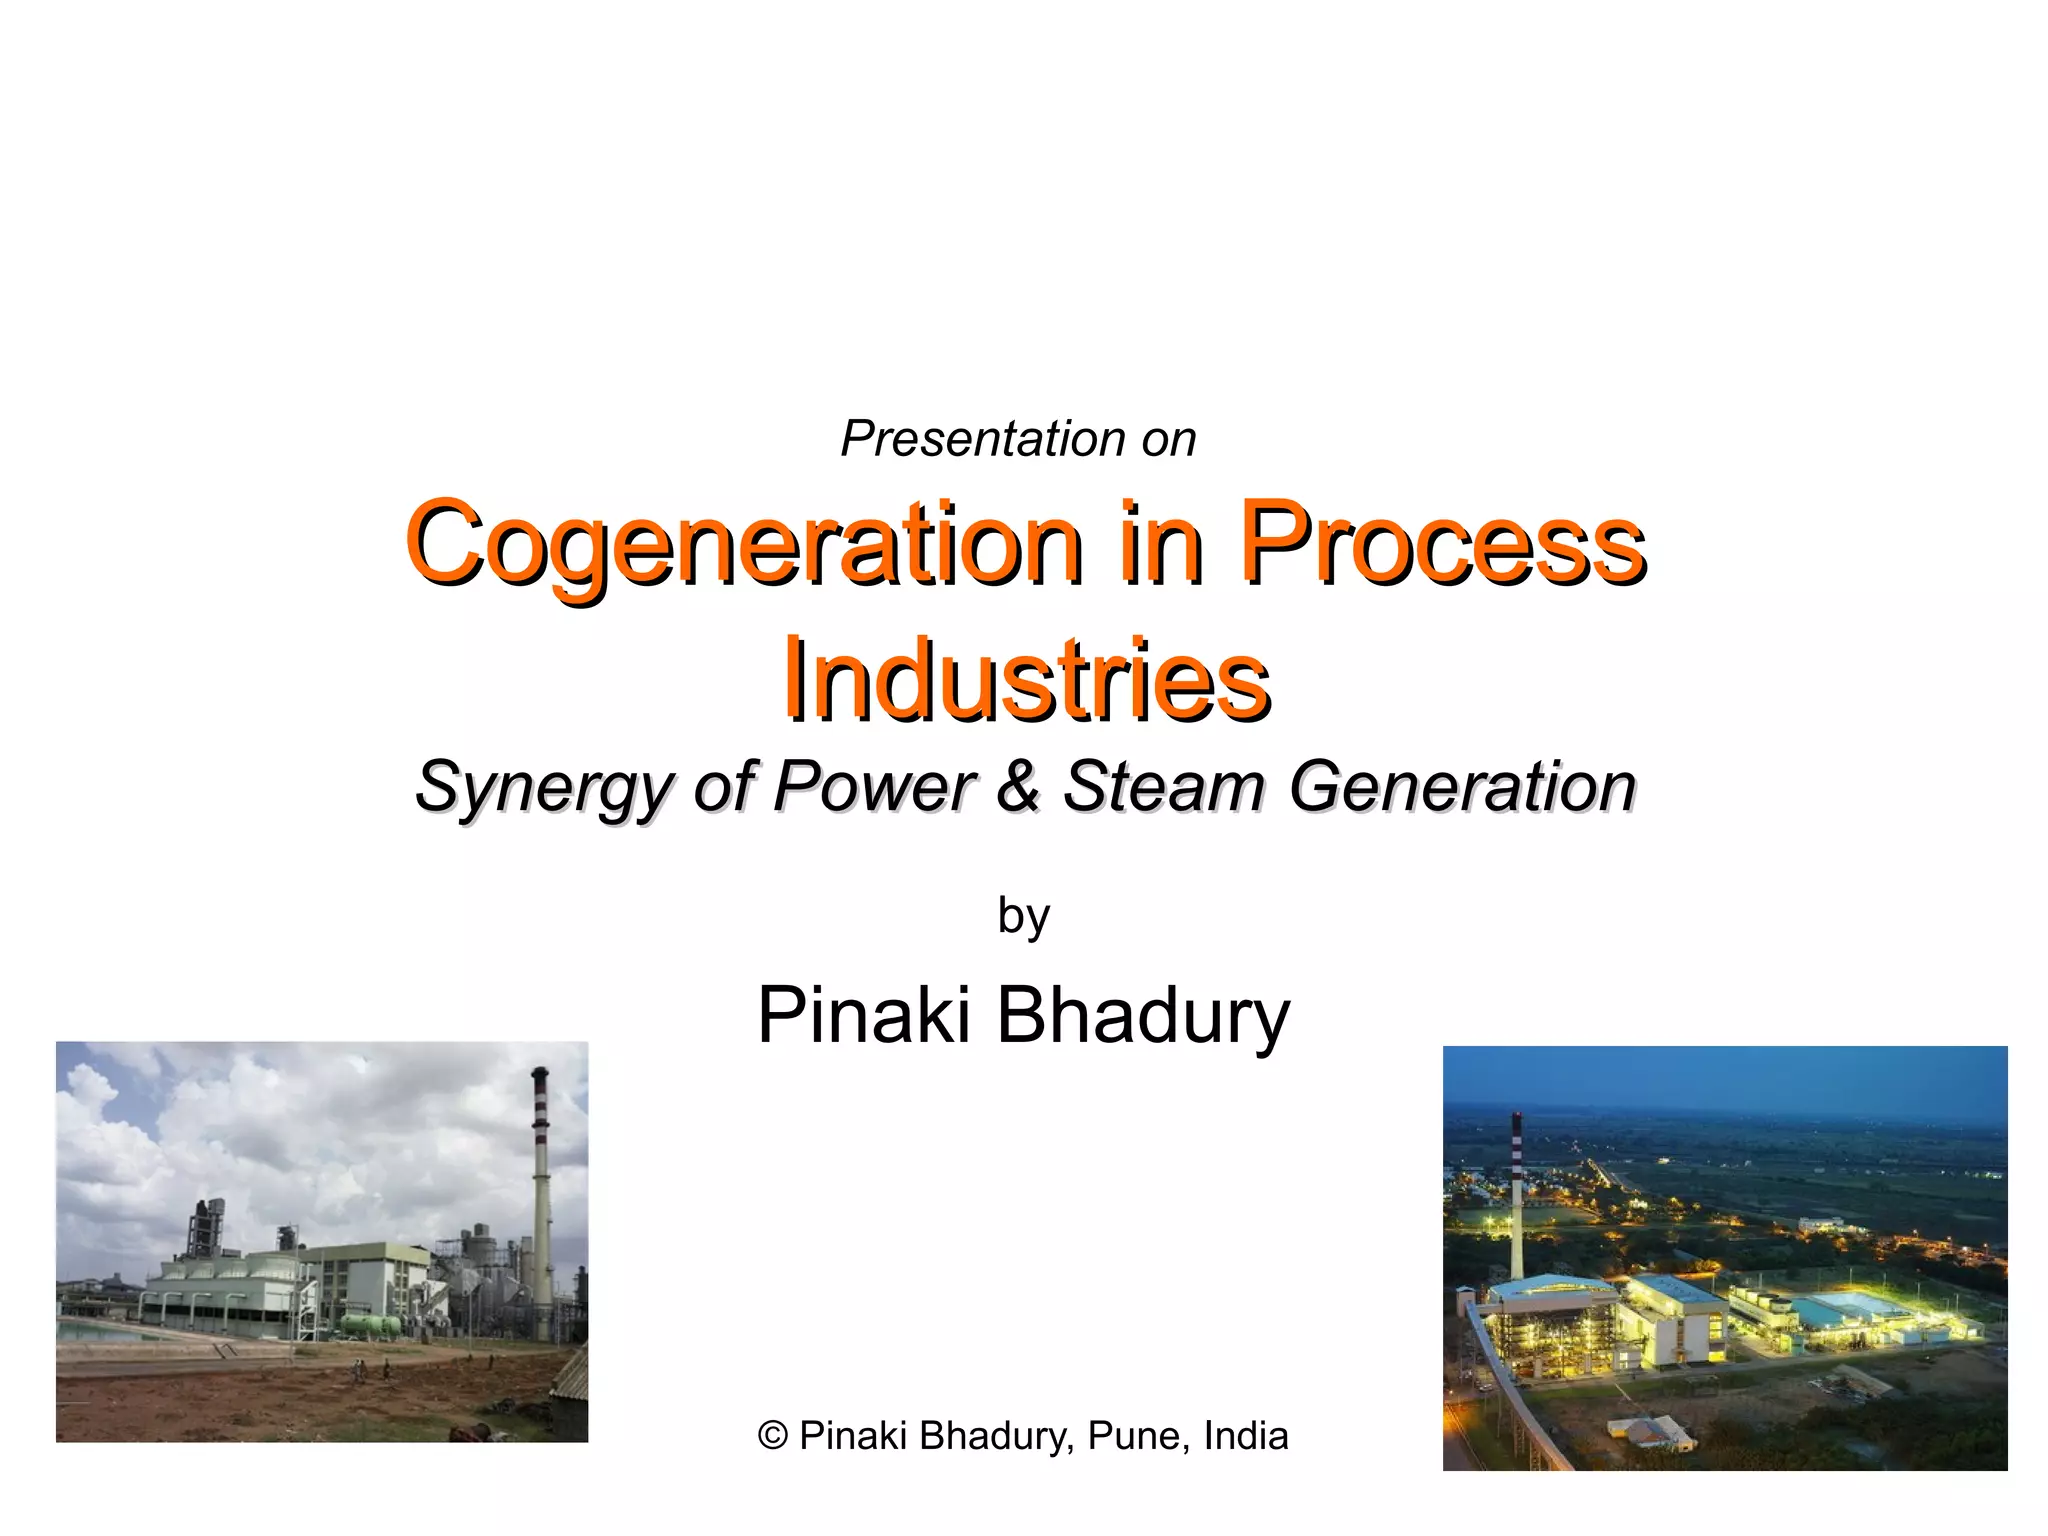
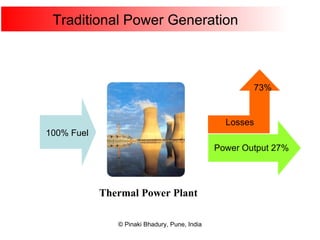
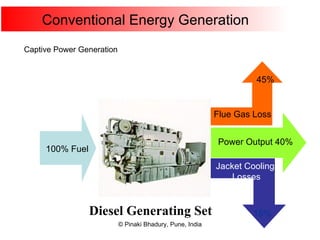
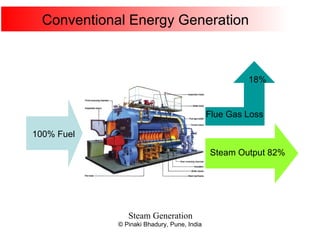
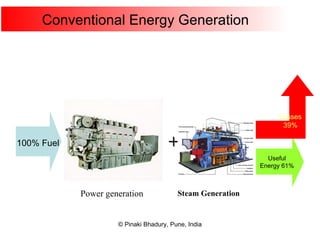
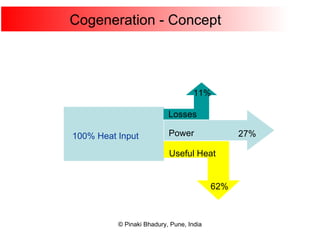
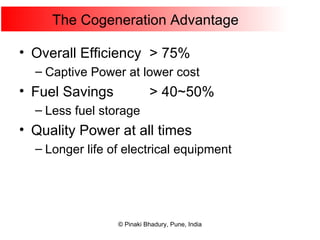
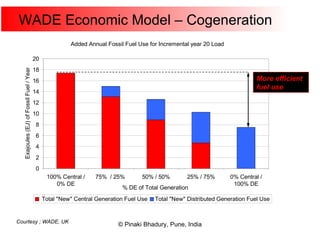
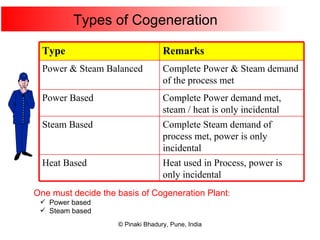
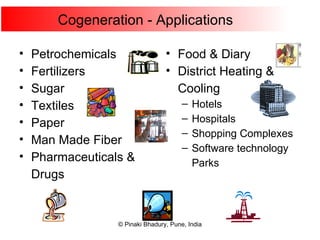
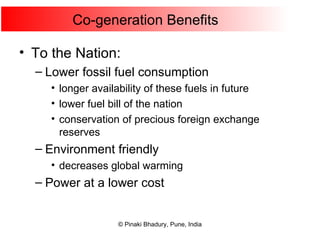
Cogeneration, or combined heat and power (CHP), involves generating electricity and useful thermal energy from a single fuel source. This is more efficient than separate generation of power and heat, with overall efficiencies potentially over 75%. Cogeneration can reduce fuel costs by 40-50% and lower carbon dioxide emissions. It provides reliable, lower cost power for industrial processes and other applications like district heating. Widespread adoption of cogeneration could cut India's fuel use and greenhouse gas emissions significantly.