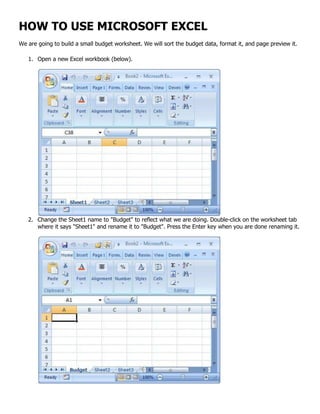
This document provides instructions for using basic functions in Microsoft Word and Excel. In Word, it describes how to open a new document, save files in different formats, change fonts and formatting. In Excel, it shows how to create a budget worksheet by adding categories and amounts, formatting as currency, using auto-sum to calculate totals, and adding columns for additional months with formulas to calculate percentage changes.
With this post you can:
Create a Power Point
Change the theme of the presentation
Add text
Add pictures
Animate the transitions between screens
and how to view your Power Point in a slide show
A supplemental PowerPoint to the Excel Basics Training.
A YouTube playlist of the accompanying videos can be found here:
https://www.youtube.com/playlist?list=PLKHQ_KpQoKYbM6MgOvURFfEYaHOoh28D6
Microsoft Excel
What You Can do with MS Excel
Features of MS Excel
- Graphical Features of Excel
- Database Feature of Excel
- Functional Features of Excel
How to Access MS Excel on Your System
The Excel Workbook
The Excel Ribbon
Command Overview of different tabs of Ribbon
Quick Access Toolbar
Right Click Menu
The File Tab
Saving Workbook
Saving a File in Excel
Saving New Changes in Excel
Assignment
This is a guide to PowerPoint 2007 that I created for staff INSET. It covers lots of things from the very basics to the more complex features of the developer tab. I spent a while on this so I thought I would share in case anyone else would find this use
I 70 over SR 0481 Phase 1 Girder Erection PhotosPete Quinn
Phase 1 Girders of I-70 over S.R. 0481 Erected. Tunstall Engineering Group (TEG) prepared the erection plan for Century Steel for the 172’ single span steel girder bridge over S.R. 0481. Completed over two nights, the girders (84,000 lbs) were delivered by truck on the existing bridge then picked with cranes. A 200 Ton and 500 Ton crane were set behind the abutments. TEG checked the girders for stability and picking. We also designed the bracing, rigging and checked the crane layouts.
Kubernetes & AI - Beauty and the Beast !?! @KCD Istanbul 2024Tobias Schneck
As AI technology is pushing into IT I was wondering myself, as an “infrastructure container kubernetes guy”, how get this fancy AI technology get managed from an infrastructure operational view? Is it possible to apply our lovely cloud native principals as well? What benefit’s both technologies could bring to each other?
Let me take this questions and provide you a short journey through existing deployment models and use cases for AI software. On practical examples, we discuss what cloud/on-premise strategy we may need for applying it to our own infrastructure to get it to work from an enterprise perspective. I want to give an overview about infrastructure requirements and technologies, what could be beneficial or limiting your AI use cases in an enterprise environment. An interactive Demo will give you some insides, what approaches I got already working for real.
JMeter webinar - integration with InfluxDB and GrafanaRTTS
Watch this recorded webinar about real-time monitoring of application performance. See how to integrate Apache JMeter, the open-source leader in performance testing, with InfluxDB, the open-source time-series database, and Grafana, the open-source analytics and visualization application.
In this webinar, we will review the benefits of leveraging InfluxDB and Grafana when executing load tests and demonstrate how these tools are used to visualize performance metrics.
Length: 30 minutes
Session Overview
-------------------------------------------
During this webinar, we will cover the following topics while demonstrating the integrations of JMeter, InfluxDB and Grafana:
- What out-of-the-box solutions are available for real-time monitoring JMeter tests?
- What are the benefits of integrating InfluxDB and Grafana into the load testing stack?
- Which features are provided by Grafana?
- Demonstration of InfluxDB and Grafana using a practice web application
To view the webinar recording, go to:
https://www.rttsweb.com/jmeter-integration-webinar
Slack (or Teams) Automation for Bonterra Impact Management (fka Social Soluti...Jeffrey Haguewood
Sidekick Solutions uses Bonterra Impact Management (fka Social Solutions Apricot) and automation solutions to integrate data for business workflows.
We believe integration and automation are essential to user experience and the promise of efficient work through technology. Automation is the critical ingredient to realizing that full vision. We develop integration products and services for Bonterra Case Management software to support the deployment of automations for a variety of use cases.
This video focuses on the notifications, alerts, and approval requests using Slack for Bonterra Impact Management. The solutions covered in this webinar can also be deployed for Microsoft Teams.
Interested in deploying notification automations for Bonterra Impact Management? Contact us at sales@sidekicksolutionsllc.com to discuss next steps.
DevOps and Testing slides at DASA ConnectKari Kakkonen
My and Rik Marselis slides at 30.5.2024 DASA Connect conference. We discuss about what is testing, then what is agile testing and finally what is Testing in DevOps. Finally we had lovely workshop with the participants trying to find out different ways to think about quality and testing in different parts of the DevOps infinity loop.
Software Delivery At the Speed of AI: Inflectra Invests In AI-Powered QualityInflectra
In this insightful webinar, Inflectra explores how artificial intelligence (AI) is transforming software development and testing. Discover how AI-powered tools are revolutionizing every stage of the software development lifecycle (SDLC), from design and prototyping to testing, deployment, and monitoring.
Learn about:
• The Future of Testing: How AI is shifting testing towards verification, analysis, and higher-level skills, while reducing repetitive tasks.
• Test Automation: How AI-powered test case generation, optimization, and self-healing tests are making testing more efficient and effective.
• Visual Testing: Explore the emerging capabilities of AI in visual testing and how it's set to revolutionize UI verification.
• Inflectra's AI Solutions: See demonstrations of Inflectra's cutting-edge AI tools like the ChatGPT plugin and Azure Open AI platform, designed to streamline your testing process.
Whether you're a developer, tester, or QA professional, this webinar will give you valuable insights into how AI is shaping the future of software delivery.
Accelerate your Kubernetes clusters with Varnish CachingThijs Feryn
A presentation about the usage and availability of Varnish on Kubernetes. This talk explores the capabilities of Varnish caching and shows how to use the Varnish Helm chart to deploy it to Kubernetes.
This presentation was delivered at K8SUG Singapore. See https://feryn.eu/presentations/accelerate-your-kubernetes-clusters-with-varnish-caching-k8sug-singapore-28-2024 for more details.
Essentials of Automations: Optimizing FME Workflows with ParametersSafe Software
Are you looking to streamline your workflows and boost your projects’ efficiency? Do you find yourself searching for ways to add flexibility and control over your FME workflows? If so, you’re in the right place.
Join us for an insightful dive into the world of FME parameters, a critical element in optimizing workflow efficiency. This webinar marks the beginning of our three-part “Essentials of Automation” series. This first webinar is designed to equip you with the knowledge and skills to utilize parameters effectively: enhancing the flexibility, maintainability, and user control of your FME projects.
Here’s what you’ll gain:
- Essentials of FME Parameters: Understand the pivotal role of parameters, including Reader/Writer, Transformer, User, and FME Flow categories. Discover how they are the key to unlocking automation and optimization within your workflows.
- Practical Applications in FME Form: Delve into key user parameter types including choice, connections, and file URLs. Allow users to control how a workflow runs, making your workflows more reusable. Learn to import values and deliver the best user experience for your workflows while enhancing accuracy.
- Optimization Strategies in FME Flow: Explore the creation and strategic deployment of parameters in FME Flow, including the use of deployment and geometry parameters, to maximize workflow efficiency.
- Pro Tips for Success: Gain insights on parameterizing connections and leveraging new features like Conditional Visibility for clarity and simplicity.
We’ll wrap up with a glimpse into future webinars, followed by a Q&A session to address your specific questions surrounding this topic.
Don’t miss this opportunity to elevate your FME expertise and drive your projects to new heights of efficiency.
GDG Cloud Southlake #33: Boule & Rebala: Effective AppSec in SDLC using Deplo...James Anderson
Effective Application Security in Software Delivery lifecycle using Deployment Firewall and DBOM
The modern software delivery process (or the CI/CD process) includes many tools, distributed teams, open-source code, and cloud platforms. Constant focus on speed to release software to market, along with the traditional slow and manual security checks has caused gaps in continuous security as an important piece in the software supply chain. Today organizations feel more susceptible to external and internal cyber threats due to the vast attack surface in their applications supply chain and the lack of end-to-end governance and risk management.
The software team must secure its software delivery process to avoid vulnerability and security breaches. This needs to be achieved with existing tool chains and without extensive rework of the delivery processes. This talk will present strategies and techniques for providing visibility into the true risk of the existing vulnerabilities, preventing the introduction of security issues in the software, resolving vulnerabilities in production environments quickly, and capturing the deployment bill of materials (DBOM).
Speakers:
Bob Boule
Robert Boule is a technology enthusiast with PASSION for technology and making things work along with a knack for helping others understand how things work. He comes with around 20 years of solution engineering experience in application security, software continuous delivery, and SaaS platforms. He is known for his dynamic presentations in CI/CD and application security integrated in software delivery lifecycle.
Gopinath Rebala
Gopinath Rebala is the CTO of OpsMx, where he has overall responsibility for the machine learning and data processing architectures for Secure Software Delivery. Gopi also has a strong connection with our customers, leading design and architecture for strategic implementations. Gopi is a frequent speaker and well-known leader in continuous delivery and integrating security into software delivery.
UiPath Test Automation using UiPath Test Suite series, part 4DianaGray10
Welcome to UiPath Test Automation using UiPath Test Suite series part 4. In this session, we will cover Test Manager overview along with SAP heatmap.
The UiPath Test Manager overview with SAP heatmap webinar offers a concise yet comprehensive exploration of the role of a Test Manager within SAP environments, coupled with the utilization of heatmaps for effective testing strategies.
Participants will gain insights into the responsibilities, challenges, and best practices associated with test management in SAP projects. Additionally, the webinar delves into the significance of heatmaps as a visual aid for identifying testing priorities, areas of risk, and resource allocation within SAP landscapes. Through this session, attendees can expect to enhance their understanding of test management principles while learning practical approaches to optimize testing processes in SAP environments using heatmap visualization techniques
What will you get from this session?
1. Insights into SAP testing best practices
2. Heatmap utilization for testing
3. Optimization of testing processes
4. Demo
Topics covered:
Execution from the test manager
Orchestrator execution result
Defect reporting
SAP heatmap example with demo
Speaker:
Deepak Rai, Automation Practice Lead, Boundaryless Group and UiPath MVP
Key Trends Shaping the Future of Infrastructure.pdfCheryl Hung
Keynote at DIGIT West Expo, Glasgow on 29 May 2024.
Cheryl Hung, ochery.com
Sr Director, Infrastructure Ecosystem, Arm.
The key trends across hardware, cloud and open-source; exploring how these areas are likely to mature and develop over the short and long-term, and then considering how organisations can position themselves to adapt and thrive.
Let's dive deeper into the world of ODC! Ricardo Alves (OutSystems) will join us to tell all about the new Data Fabric. After that, Sezen de Bruijn (OutSystems) will get into the details on how to best design a sturdy architecture within ODC.
GraphRAG is All You need? LLM & Knowledge GraphGuy Korland
Guy Korland, CEO and Co-founder of FalkorDB, will review two articles on the integration of language models with knowledge graphs.
1. Unifying Large Language Models and Knowledge Graphs: A Roadmap.
https://arxiv.org/abs/2306.08302
2. Microsoft Research's GraphRAG paper and a review paper on various uses of knowledge graphs:
https://www.microsoft.com/en-us/research/blog/graphrag-unlocking-llm-discovery-on-narrative-private-data/
GenAISummit 2024 May 28 Sri Ambati Keynote: AGI Belongs to The Community in O...
How to use microsoft word
1. HOW TO USE MICROSOFT WORD
The Basics
Let's start off with the toolbar. The toolbar has seven different tabs.
Home, Insert, Page Layout, References, Mailings, Review, and View.
Home: This tab is the basic word processing tools, like for example, size, font, color, style, etc. You
will find that that you're going to go here most of the time.
Insert: This tab contains more tools than the Home tab, and it's really for inserting things. They are
really helpful, and they're just not used for basic word processing. They're also used for a professional
document. Some things you can do in this tab are add clip art, add links, etc.
Page Layout: This tab is mostly there for adding the final touch to your document and fixing it a little.
You can change the orientation, the size of your document, and pretty much you can do things you
normally can't do basically.
References: This tab is for inserting references. For example, adding citations, a table of contents,
footnotes, bibliography, captions, etc.
2. Mailings: This tab is for making envelopes and labels, starting a mail merge (sending the same
document to different people),
Review: This tab is for things like spelling and grammar, translating, a dictionary, a thesaurus, adding
a comment, etc.
View: This tab has something to do with how your document looks like. It's sort of similar to Page
Layout, except it's more of adjusting things, like zoom in, zoom out, etc.
Format: This tab only applies with pictures, clip art, word art, or photos. This tab is for adjusting the
image(s) and text, like changing the brightness, contrast, effect, color, etc.
Making Your First Document
Let's go on to the part where you make your first document. Read on to find out what to do.
Open up Microsoft word and start a new blank document. You do this by clicking on the icon
that looks like a blank page with one corner turned down.
3. Begin the process by saving.
o To save, you click on the circular Microsoft Office logo in the upper left hand corner of the
window. You should see a little menu pop-up with multiple options.
o Leave the cursor over the words Save As. You should always do Save As when you're making
a new document. It gives you the option of what kind of document you want it to be, where
you're going to save it, and what the name of the document will be.
4. o Up will pop a window.
There are many different kinds of file type options. Click on Word 97-2003 Document or
Word Document. Word 97-2003 Document allows other people to see it, even if they have older
versions of Word and haven't installed the Office 2007 Compatibility Pack, while if you use Word
Document, only people that have Word 2007 or the Compatibility Pack can open it. Either one is a
good choice.
5. If this is your first time using Microsoft Word Office 2007, create a new folder for your
documents. Just type something like "Sample Documents" or something you want to name it.
After you're done creating a folder and saving the document, go back to the empty
document. Choose a font that you think is a style you like. Some suggested fonts are Times New
Roman, Calibri (Body), and Arial. The picture below shows you an example of what to do.
Type what you needed to type.
6. Save a document
To save a document in the format used by Word 2010 and Word 2007, do the following:
1. Click the File tab.
2. Click Save As.
3. In the File name box, enter a name for your document.
4. Click Save.
To save a document so that it is compatible with Word 2003 or earlier, do the following:
1. Open the document that you want to be used in Word 2003 or earlier.
2. Click the File tab.
3. Click Save As.
4. In the Save as type list, click Word 97-2003 Document. This changes the file format to .doc.
5. In the File name box, type a name for the document.
6. Click Save.
Read documents
1. Open the document that you want to read.
2. On the View tab, in the Document Views group, click Full Screen Reading
3. To move from page to page in a document, do one of the following:
Click the arrows in the lower corners of the pages.
Press PAGE DOWN and PAGE UP or SPACEBAR and BACKSPACE on the keyboard.
Click the navigation arrows at the top center of the screen.
Tip Click View Options, and then click Show Two Pages to view two pages, or screens, at a
time.
7. For more information about how to view documents, see Read documents in Word.
Top of Page
Track changes and insert comments
To turn on change tracking, on the Review tab, in the Tracking group, click Track Changes.
To insert a comment, on the Review tab, in the Comments group, click New Comment.
For more information about how to track changes made while revising, see Track changes and insert
comments.
Top of Page
Print your document
1. Click the File tab and then click Print.
2. Do the following:
Under Print, in the Copies box, enter the number of copies that you want to print.
Under Printer, make sure that the printer that you want is selected.
Under Settings, the default print settings for your printer are selected for you. If you want to change
a setting, click the setting you want to change and then select the setting that you want.
3. When you are satisfied with the settings, click Print.
http://www.wikihow.com/Use-Microsoft-Office-Word-2007
http://office.microsoft.com/en-001/word-help/basic-tasks-in-word-2010-HA101830016.aspx
8. HOW TO USE MICROSOFT EXCEL
We are going to build a small budget worksheet. We will sort the budget data, format it, and page preview it.
1. Open a new Excel workbook (below).
2. Change the Sheet1 name to "Budget" to reflect what we are doing. Double-click on the worksheet tab
where it says "Sheet1" and rename it to "Budget". Press the Enter key when you are done renaming it.
9. 3. In column A create a column header called "Category", and in column B create a header called
"Amount". Enter the budget categories and amounts that you see in the image below. Add a "Total"
row in cell A11.
4. Let's format the amounts to make them look like money. Make sure the Home ribbon is selected and
look for the Number group. Locate the Accounting Number Format icon within that group. Click the
Accounting Number Format icon.
10. 5. Select cell B10 where the formula for the total Amount is going to go. On the Home ribbon look for the
Editing group. Locate the AutoSum icon within that group. Click the AutoSum icon.
6. The AutoSum function =SUM(B2:B9) appears in the the formula bar and in cell B10. Notice that Excel
correctly guesses the range you want in the formula. Press the Enter key to finish adding the Sum
formula.
11. 7. This is what it looks like:
8. We want to insert a new row above row 1 in order to indicate that column B is for January. We will add
more columns for more months. Select row 1. Right click and click the Insert option to insert a new
row above row 1. Row 1 becomes row 2. Enter January in cell B1, February in cell C1, Amount in cell
C2. Enter some amounts for the categories in cells C3:C10. Autosum the column total in cell C11.
Format the cells with the Accounting Number Format icon. This is what it should look like:
12. 9. We're going to calculate the percent change between Frebruary and January. Enter "% Change" in cell
D1. In cell D3 enter the formula for the % change. To do this, step-by-step, start by entering an equals
(=) sign. Remember all formulas start with an equals sign. Next, enter a left parenthesis (. With your
mouse, select cell C3. Enter a minus sign (-). With your mouse, select cell B3. Enter a right
parenthesis, then the divisor sign - the forward slash (/). Finally, with your mouse, select cell B3 and
press the Enter key. The formula should look like =(C3-B3)/B3. While you could have entered the
formula directly through the keyboard e.g. typing in the cell addresses C3 and B3 instead of selecting
celss C3 and B3, I recommend that you select the cells to add the cell addresses to the formula. This
technique eliminates the possibility of typing the cell adress incorrectly, and this technique is used in
other worksheet functions, where you select a range with the mouse, as part of the formula.
10. Unfortunately Excel guesses wrongly and formats cell D3 as Accounting Number. Select cell D3. Locate
and click the % format icon in the Number group on the Home ribbon. With cell D3 selected still, hover
the mouse over the fill handle of cell D3. The fill handle is in the lower right hand corner of teh cell and
it is a small black square. Once the mouse is over the fill handle, the cursor changes from the default,
wide plus sign to a cross-hair cursor. Left-click, hold, and drag down to cell D11 and let go. This is
what it should look like:
http://www.useexcel.com/excel2007commontasks.aspx