Download to read offline


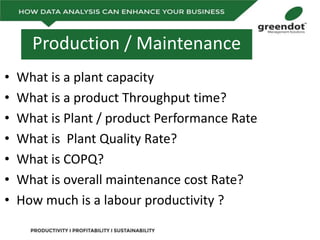
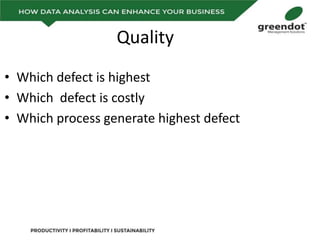

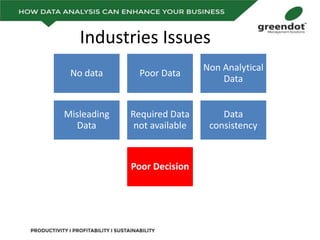

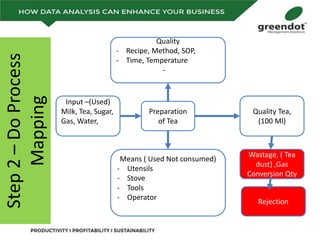


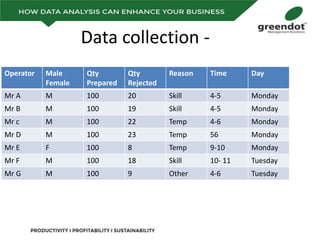
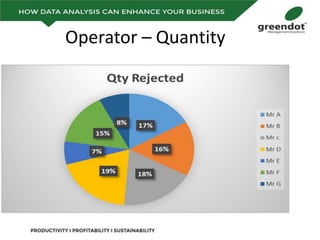


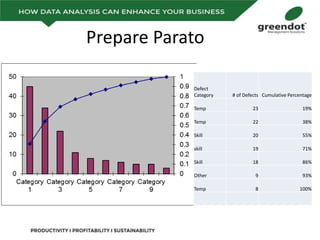


The document outlines a comprehensive review of key performance metrics in marketing, sales, production, and quality management, including inquiries, conversion rates, and defect analysis. It emphasizes the importance of data collection and stratification for informed decision-making and problem-solving, particularly focusing on identifying process inefficiencies. Additionally, it suggests actionable steps such as improving operator skill sets and controlling variables affecting production quality.