Download to read offline


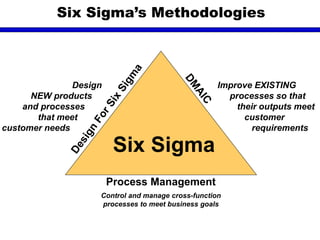

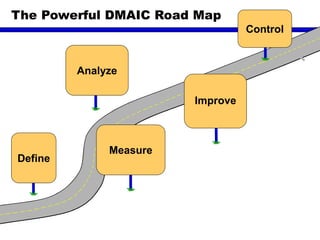

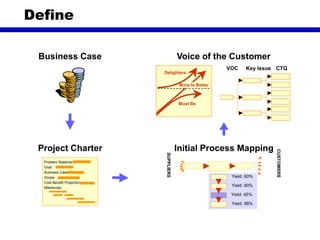

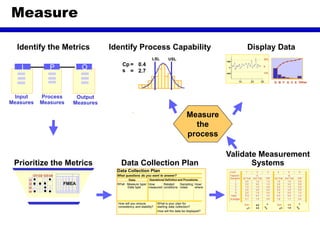
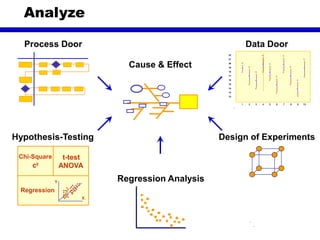
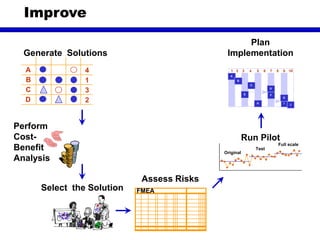


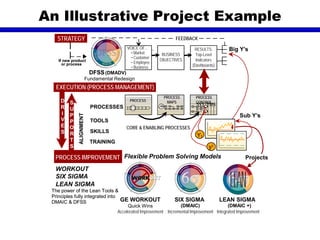
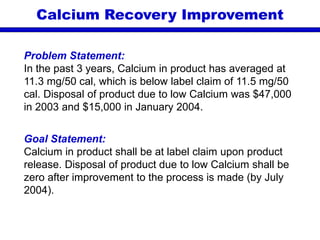
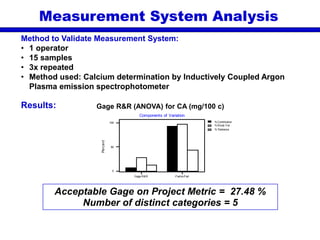
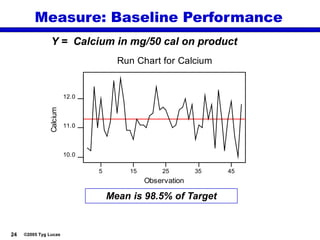
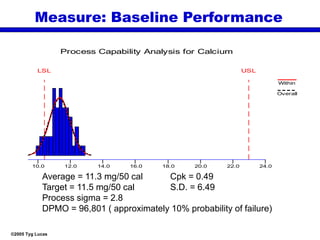
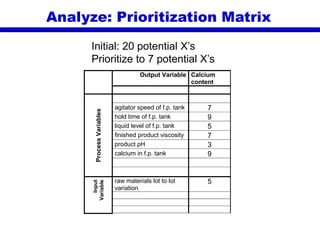
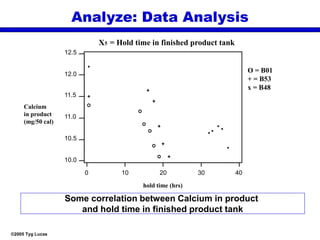

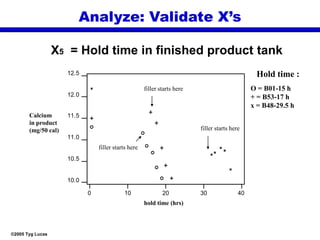
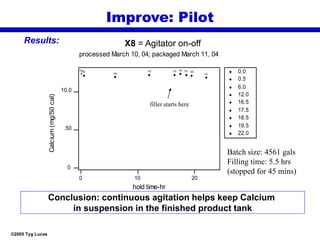


Six Sigma is a data-driven methodology for process improvement originally developed by Motorola. It involves defining a project goal, measuring key aspects of the current process, analyzing data to determine root causes of defects, improving the process by addressing causes, and controlling future process variation. The document provides an overview of Six Sigma and its development, then gives an example project summary involving improving calcium levels in a product. The project uses Six Sigma tools like process mapping, measurement systems analysis, data analysis, design of experiments, and risk analysis to select and validate factors influencing calcium and develop improvements.


![Process Capability[1]](https://cdn.slidesharecdn.com/ss_thumbnails/processcapability1-1226090261326164-9-thumbnail.jpg?width=640&height=640&fit=bounds)


