Learning Objectives
When youcomplete this chapter, you should:
Understand the concept of six sigma statistics.
Able to describe DMAIC project methodology.
Know the advantages of the methodology
4.
The SixSigma (6) is both a statistical concept that
measures the number of nonconformities in a product
or service and a quality improvement methodology.
6 is both a quality management philosophy and a
methodology that focuses on reducing variation,
measuring defects, and improving quality of products,
processes and services.
The essentials of the quality improvement
methodology are DMAIC, benefits, and organizational
structure.
4
Introduction
5.
6 systemis a comprehensive and flexible system for
achieving, sustaining and maximizing business success
by careful understanding of customer needs, use of
facts through data collection and analysis, and
improving, and re-engineering processes to increase
customer satisfaction and business excellence.
The 6σ quality means that the defect rate in the
production of each component of an assembly (e.g., a
cellular phone) will not be more than 3.4 parts per
million (ppm) opportunities.
5
Introduction
6.
The SixSigma methodology was born in 1987 in
Motorola’s communication sector as an approach to
track and compare performance against customer
requirements, and to achieve an ambitious target of
near-perfect, 6σ (or 6-sigma) quality, in the products
produced. Motorola won the Baldrige National Quality
Award in 1988.
In the 1980s, this process helped the company to
achieve significant improvement in quality.
Mid 1990’s other companies such as General Electric
and Allied Signal obtained similar results.
6
Historical Review
7.
7
Sigma, σ,is the Greek symbol for population standard
deviation, which is the best measure of variation
because the smaller the standard deviation, the less
variability in the process. If we can reduce variation
to the point that the specifications are at ±6σ, then
99.9999998% of the items are satisfactory.
Another useful measure is the capability index, Cp ,
which is the ratio of the specification tolerance (upper
specification limit minus the lower specification limit)
by 6.
Statistical Aspects
8.
Example:
Example: Population standarddeviation of
Population standard deviation of
grades of eight students
grades of eight students
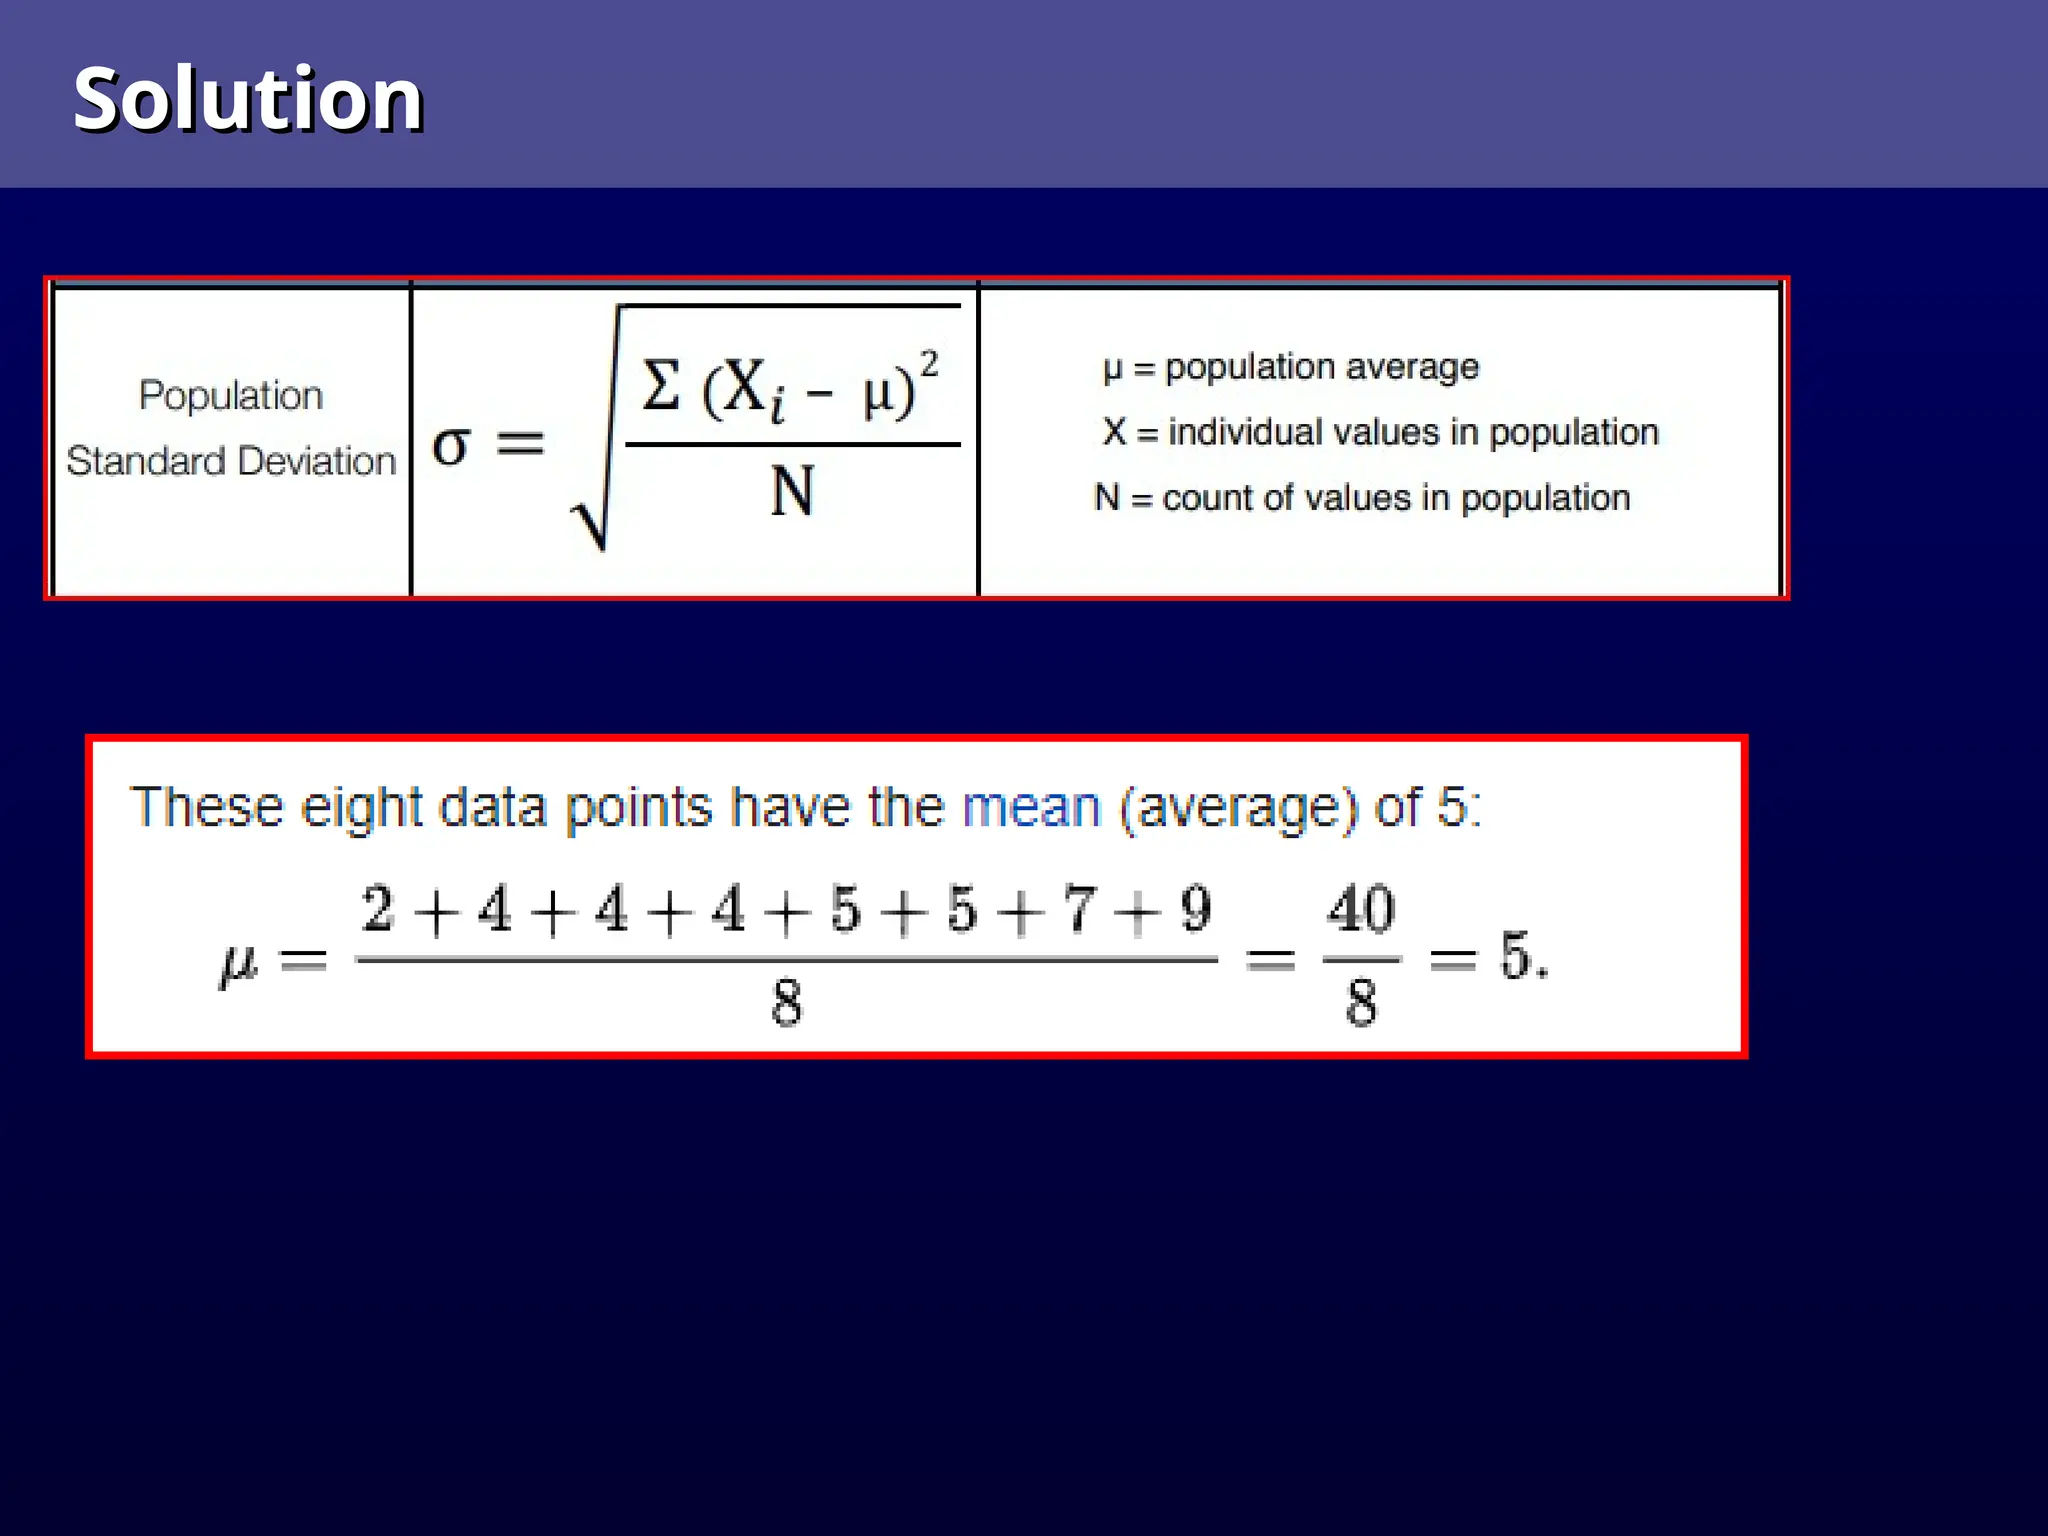
Suppose that the entire population of interest
is eight students in a particular class. For a
finite set of numbers, the population standard
deviation is found by taking the square root
of the average of the squared deviations of
the values subtracted from their average
value. The marks of a class of eight students
(that is, a statistical population) are the
following eight values:
2, 4, 4, 4, 5, 5, 7, 9
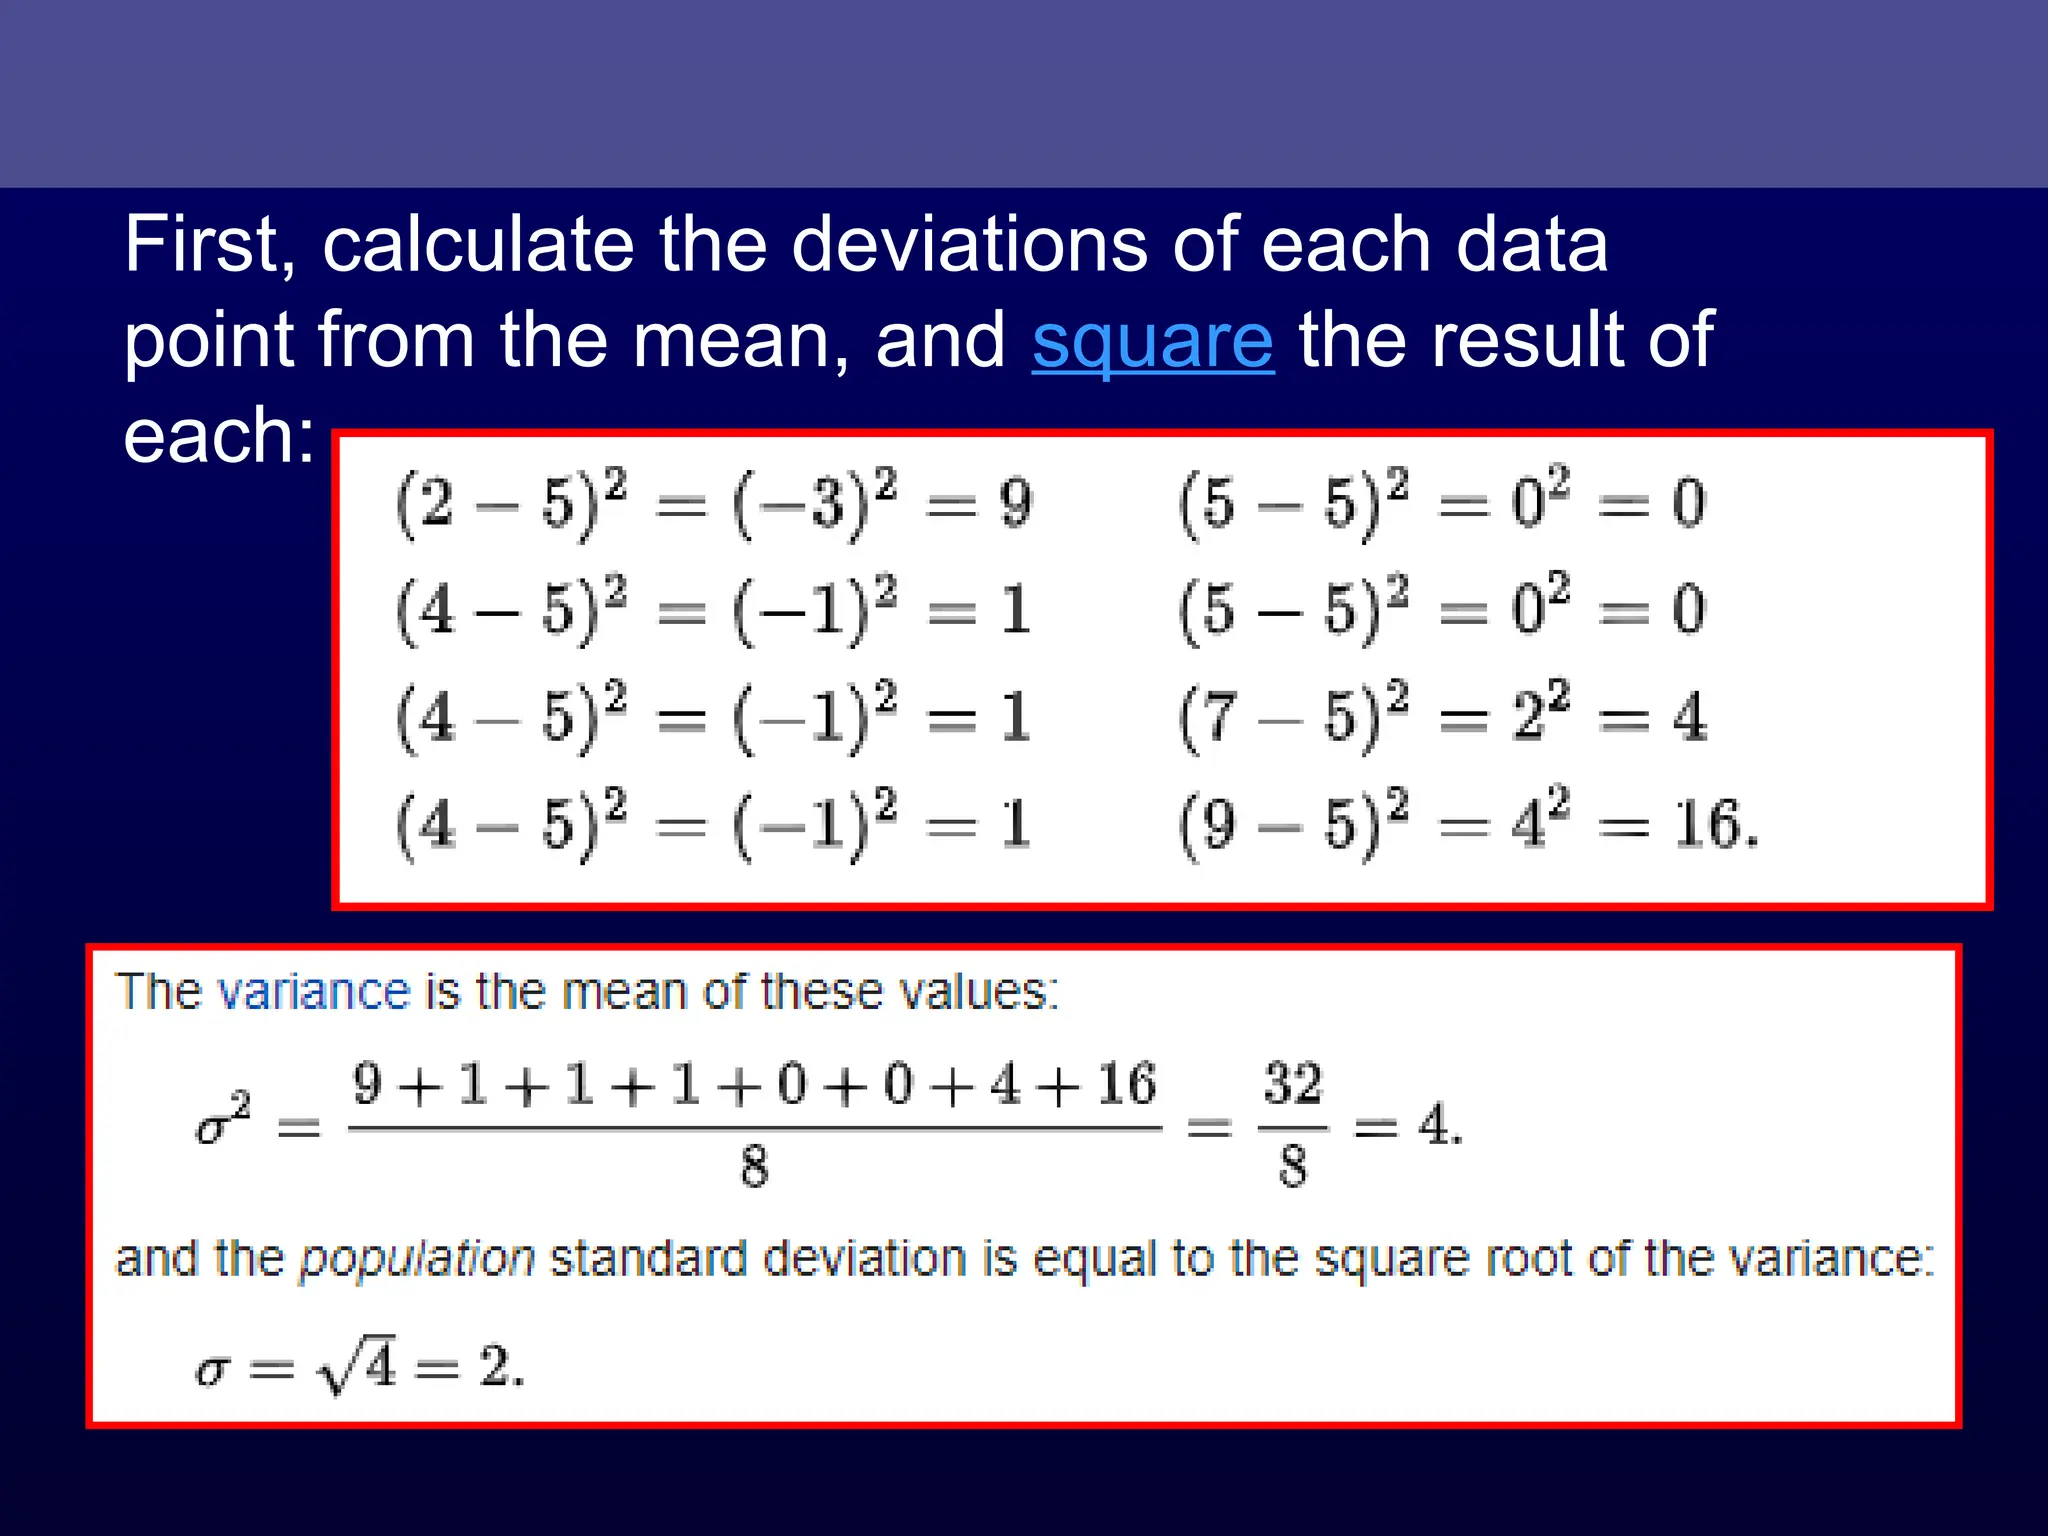
First, calculate thedeviations of each data
point from the mean, and square the result of
each:
11.
20
Statistical Aspects
TABLE 2-1Nonconformance rate and process capability
when the process is centered.
FIGURE 2-1 Nonconformance rate when process is
centered
reducing variability
3
99.73%
Occur probability:
A product: 100
independent
components
The probability of
non-defective:
0.9973100
≈
0.7631
about 23.6% of the
products produced will
be defective
12.
Example
Example
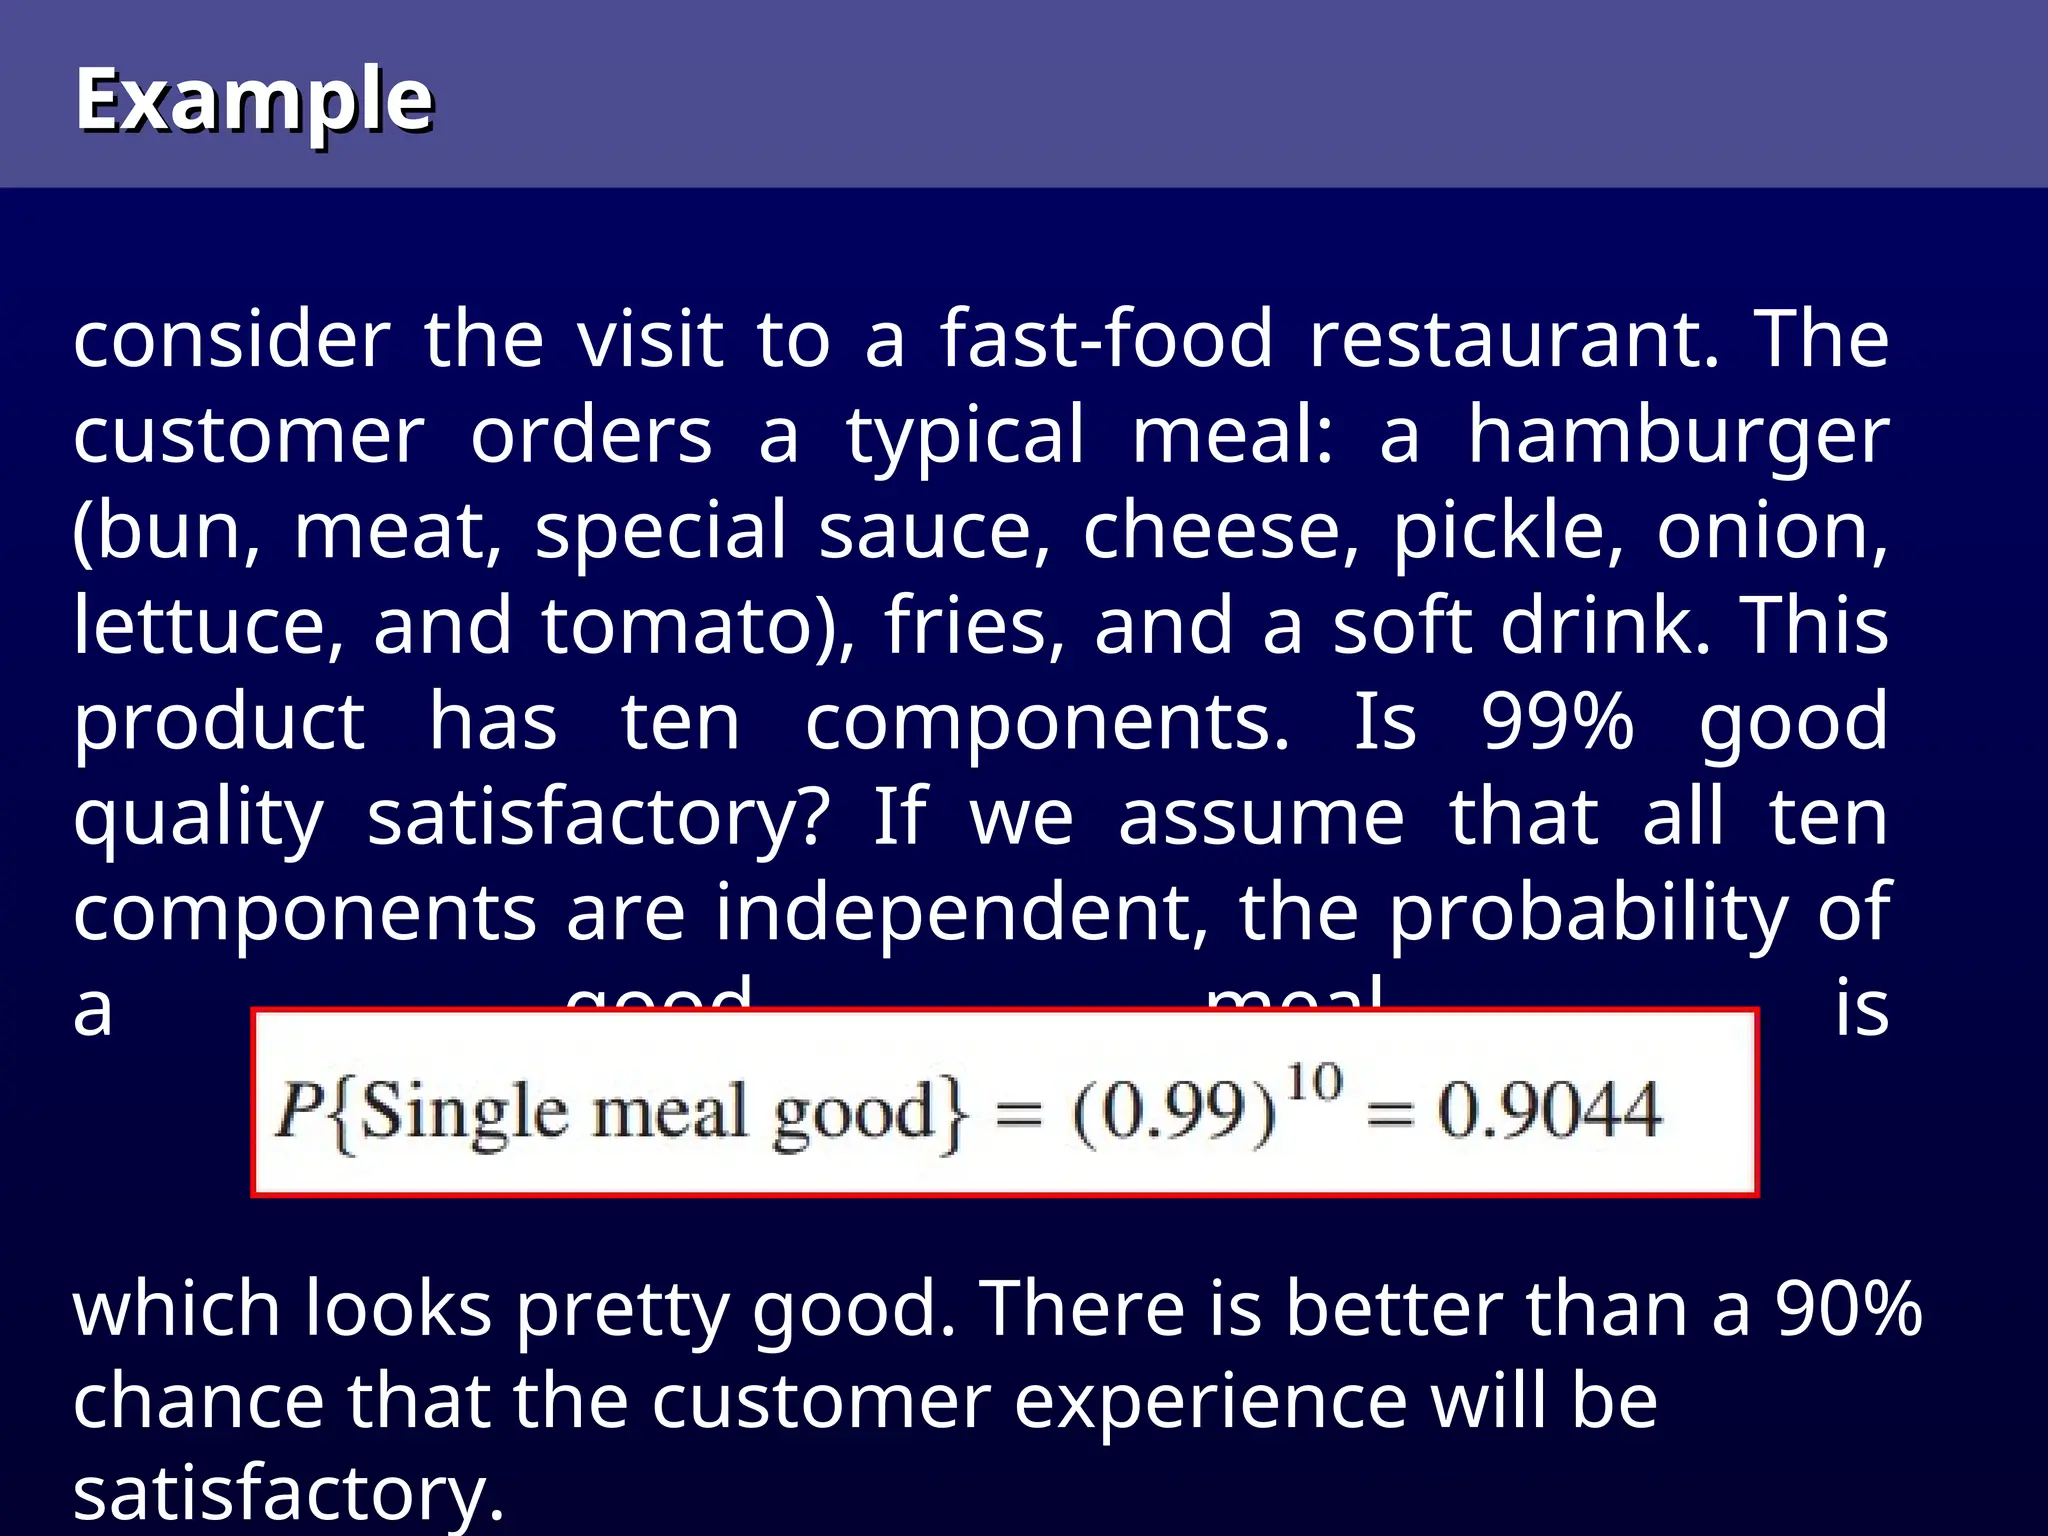
consider the visitto a fast-food restaurant. The
customer orders a typical meal: a hamburger
(bun, meat, special sauce, cheese, pickle, onion,
lettuce, and tomato), fries, and a soft drink. This
product has ten components. Is 99% good
quality satisfactory? If we assume that all ten
components are independent, the probability of
a good meal is
which looks pretty good. There is better than a 90%
chance that the customer experience will be
satisfactory.
13.
Now suppose thatthe customer is a family of four.
Again, assuming independence, the probability that
all four meals are good is
This isn’t so nice. The chances are only about two
out of three that all of the family meals are good.
14.
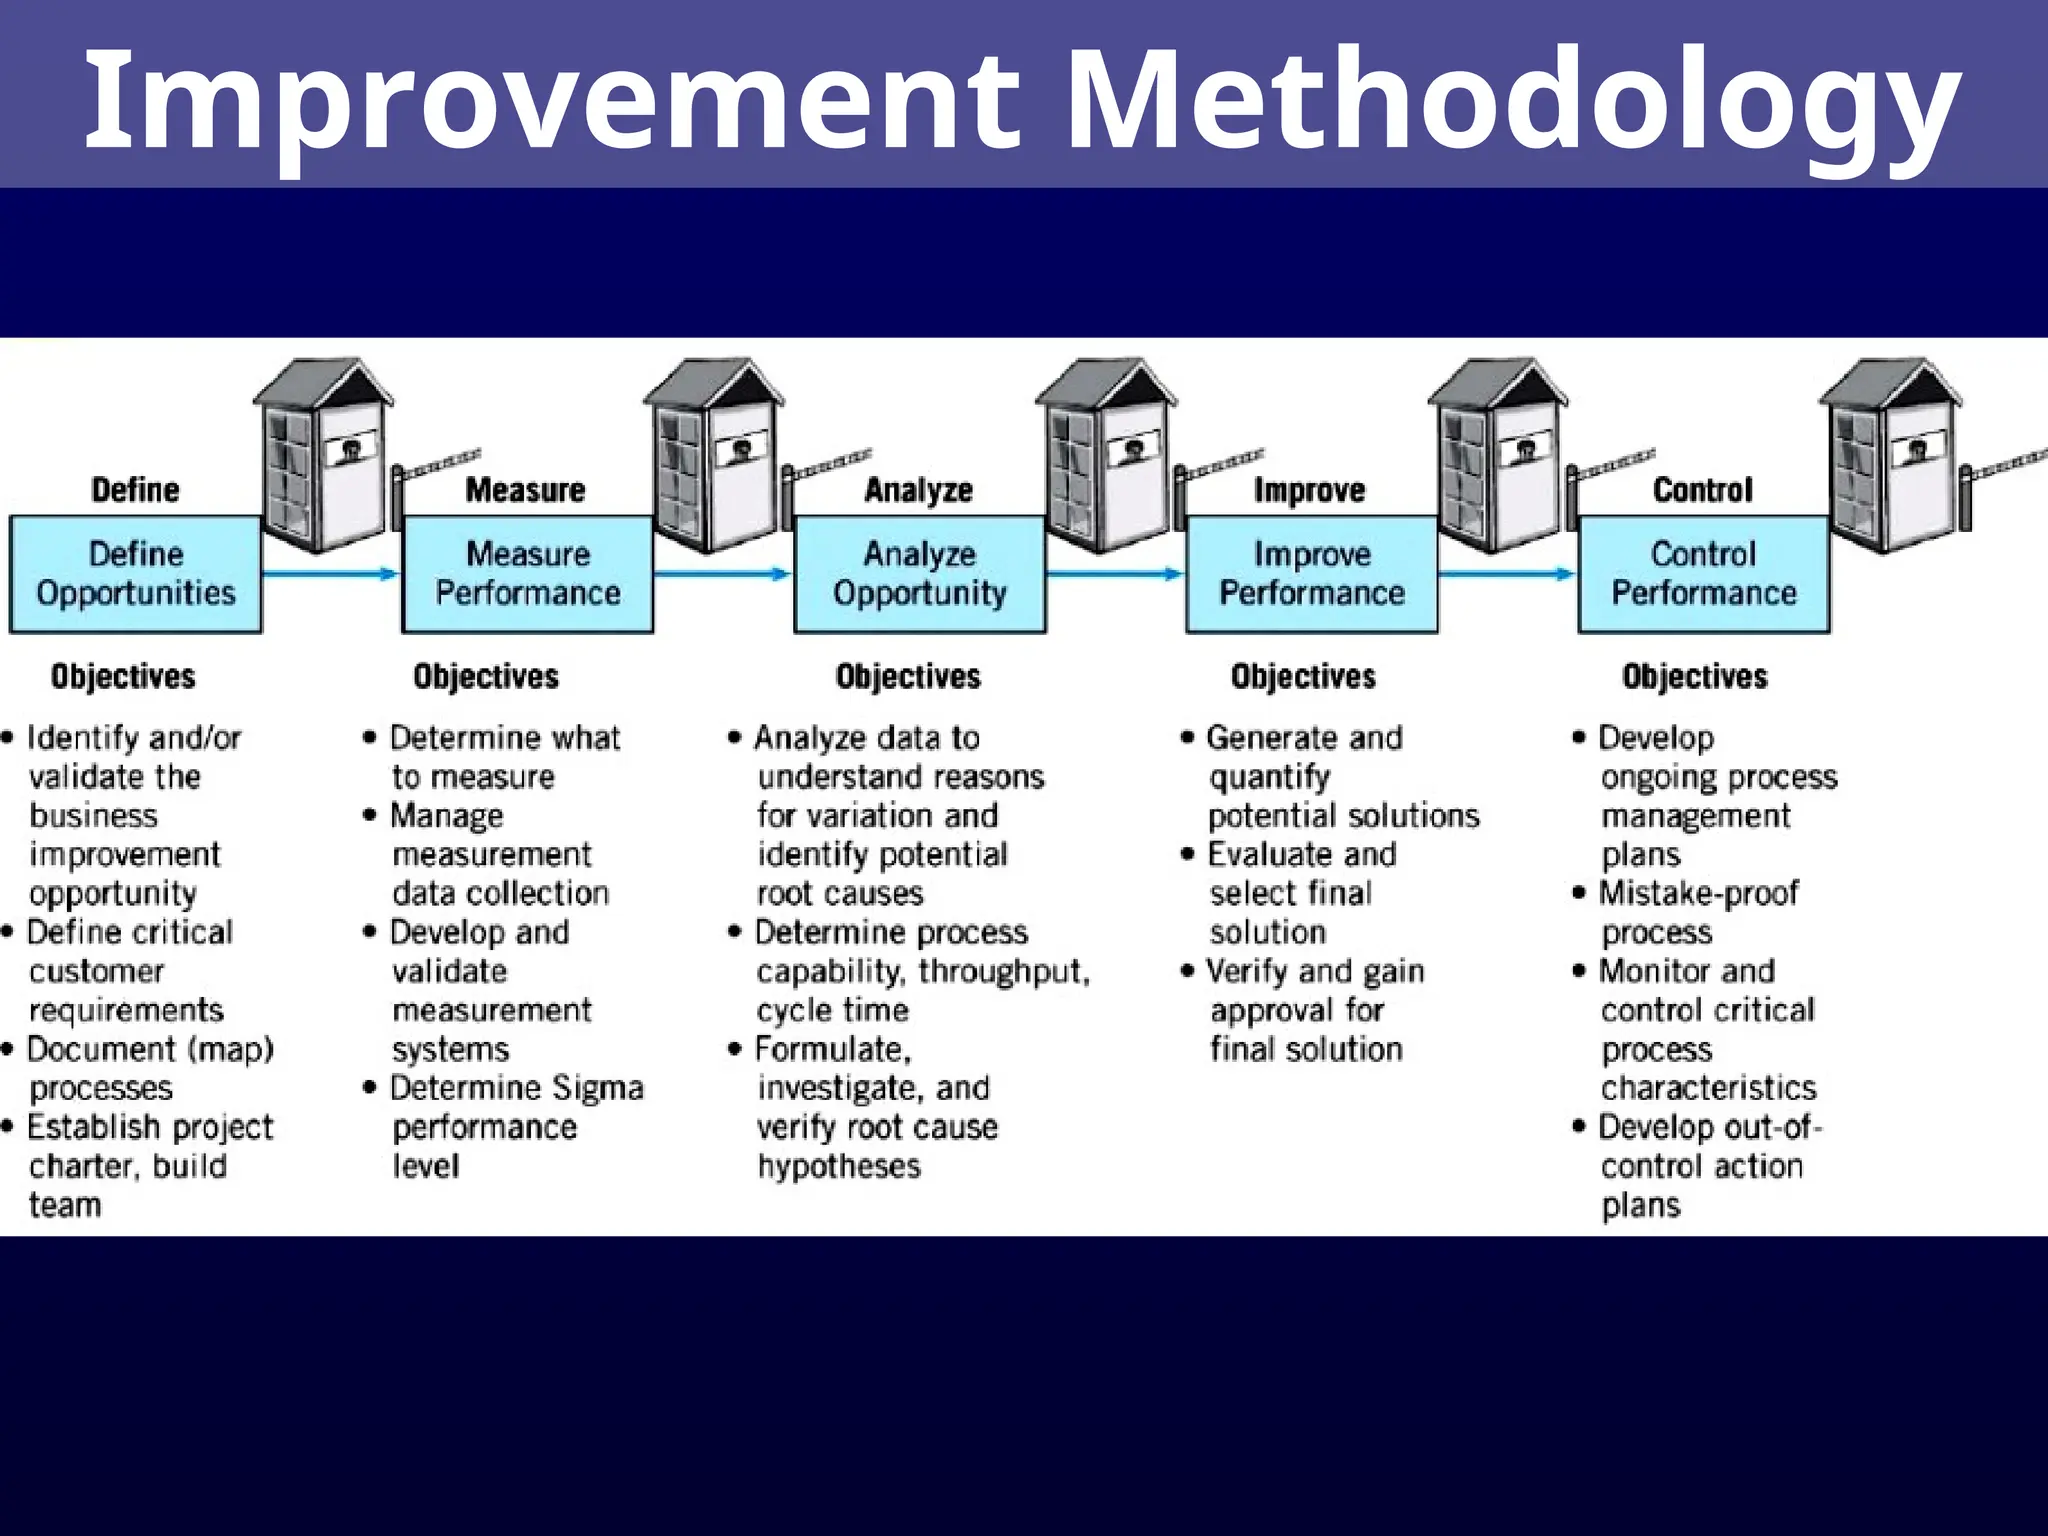
Improvement Methodology
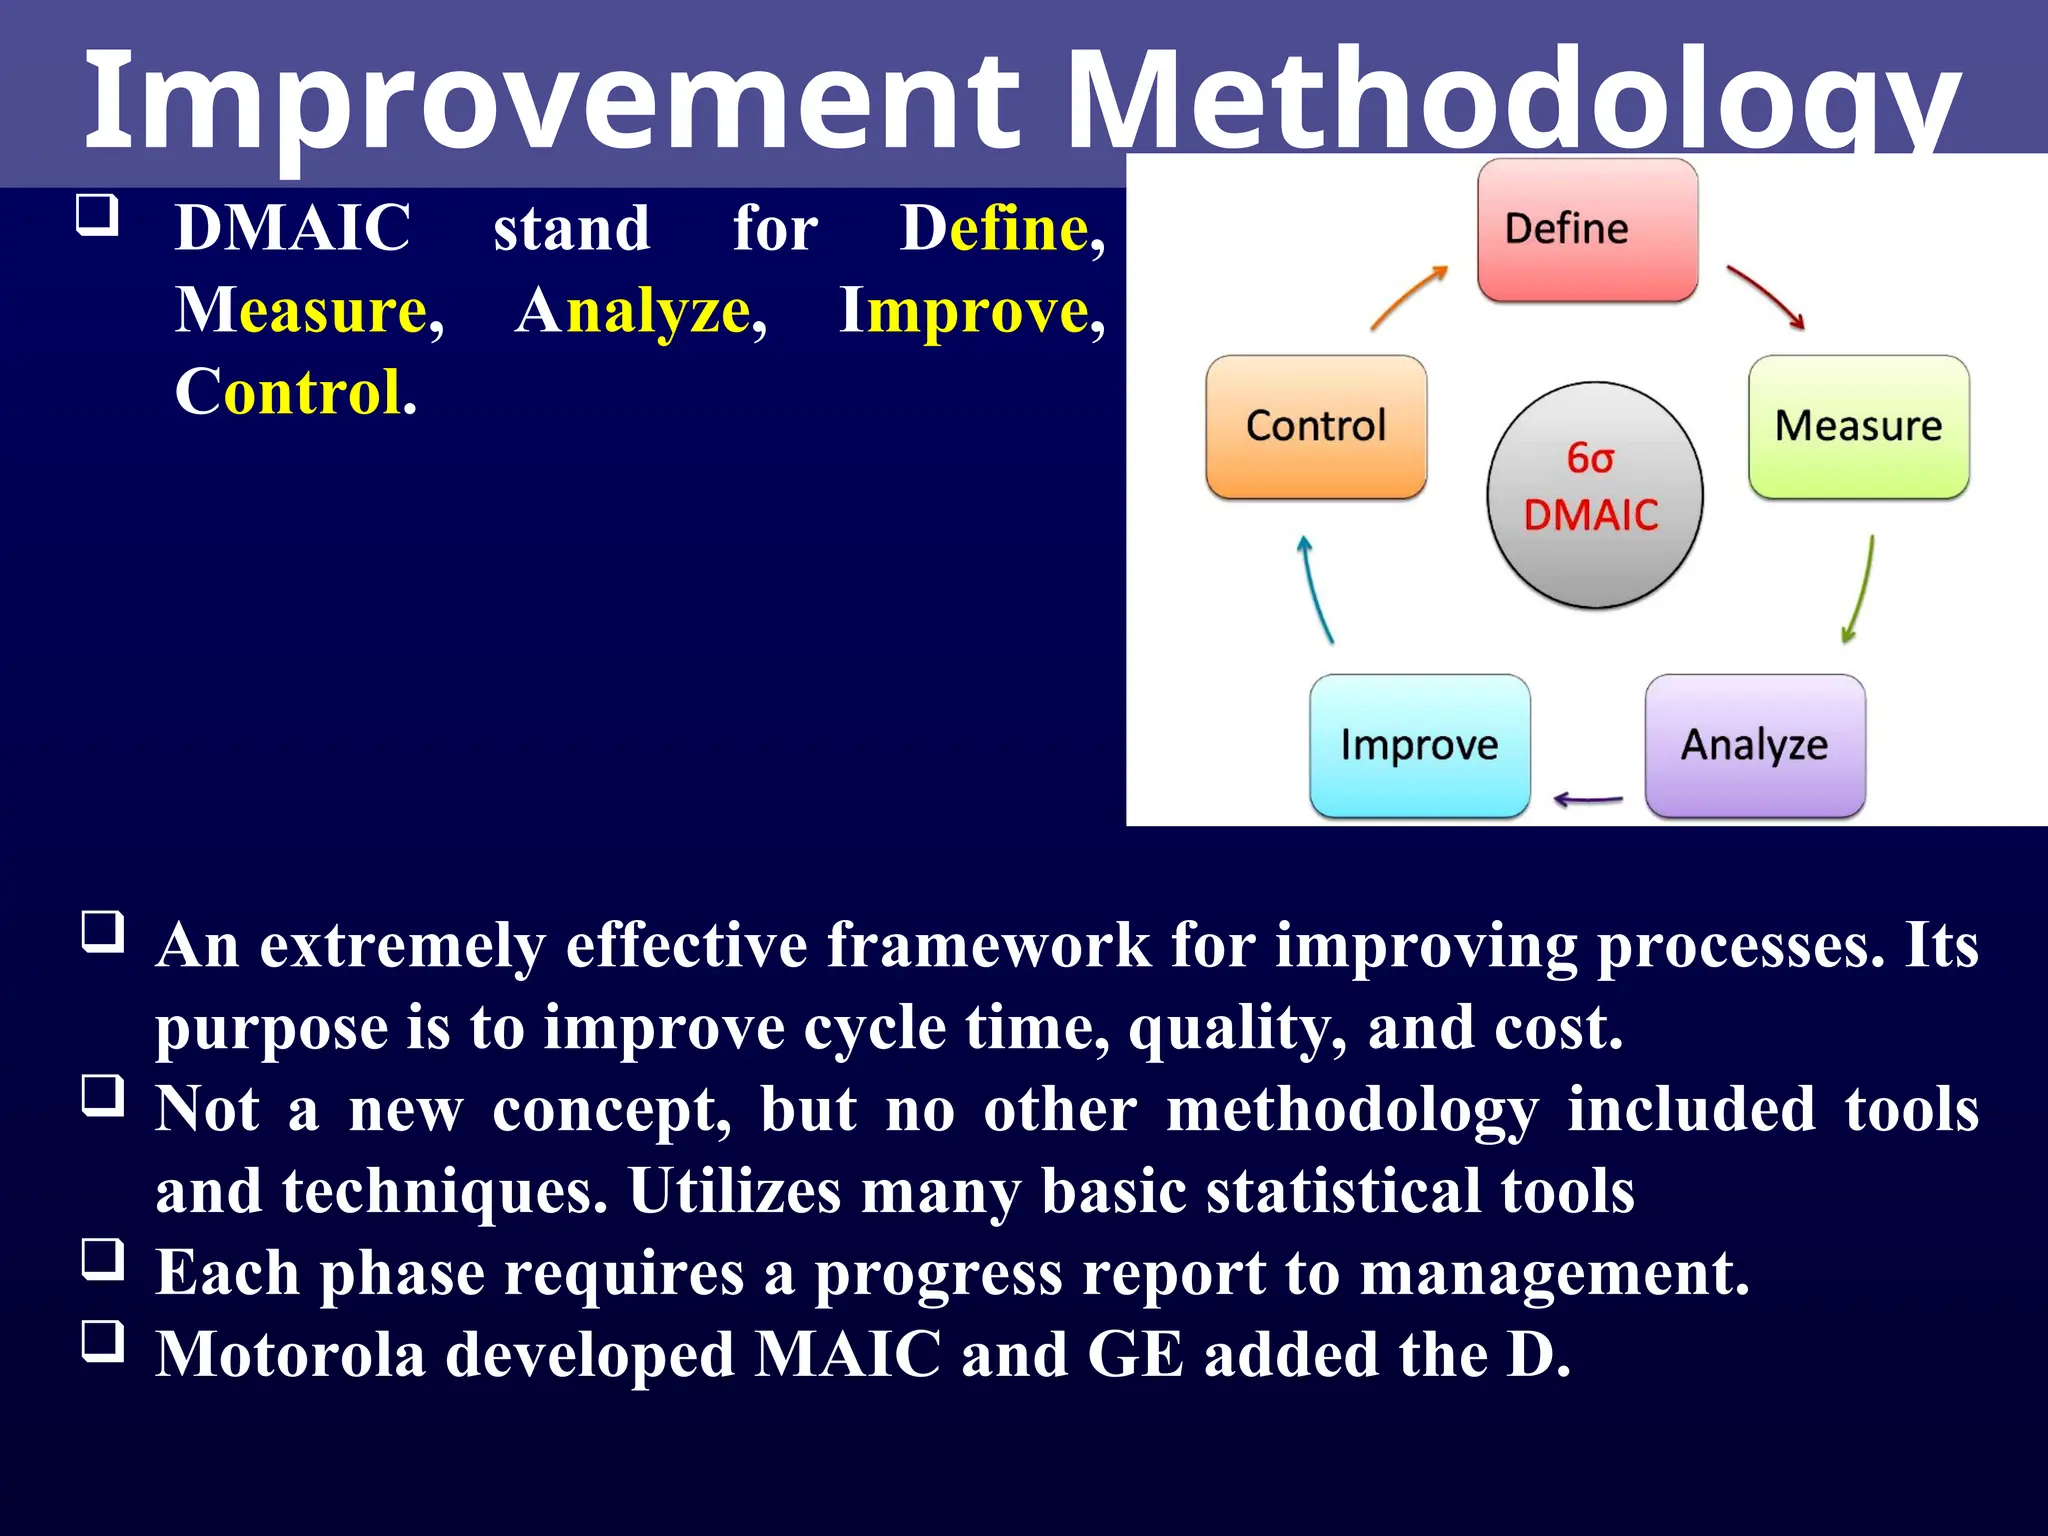
DMAICstand for Define,
Measure, Analyze, Improve,
Control.
An extremely effective framework for improving processes. Its
purpose is to improve cycle time, quality, and cost.
Not a new concept, but no other methodology included tools
and techniques. Utilizes many basic statistical tools
Each phase requires a progress report to management.
Motorola developed MAIC and GE added the D.
Define
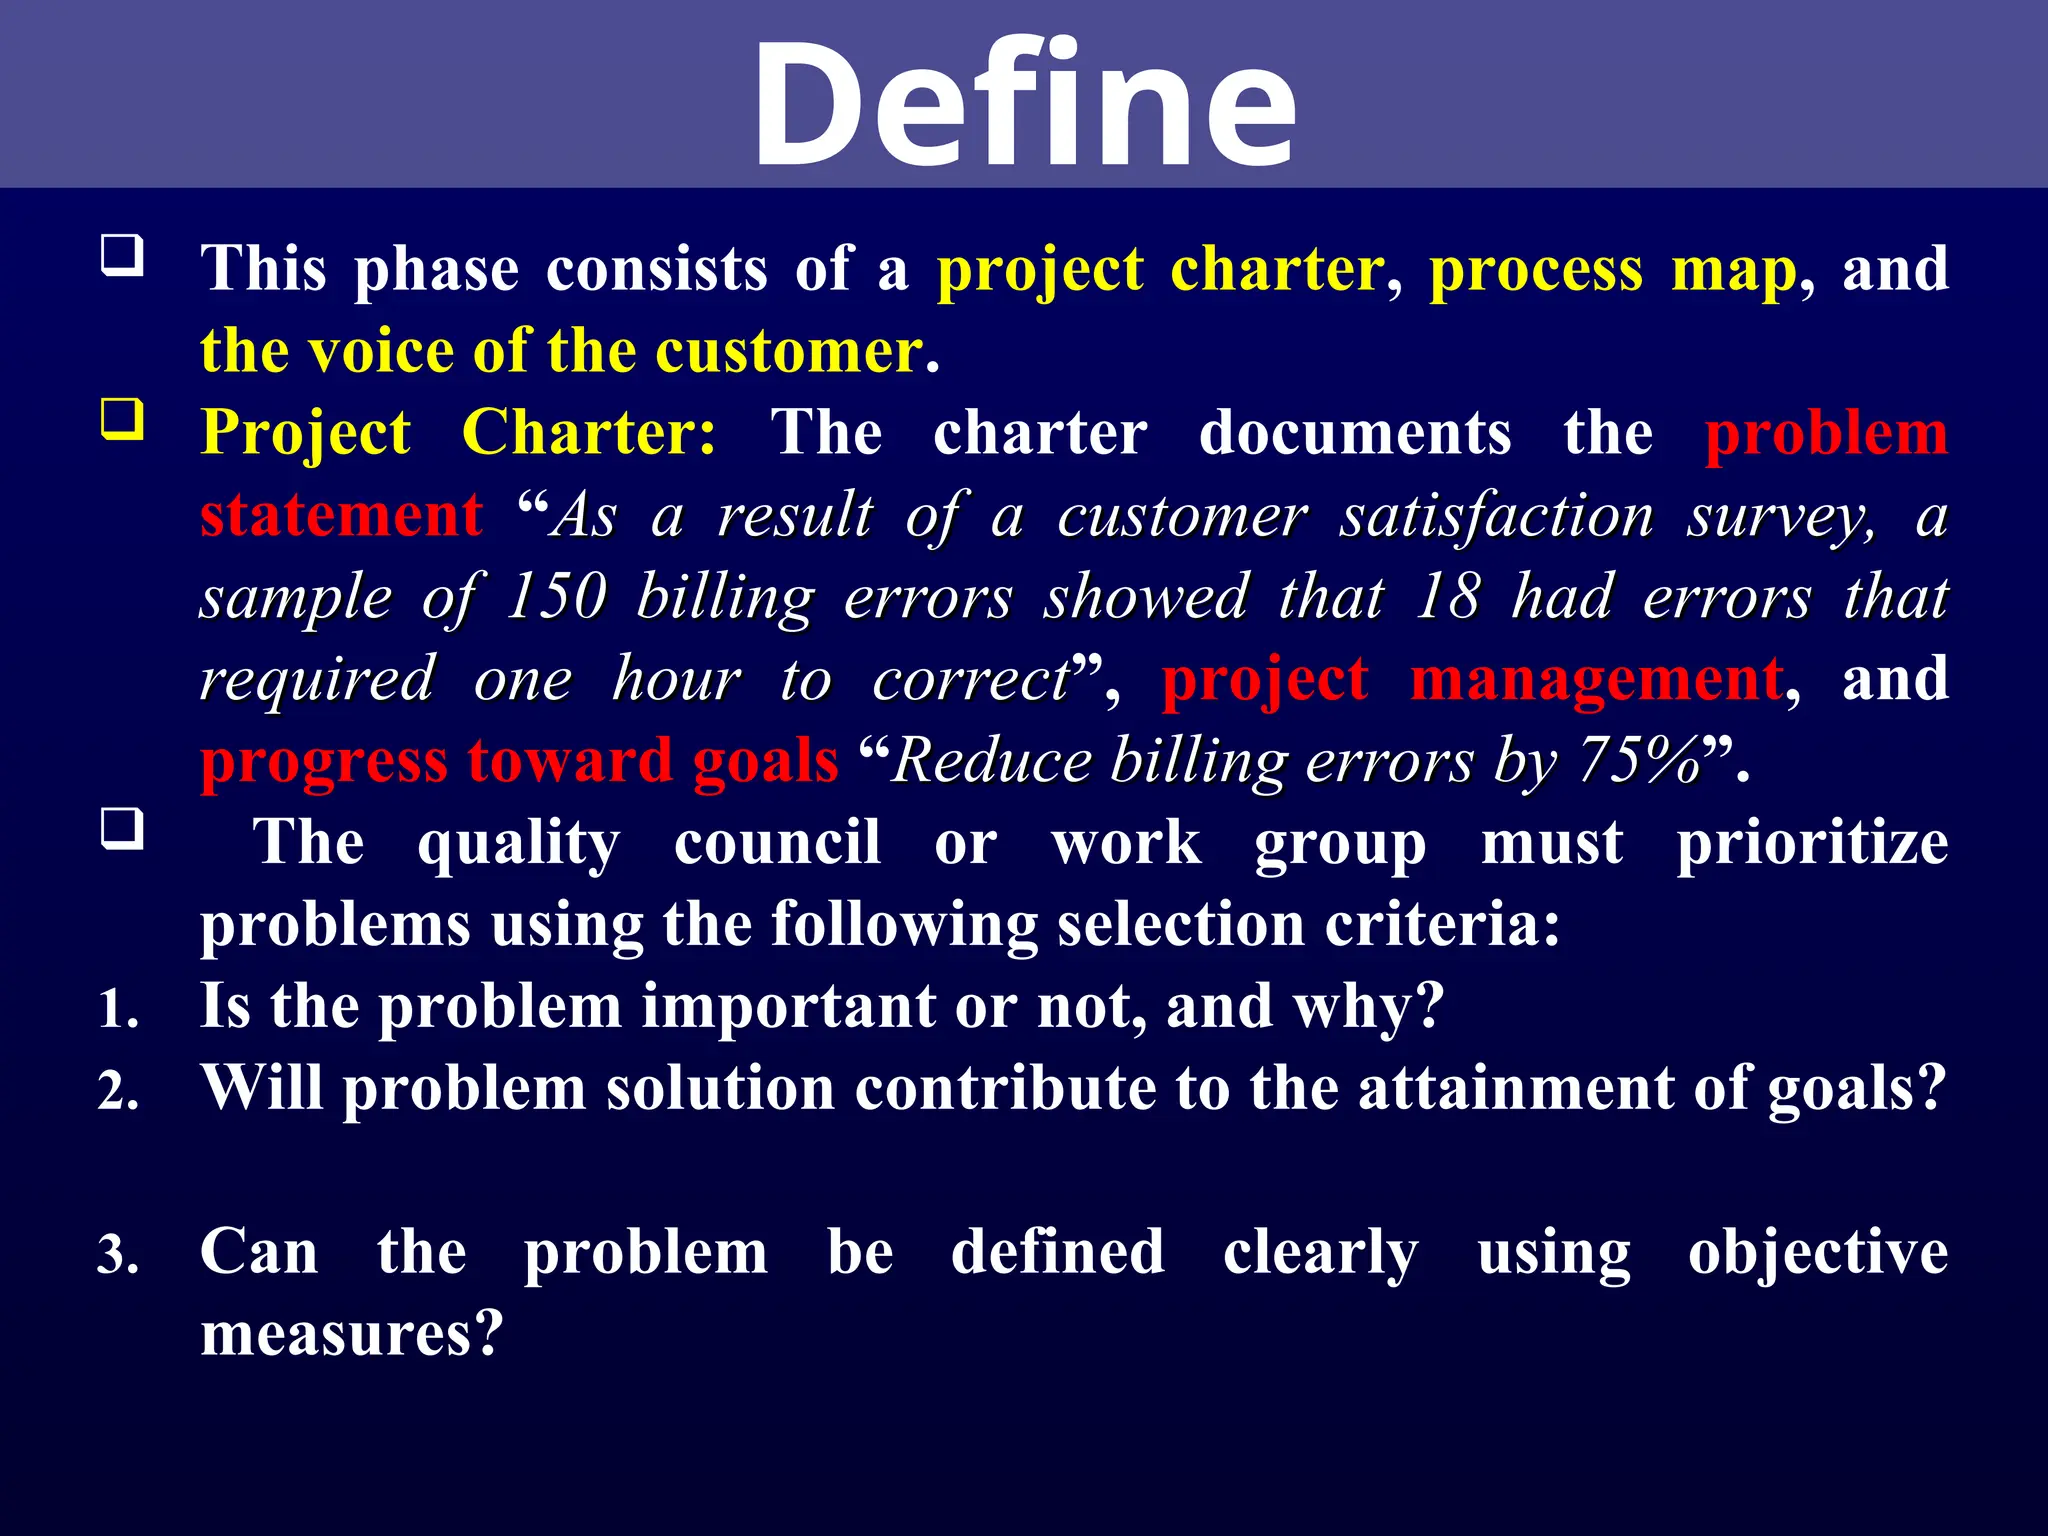
This phaseconsists of a project charter, process map, and
the voice of the customer.
Project Charter: The charter documents the problem
statement “As a result of a customer satisfaction survey, a
As a result of a customer satisfaction survey, a
sample of 150 billing errors showed that 18 had errors that
sample of 150 billing errors showed that 18 had errors that
required one hour to correct
required one hour to correct”, project management, and
progress toward goals “Reduce billing errors by 75%
Reduce billing errors by 75%”.
The quality council or work group must prioritize
problems using the following selection criteria:
1. Is the problem important or not, and why?
2. Will problem solution contribute to the attainment of goals?
3. Can the problem be defined clearly using objective
measures?
17.
Define
Define
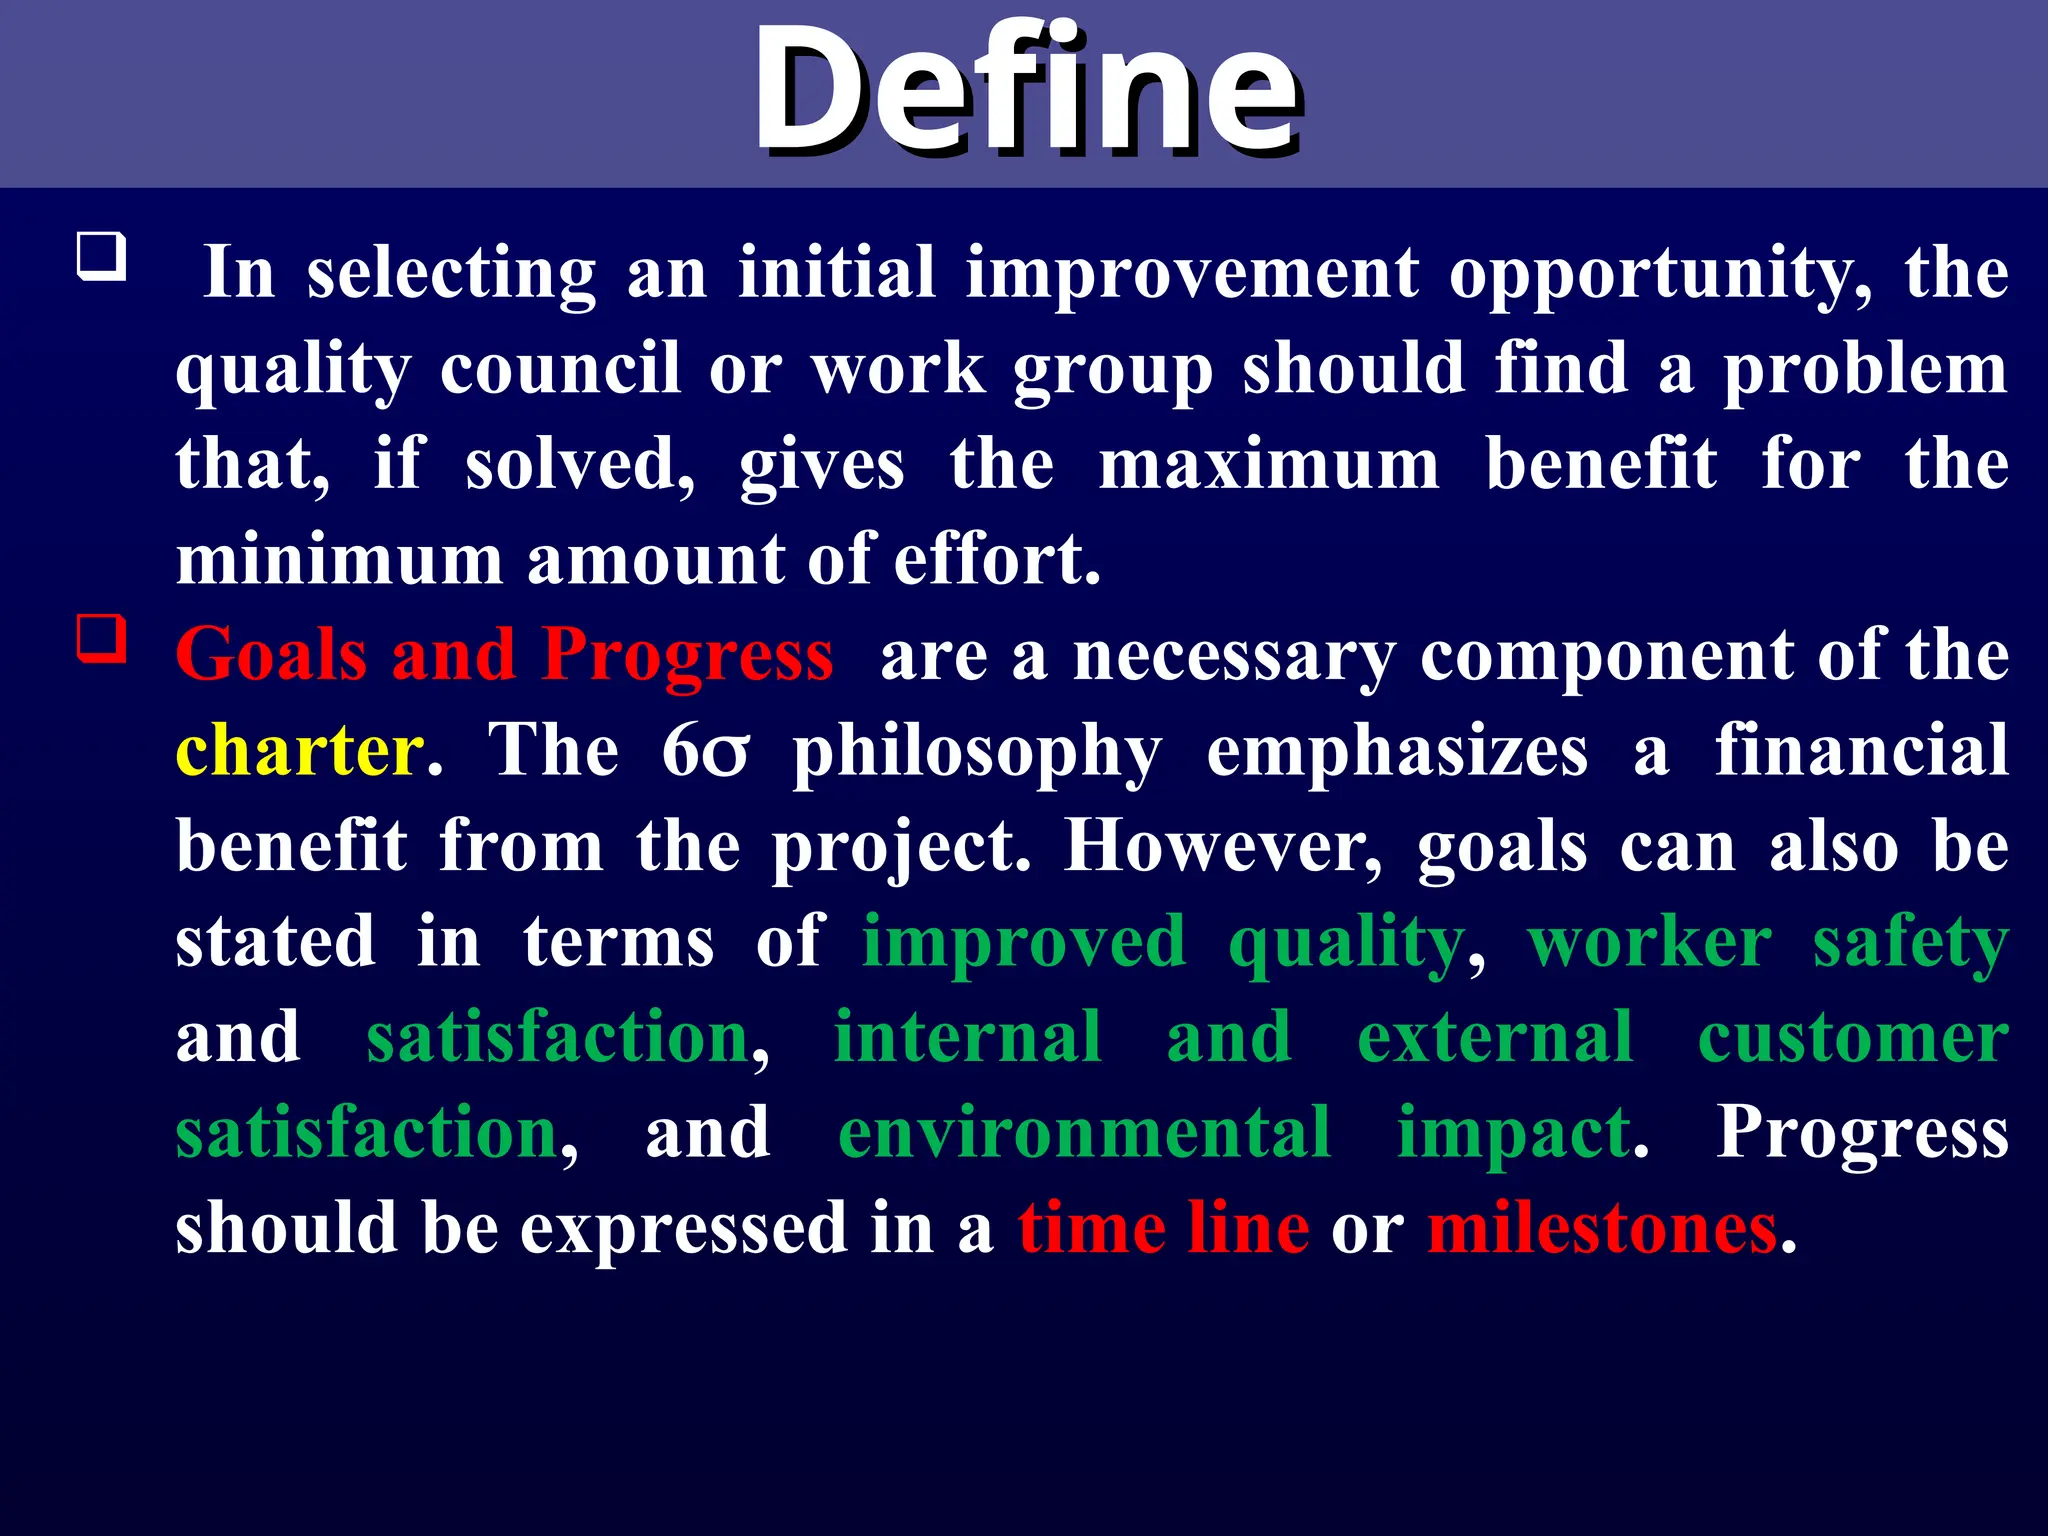
In selectingan initial improvement opportunity, the
quality council or work group should find a problem
that, if solved, gives the maximum benefit for the
minimum amount of effort.
Goals and Progress are a necessary component of the
charter. The 6 philosophy emphasizes a financial
benefit from the project. However, goals can also be
stated in terms of improved quality, worker safety
and satisfaction, internal and external customer
satisfaction, and environmental impact. Progress
should be expressed in a time line or milestones.
18.
Define
Define
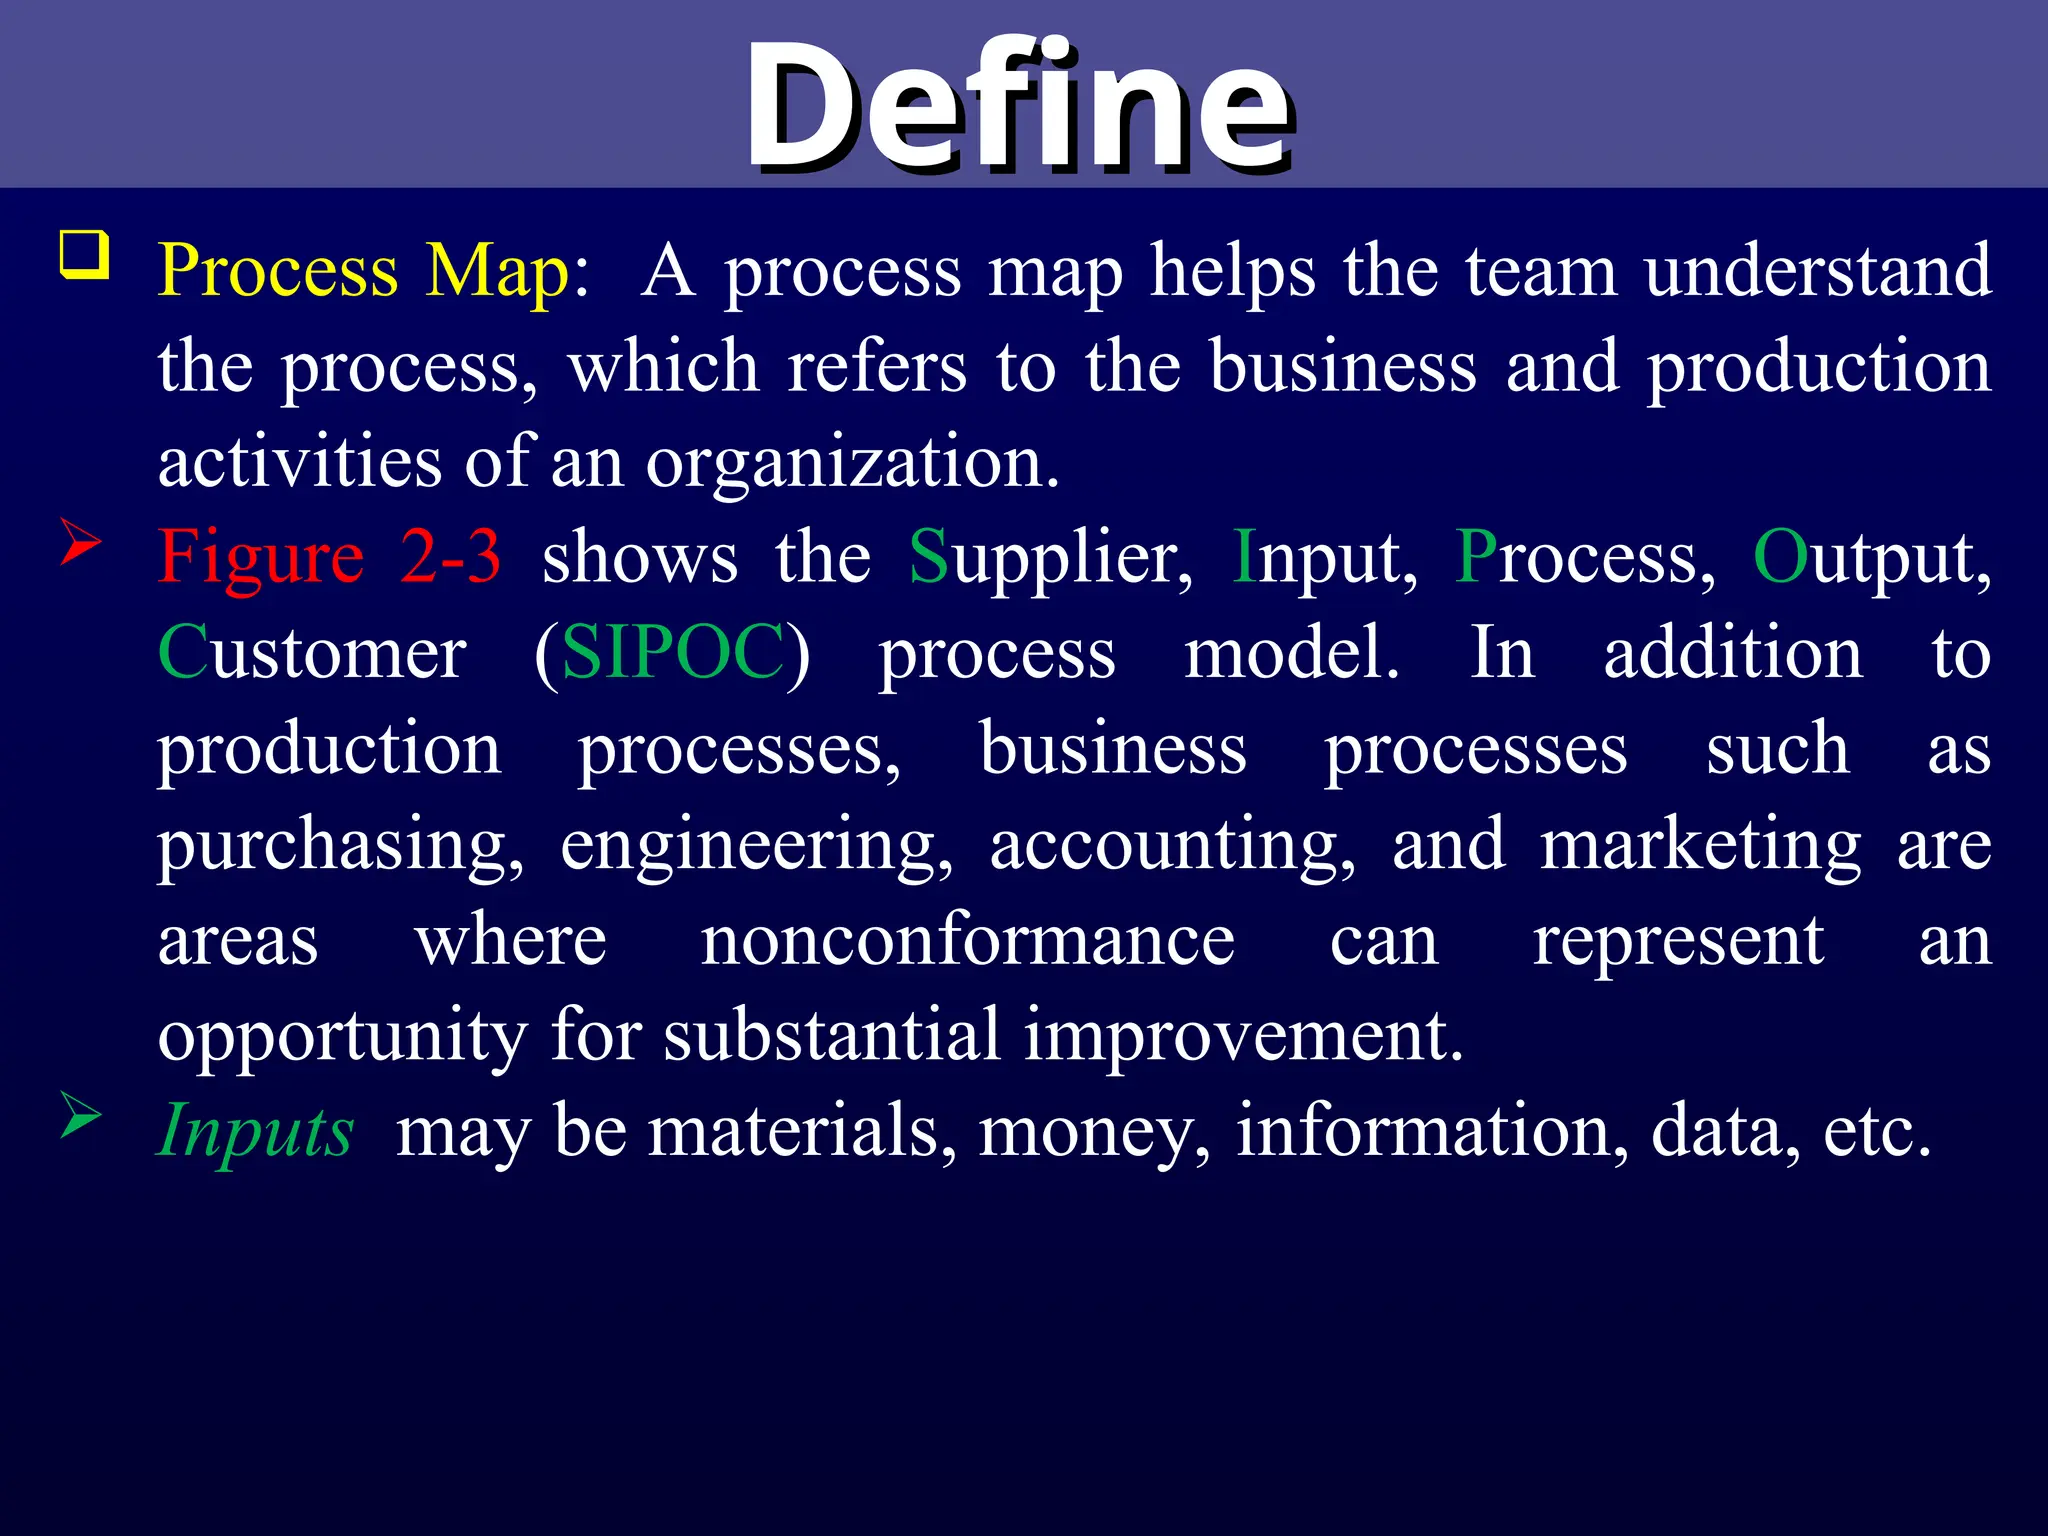
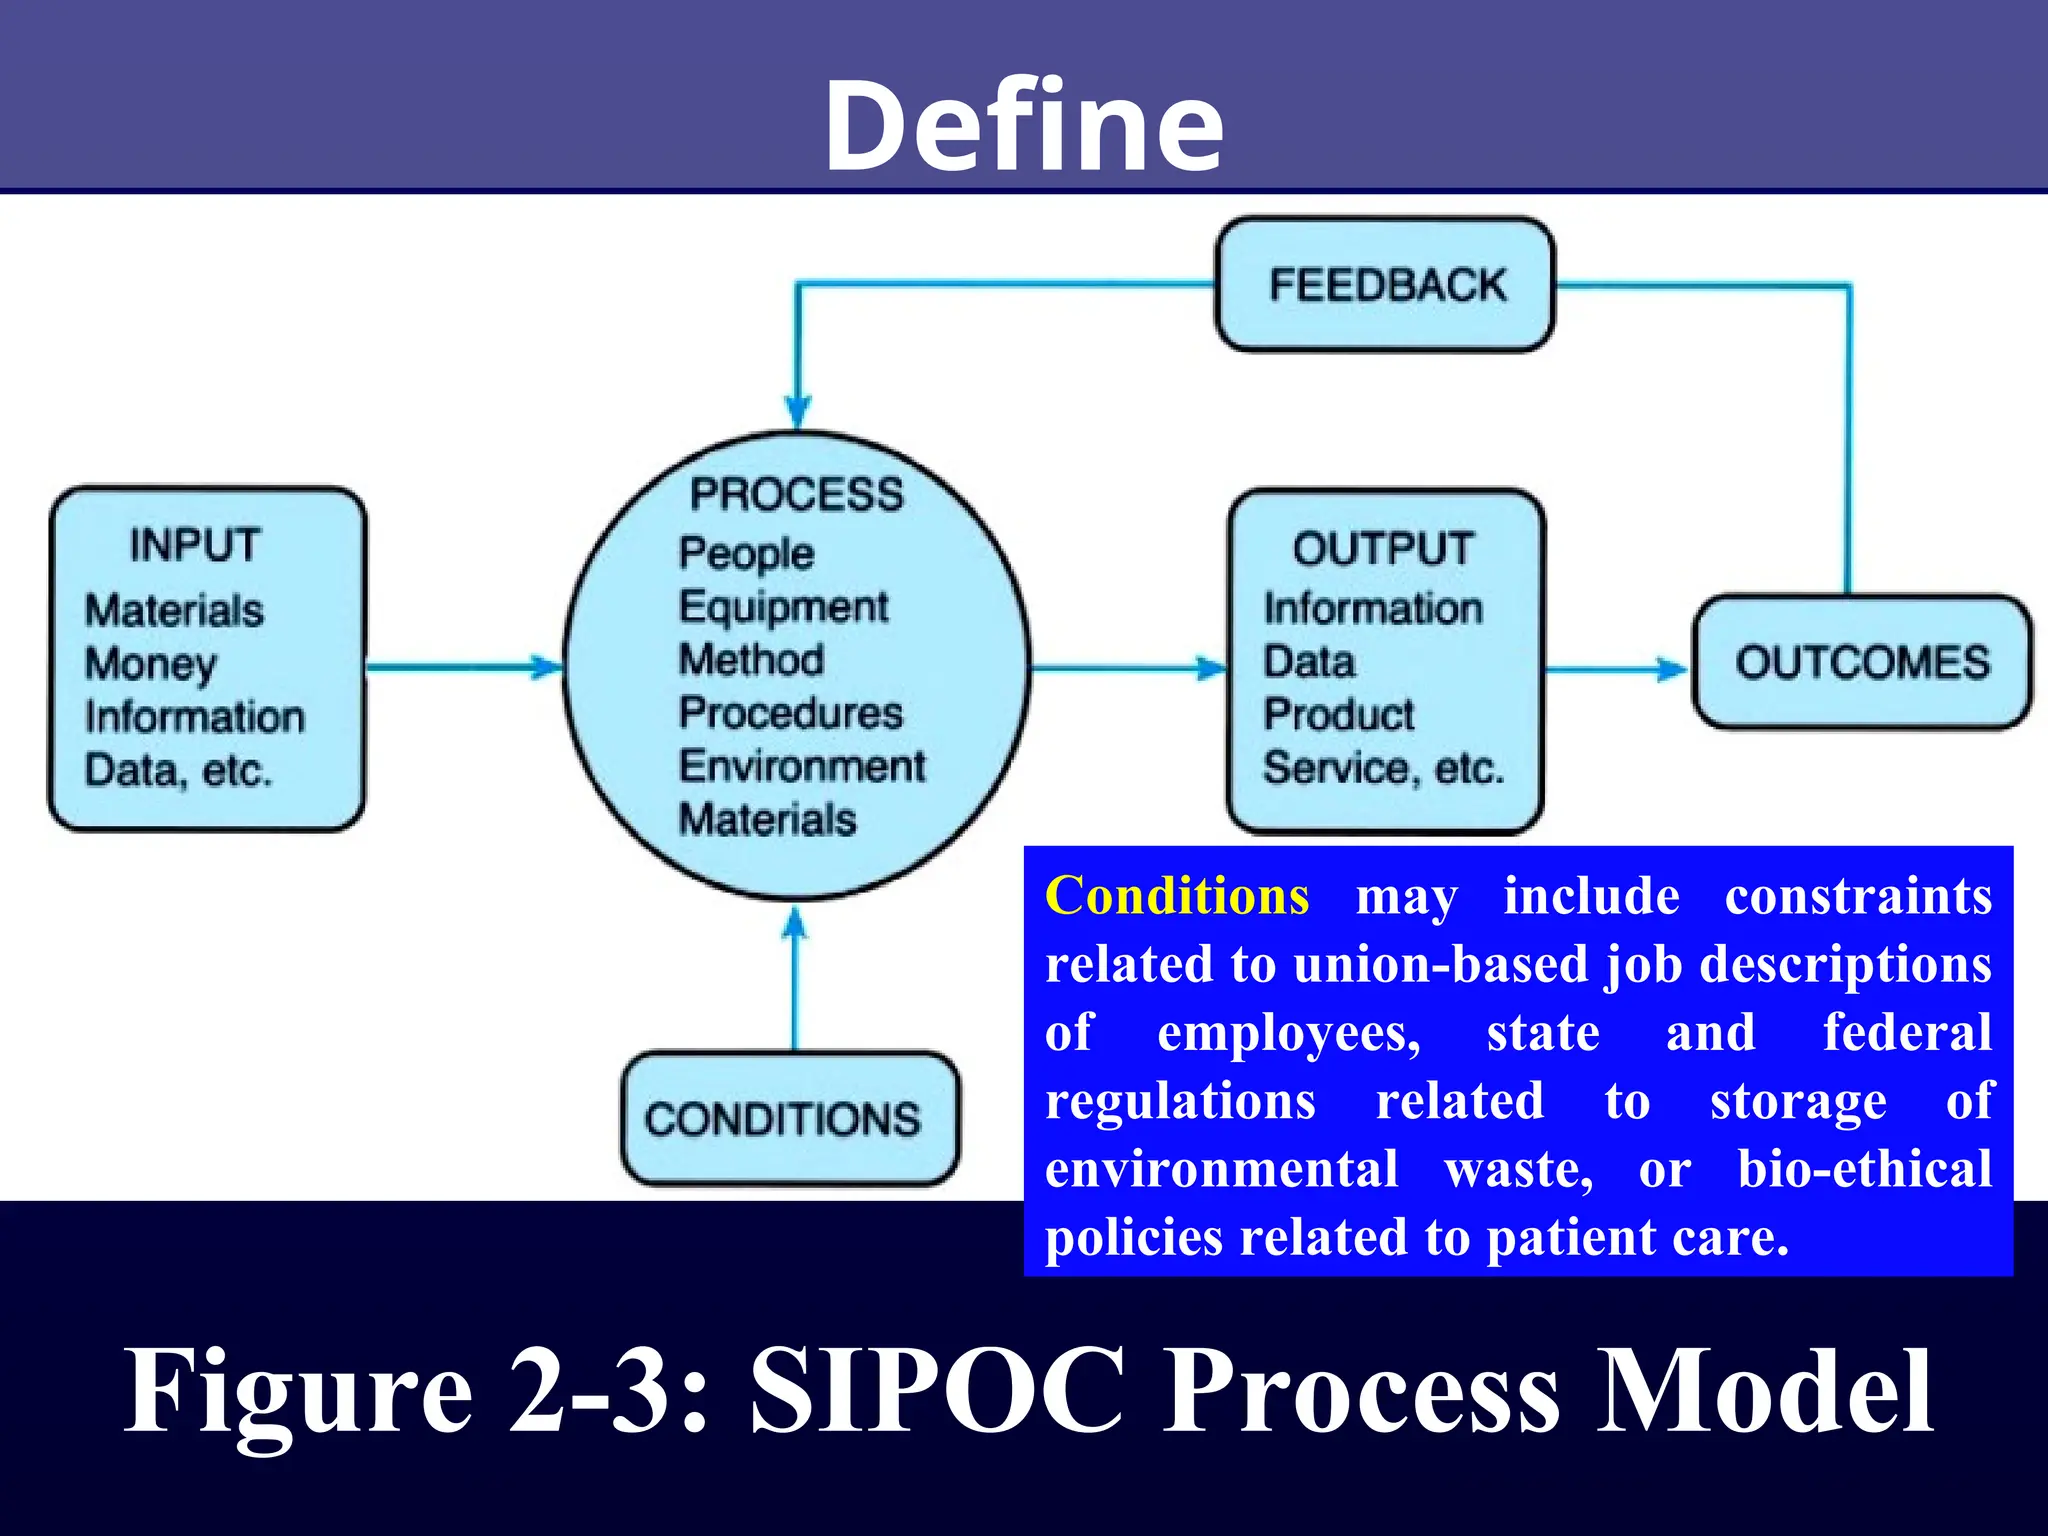
Process Map:A process map helps the team understand
the process, which refers to the business and production
activities of an organization.
Figure 2-3 shows the Supplier, Input, Process, Output,
Customer (SIPOC) process model. In addition to
production processes, business processes such as
purchasing, engineering, accounting, and marketing are
areas where nonconformance can represent an
opportunity for substantial improvement.
Inputs may be materials, money, information, data, etc.
19.
Define
Define
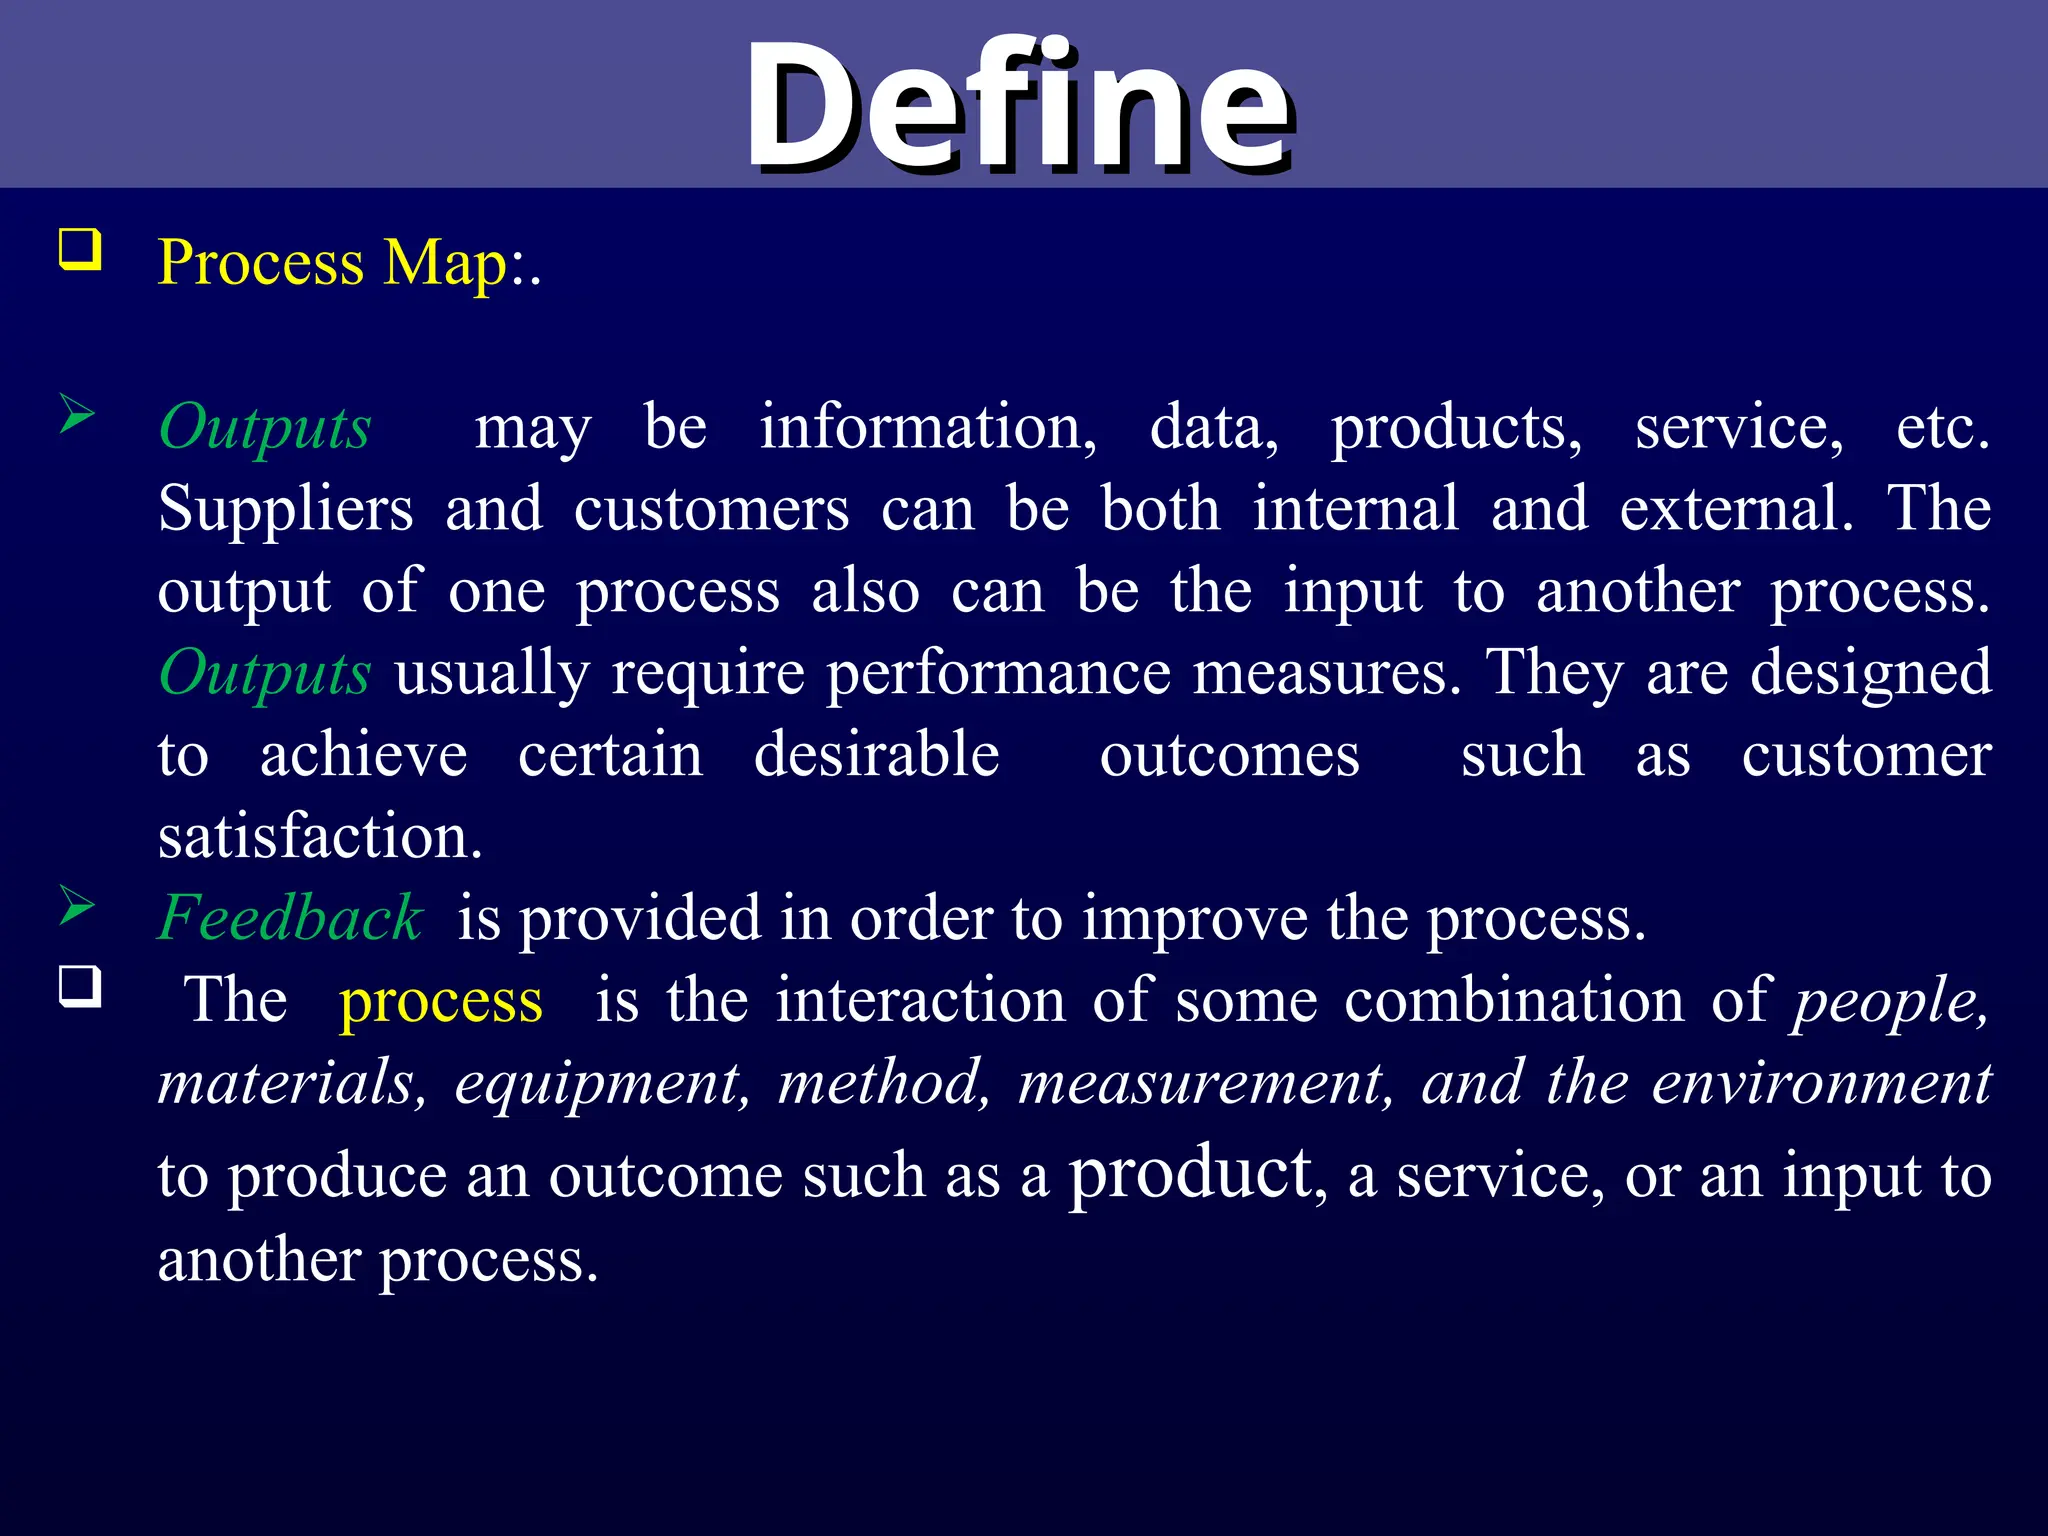
Process Map:.
Outputs may be information, data, products, service, etc.
Suppliers and customers can be both internal and external. The
output of one process also can be the input to another process.
Outputs usually require performance measures. They are designed
to achieve certain desirable outcomes such as customer
satisfaction.
Feedback is provided in order to improve the process.
The process is the interaction of some combination of people,
materials, equipment, method, measurement, and the environment
to produce an outcome such as a product, a service, or an input to
another process.
20.
Figure 2-3: SIPOCProcess Model
Define
Conditions may include constraints
related to union-based job descriptions
of employees, state and federal
regulations related to storage of
environmental waste, or bio-ethical
policies related to patient care.
21.
Define
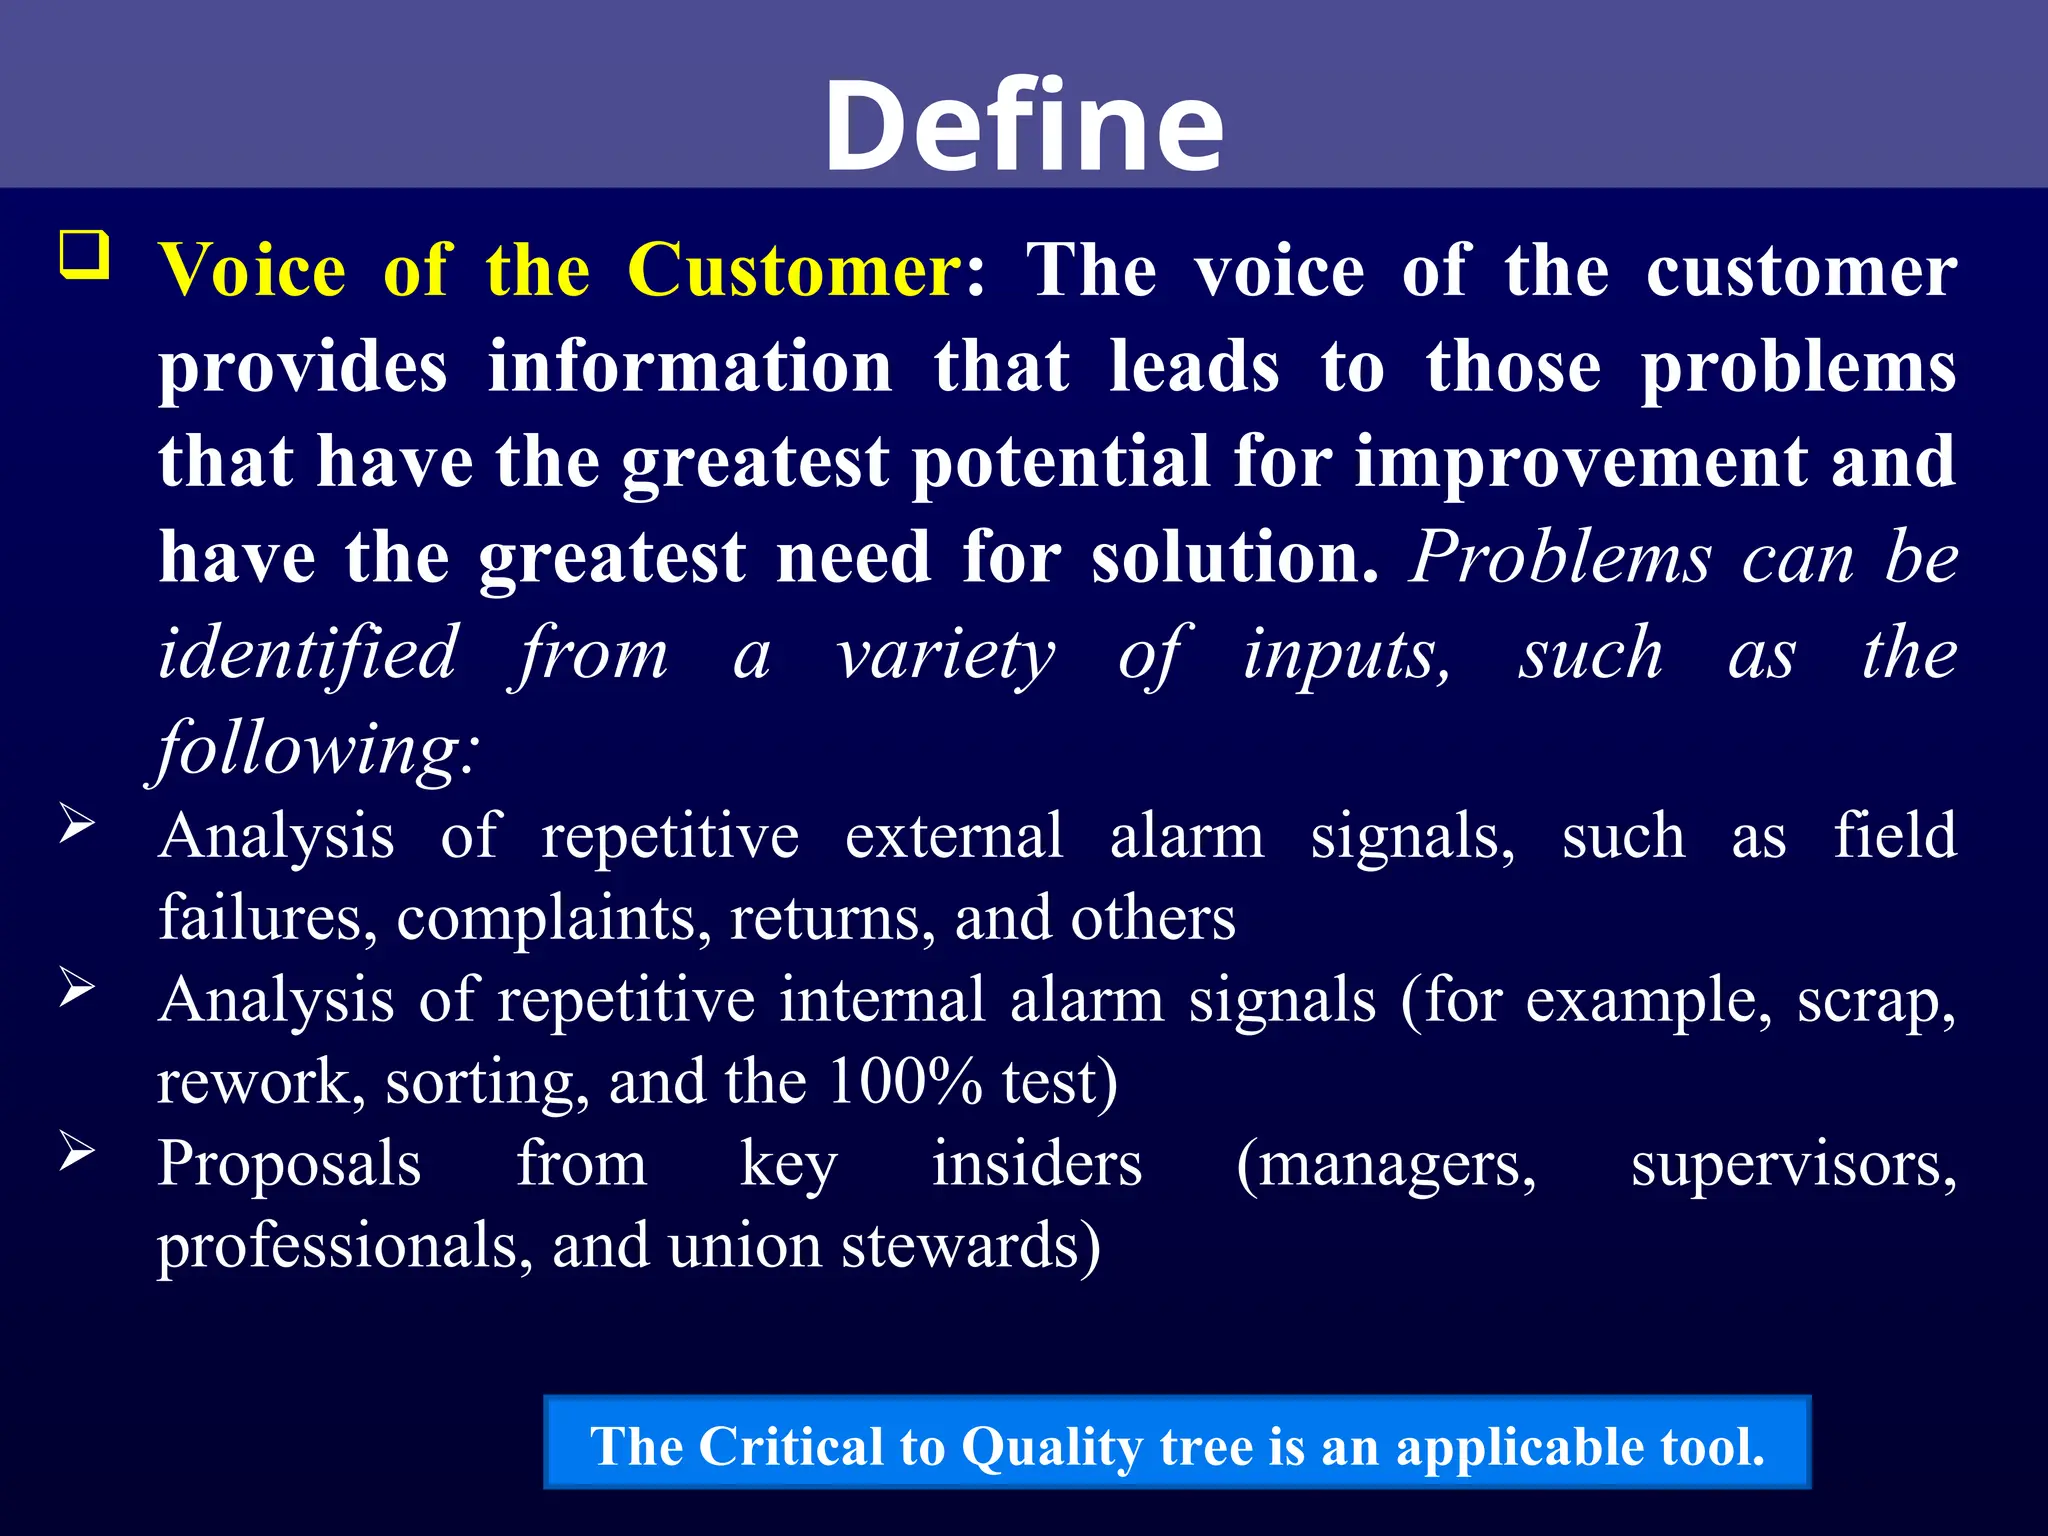
Voice ofthe Customer: The voice of the customer
provides information that leads to those problems
that have the greatest potential for improvement and
have the greatest need for solution. Problems can be
identified from a variety of inputs, such as the
following:
Analysis of repetitive external alarm signals, such as field
failures, complaints, returns, and others
Analysis of repetitive internal alarm signals (for example, scrap,
rework, sorting, and the 100% test)
Proposals from key insiders (managers, supervisors,
professionals, and union stewards)
The Critical to Quality tree is an applicable tool.
22.
Define
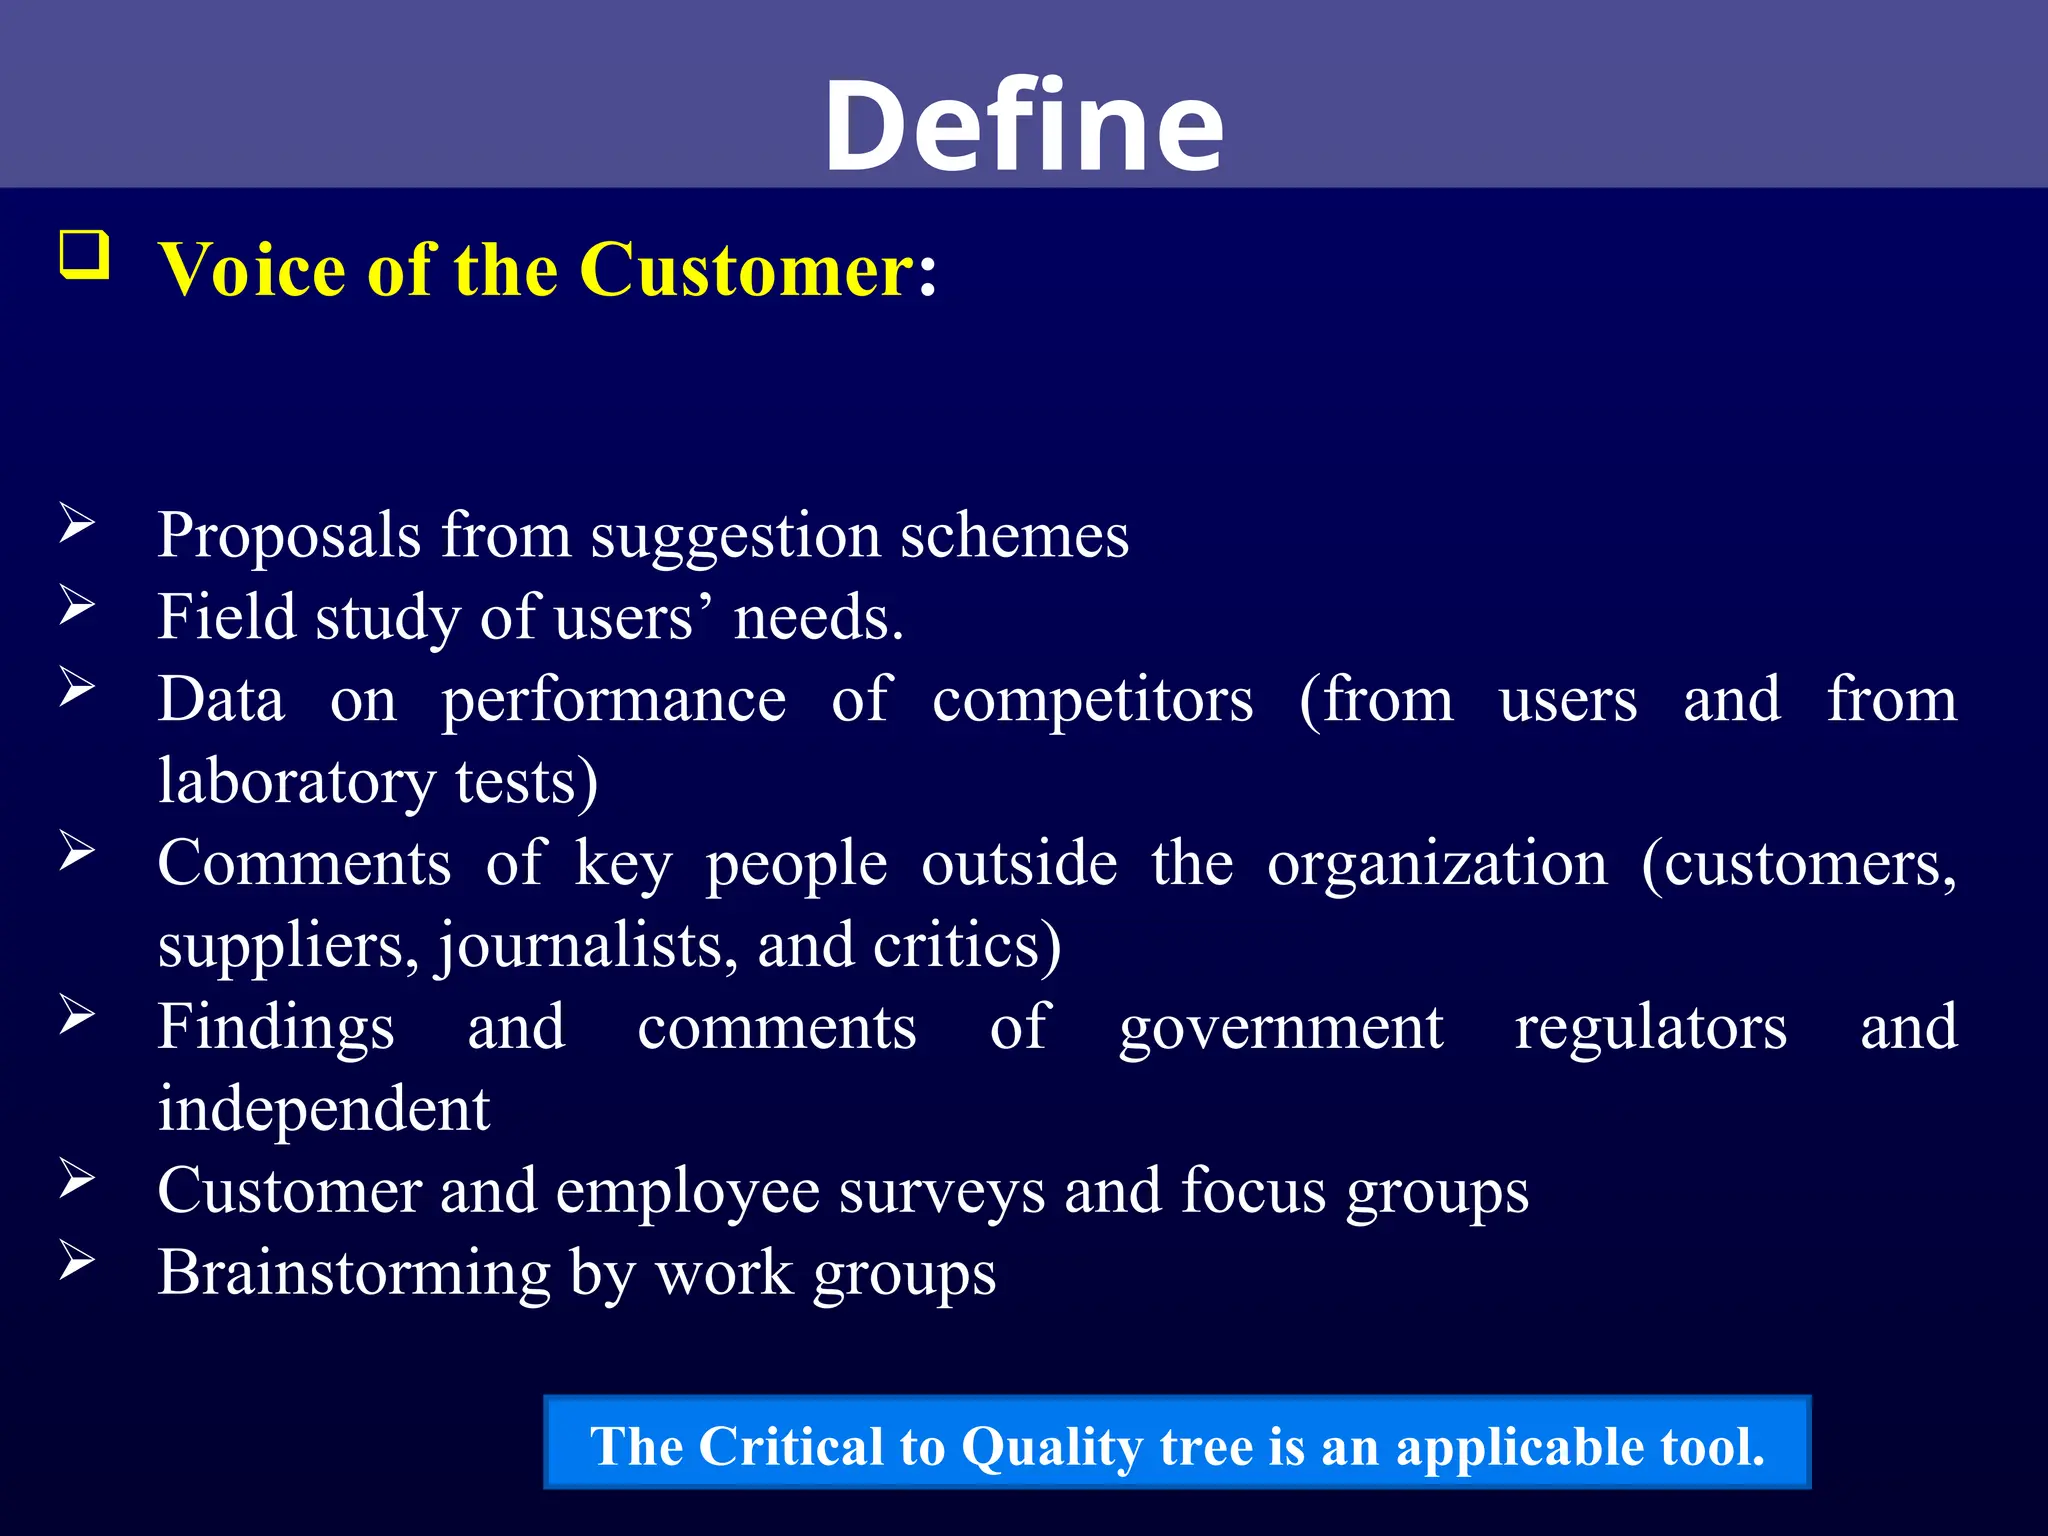
Voice ofthe Customer:
Proposals from suggestion schemes
Field study of users’ needs.
Data on performance of competitors (from users and from
laboratory tests)
Comments of key people outside the organization (customers,
suppliers, journalists, and critics)
Findings and comments of government regulators and
independent
Customer and employee surveys and focus groups
Brainstorming by work groups
The Critical to Quality tree is an applicable tool.
23.
Measure
Measure: Consistsof understand the process, validate
the data accuracy, and determine the process
capability. This information is used to review the define
phase, establish a baseline, and obtain a better
knowledge of the process.
Understand the Process: A value stream map provides
information concerning the waste in the process. This
technique is a beginning point to understand the
logistics of the process. A diagram or map translates
complex work into an easily understood graphic
description. This activity is an eye-opening experience
eye-opening experience
for the team, because it is rare that all members of the
team understand the entire process.
24.
Measure
Validate theData Accuracy: All devices used to
collect data must be calibrated. Measurements must
be accurate and precise. One of the most common
tools to evaluate a measuring system is called
GR&R, which stands for gauge repeatability and
reproducibility.
Determine the Process Capability: Process
capability is a statistical measure that compares
process variation to the specifications. In order to
have a reliable measure the variation must be stable
over time as measured by a control chart.
25.
Analyze
This phaseconsists of process analysis, cause
investigation, charter updating. Identify and verify
causes affecting problem.
Process Analysis: Perform a detailed review of the value
stream map to calculate takt time, identify non-value-added
activities, and bottlenecks. Review data collected in the
measure phase, determine bottlenecks.
Cause Investigation: This activity begins with identifying
all the potential causes. The cause-and-effect diagram is
particularly effective in this phase. Other tools are why-
why, tree diagram, interrelationship diagram and simulation
modeling. The list of potential causes can be narrowed by
multi-voting, Pareto analysis, and stratification.
26.
Analyze
.
CharterReview: Results of the analysis phase
may require changes to the charter phase—in
particular, the problem statement, team
membership, schedule, resources needed, and
goals.
27.
Improve
Improve
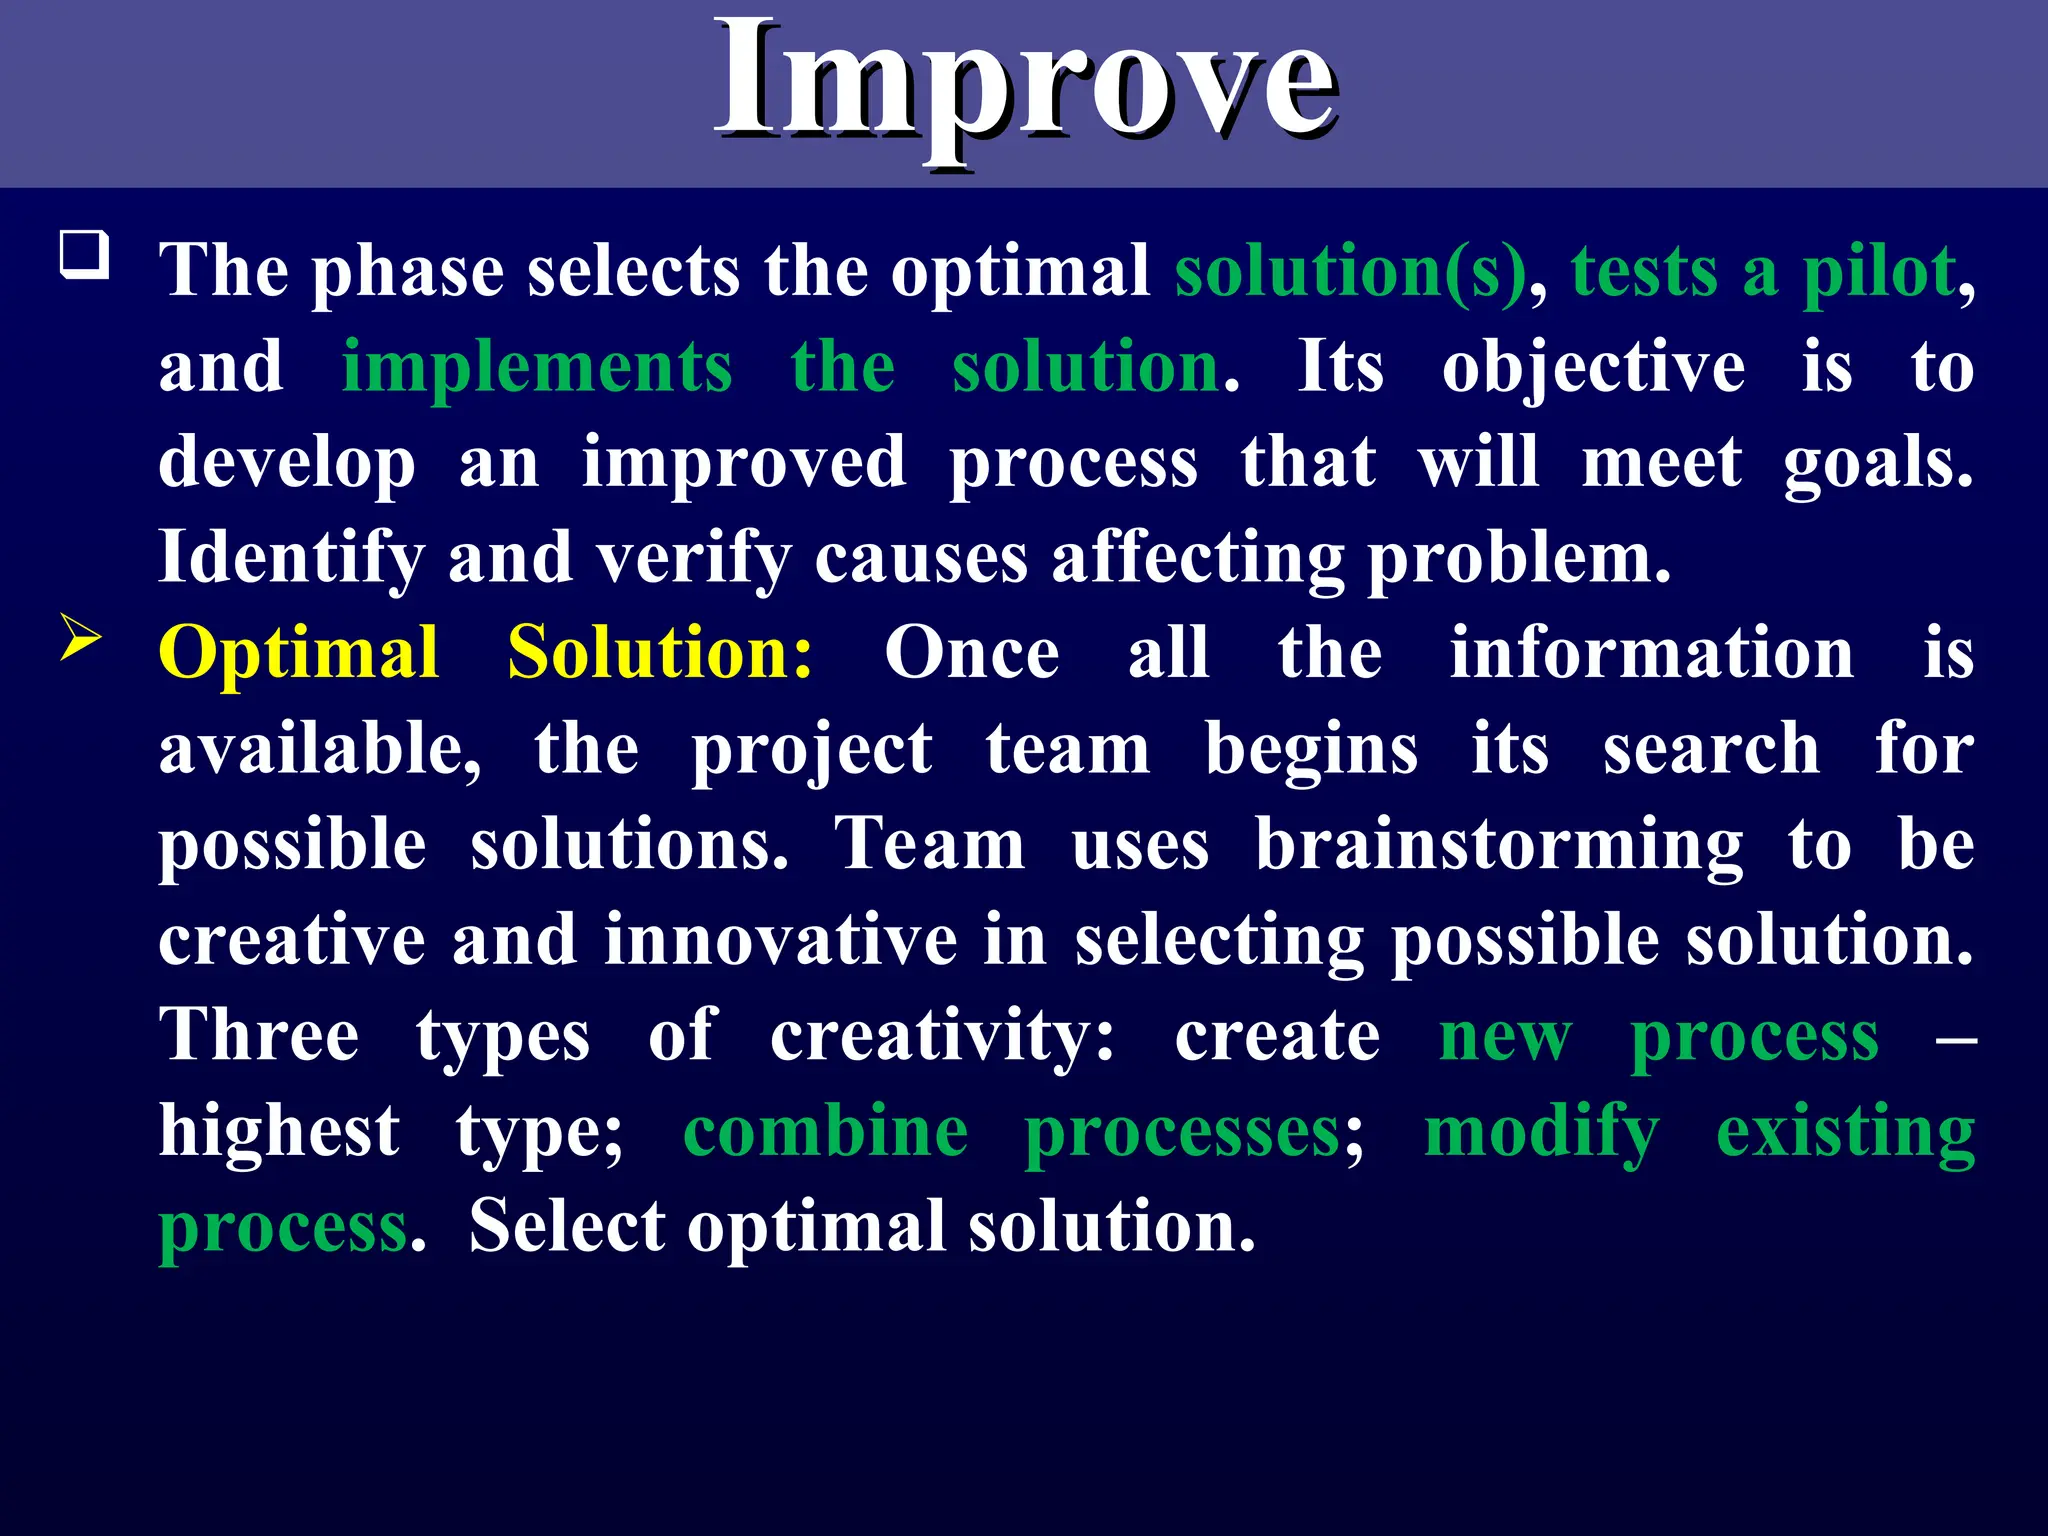
The phaseselects the optimal solution(s), tests a pilot,
and implements the solution. Its objective is to
develop an improved process that will meet goals.
Identify and verify causes affecting problem.
Optimal Solution: Once all the information is
available, the project team begins its search for
possible solutions. Team uses brainstorming to be
creative and innovative in selecting possible solution.
Three types of creativity: create new process –
highest type; combine processes; modify existing
process. Select optimal solution.
28.
Improve
Improve
.
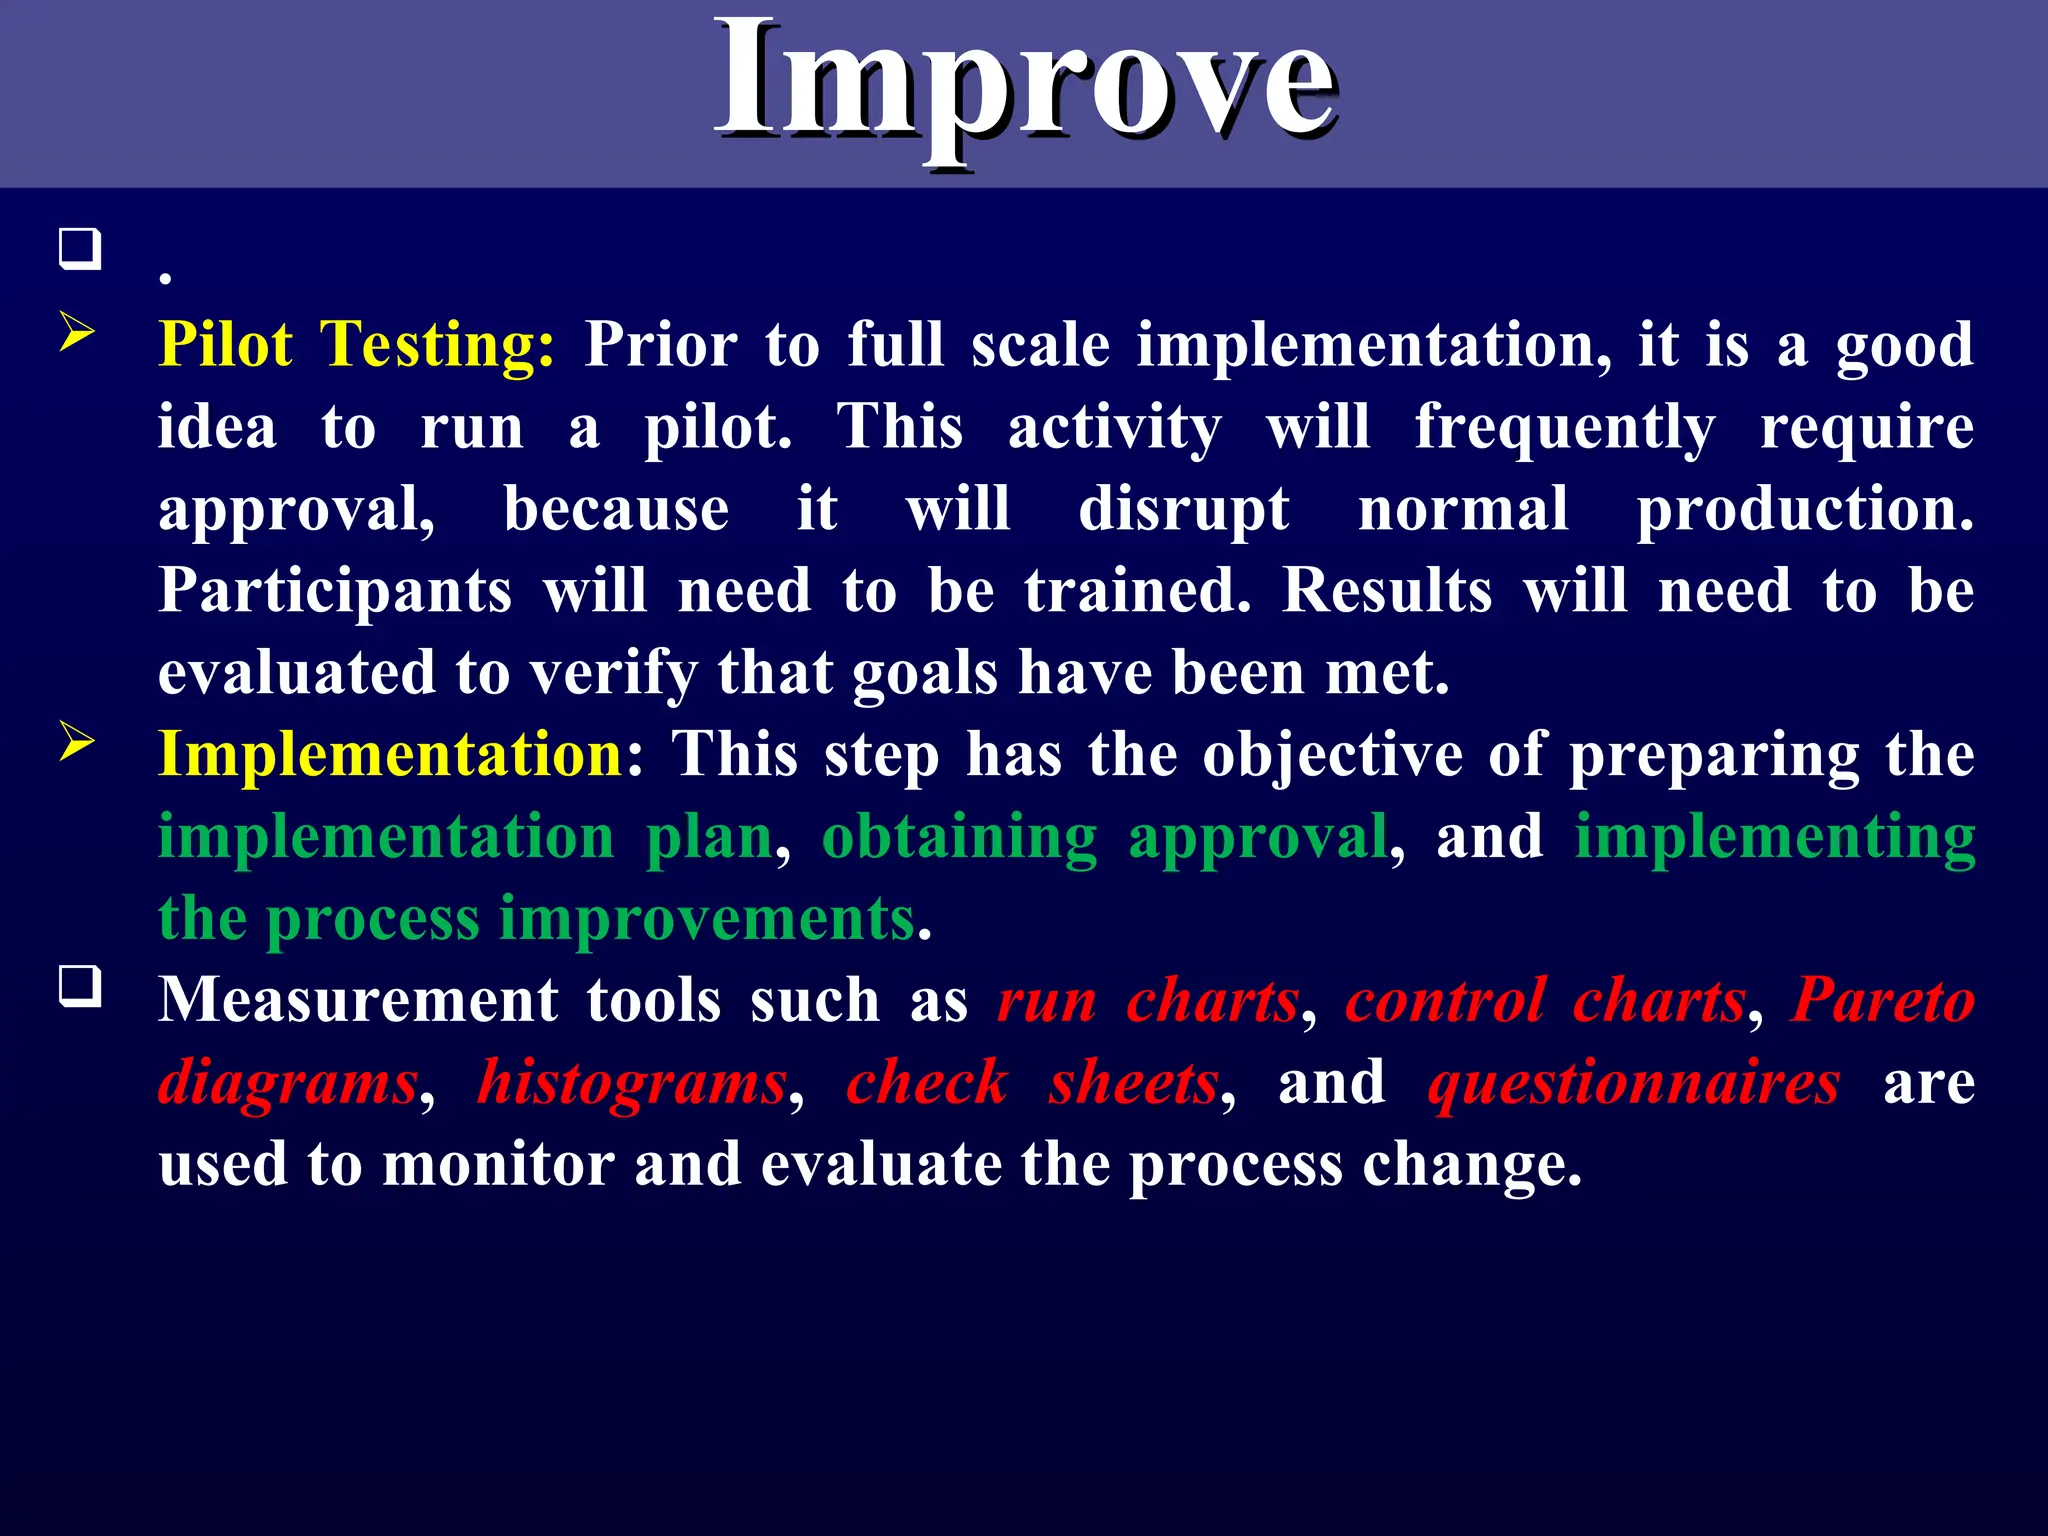
PilotTesting: Prior to full scale implementation, it is a good
idea to run a pilot. This activity will frequently require
approval, because it will disrupt normal production.
Participants will need to be trained. Results will need to be
evaluated to verify that goals have been met.
Implementation: This step has the objective of preparing the
implementation plan, obtaining approval, and implementing
the process improvements.
Measurement tools such as run charts, control charts, Pareto
diagrams, histograms, check sheets, and questionnaires are
used to monitor and evaluate the process change.
29.
Improve
Improve
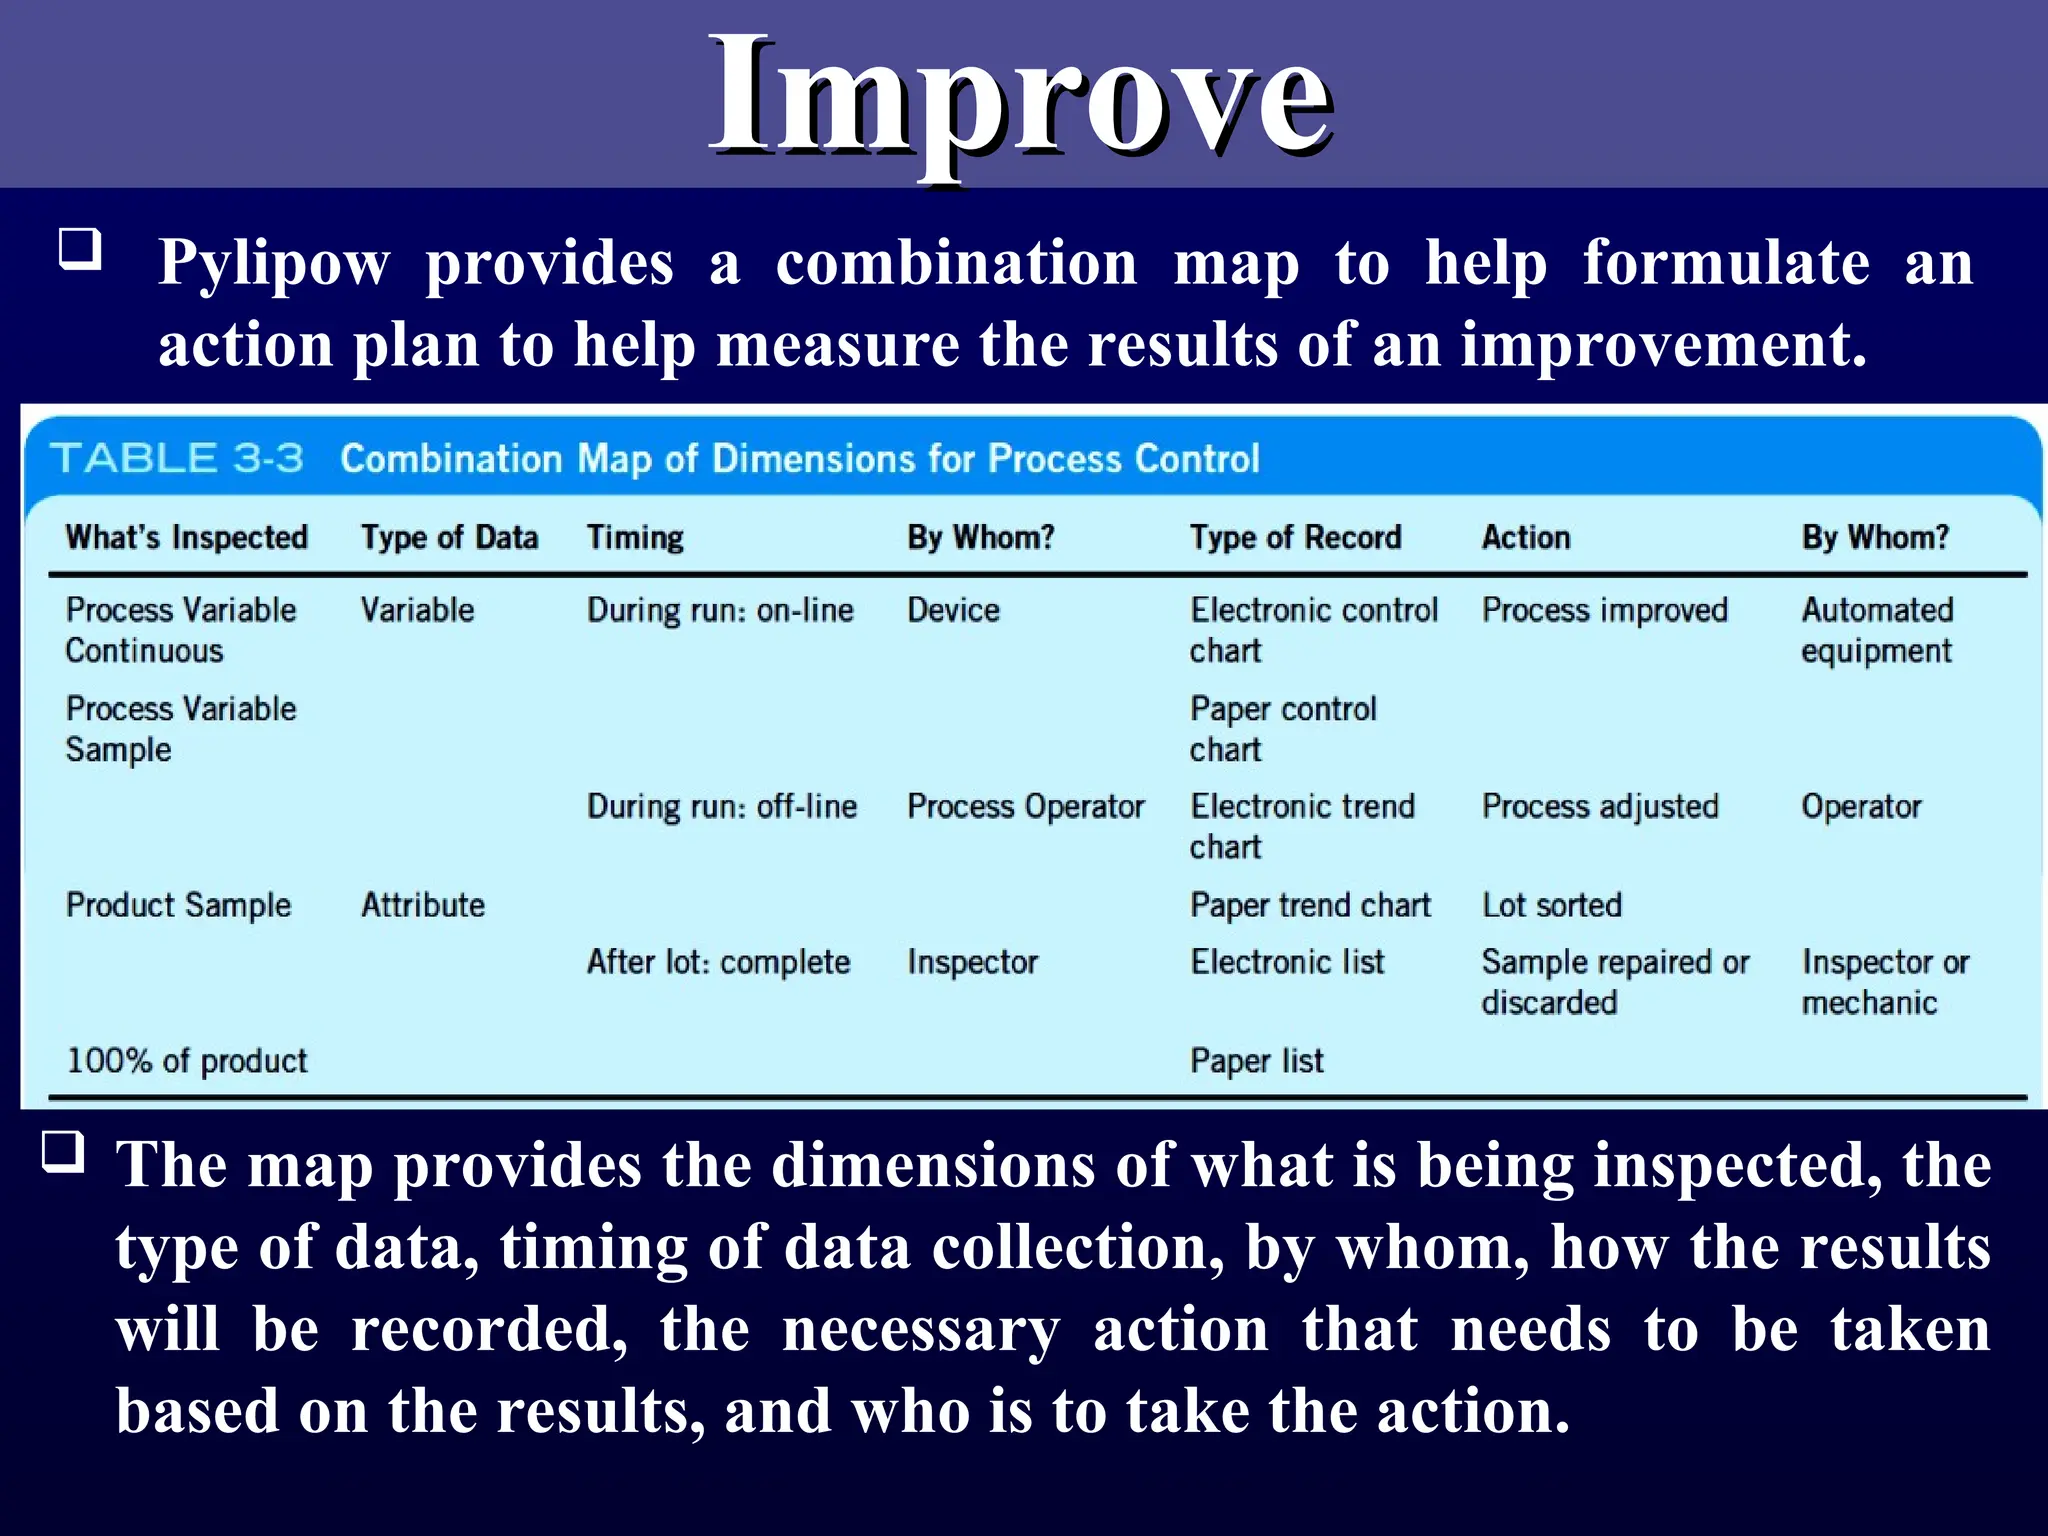
Pylipow providesa combination map to help formulate an
action plan to help measure the results of an improvement.
The map provides the dimensions of what is being inspected, the
type of data, timing of data collection, by whom, how the results
will be recorded, the necessary action that needs to be taken
based on the results, and who is to take the action.
30.
Control
Control
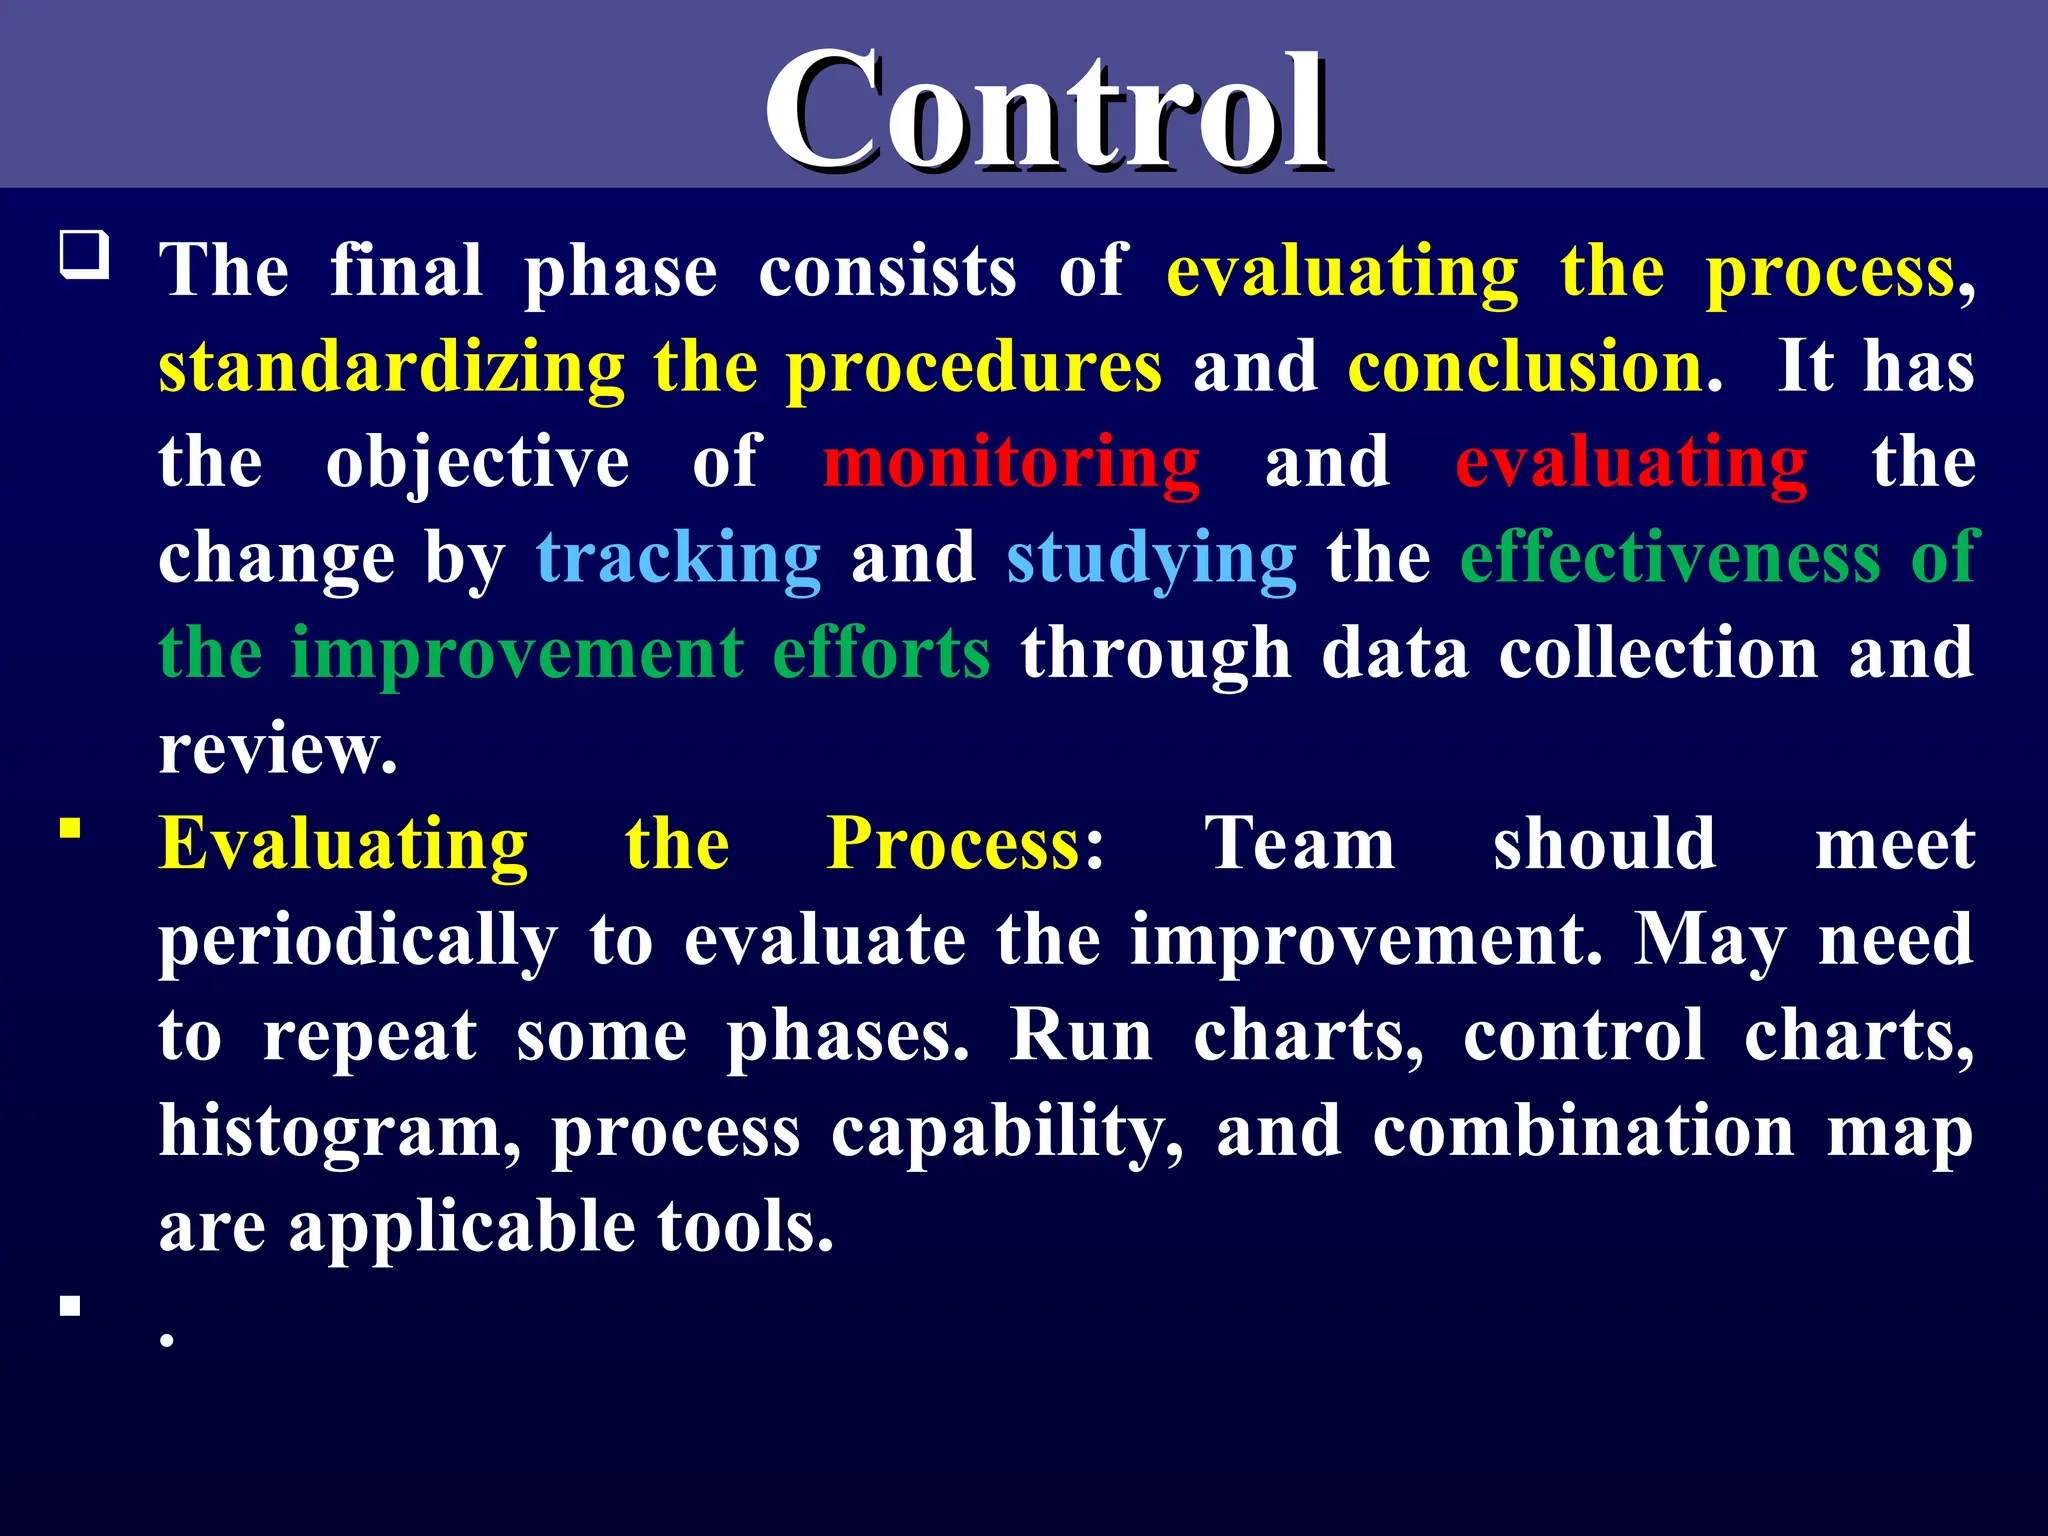
The finalphase consists of evaluating the process,
standardizing the procedures and conclusion. It has
the objective of monitoring and evaluating the
change by tracking and studying the effectiveness of
the improvement efforts through data collection and
review.
Evaluating the Process: Team should meet
periodically to evaluate the improvement. May need
to repeat some phases. Run charts, control charts,
histogram, process capability, and combination map
are applicable tools.
.
31.
Control
Control
.
Standardizethe Procedures: Once the team is
satisfied with the change, it must be
institutionalized by positive control of the
process, process certification, and operator
certification. It specifies the what, who, how,
what, who, how,
where, and when
where, and when of the process and is an updating
of the monitoring activity. Standardizing the
solution prevents “backsliding.”
Final Actions: The success of the project should
be celebrated by the participants in order to
provide satisfaction for the team.
32.
Additional Comments
Additional Comments
Modifications to DMAIC
Recognize at beginning
Standardize and Integrate at the end
Replicate for multiple facilities
Six Sigma works because it gives bottom
line results; trains leaders; reduces
variation, improves quality, increases
customer satisfaction, and uses statistical
techniques.