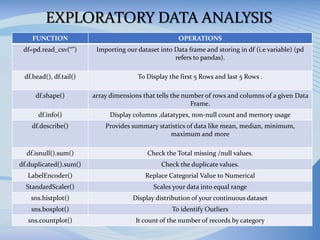
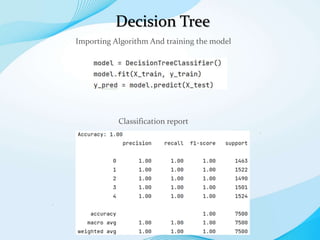
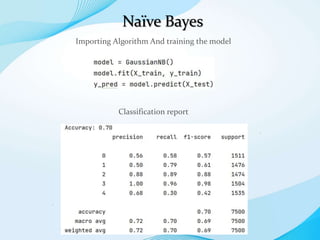
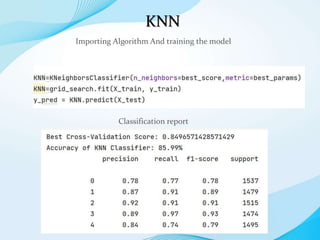
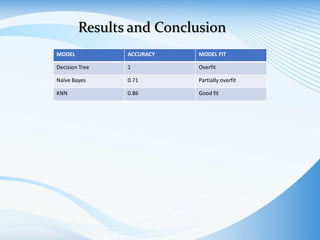
CRIME
HOTSPOT
DETECTION
TABLE CONTENT
01 PROBLEM IDENTIFICATION
02 APPROACH TO SOLVE PROBLEM
03 DATASET AND LIBRARIES
04 EDA(EXPLATORY DATA ANALYSIS)
05 TRAIN TEST SPLIT
06 BUILDING CLASSIFICATION MODEL
07 RESULTS AND CONCLUSION
PROBLEM IDENTIFICATION
To develop a machine learning model capable of
accurately identifying crime hotspots within Los Angeles.
By harnessing LAPD crime data, the model will provide
actionable insights, enabling the development of targeted
security recommendations for clients operating in high-
risk areas. Through this endeavor, the project aims to
strengthen community safety initiatives, foster
collaboration with local law enforcement, and uphold
their commitment to data-driven solutions for public
safety.
APPROACH TO SOLVE THE PROBLEM
Comparison
and
Conclusion
.
Evaluation
.
Modeling
.
Model Selection
.
Collect & Pre
processing
Data
.
Dataset and Libraries
"DATE OCC": "MM/DD/YYYY",
"TIME OCC": "In 24 hour military time.",
"AREA": "The LAPD has 21 Community Police
Stations referred to as Geographic Areas within
the department. These Geographic Areas are
sequentially numbered from 1-21.",
"AREA NAME": "The 21 Geographic Areas or
Patrol Divisions are also given a name
designation that references a landmark or the
surrounding community that it is responsible for.
For example 77th Street Division is located at the
intersection of South Broadway and 77th Street,
serving neighborhoods in South Los Angeles.",
"Rpt Dist No": "A four-digit code that represents
a sub-area within a Geographic Area. ",
"Part 1-2": “Indicates the type of crime",
"Crm Cd": "Indicates the crime committed.
(Same as Crime Code 1)",
"Vict Age": "Two character numeric",
"Vict Sex": "F - Female M - Male X - Unknown",
"Vict Descent": "Descent Code: A - Other
Asian B - Black C - Chinese D - Cambodian
F - Filipino G - Guamanian H -
Hispanic/Latin/Mexican I - American
Indian/Alaskan Native J - Japanese K -
Korean L - Laotian O - Other P - Pacific
Islander S - Samoan U - Hawaiian V -
Vietnamese W - White X - Unknown Z -
Asian Indian",
"Premis Cd": "The type of structure, vehicle,
or location where the crime took place.",
"Premis Desc": "Defines the Premise Code
provided.",
"Weapon Used Cd": "The type of weapon
used in the crime. ",
"Weapon Desc": "Defines the Weapon Used
Code provided.",
"LOCATION": "Street address of crime
incident rounded to the nearest hundred
block to maintain anonymity.",
"LAT": "Latitude",
"LON": "Longtitude"
Dataset and Libraries
Libraries:
Pandas: To Process the data as the data was in CSV
format
Matplotlib and Seaborn : It is commonly used for data
visualization and creating various types of charts and
plots
Scikit-learn: Scikit-Learn, also known as Sklearn is a
python library to implement machine learning models
and statistical modelling
EXPLORATORY DATA ANALYSIS
FUNCTION OPERATIONS
df=pd.read_csv(“”) Importing our dataset into Data frame and storing in df (i.e variable) (pd
refers to pandas).
df.head(), df.tail() To Display the first 5 Rows and last 5 Rows .
df.shape() array dimensions that tells the number of rows and columns of a given Data
Frame.
df.info() Display columns ,datatypes, non-null count and memory usage
df.describe() Provides summary statistics of data like mean, median, minimum,
maximum and more
df.isnull().sum() Check the Total missing /null values.
df.duplicated().sum() Check the duplicate values.
LabelEncoder() Replace Categorial Value to Numerical
StandardScaler() Scales your data into equal range
sns.histplot() Display distribution of your continuous dataset
sns.boxplot() To identify Outliers
sns.countplot() It count of the number of records by category
Building Classification Model
We have used 3 Algorithm to find out the best accuracy according to
our variables:
• Decision Tree
A decision tree is a machine learning model used for classification and
regression. It splits data into branches based on feature values, creating a
tree-like structure. It's easy to interpret, but can overfit, requiring
techniques like pruning to optimize.
• Naïve Bayes
Naive Bayes is a probabilistic machine learning model used for
classification. It assumes feature independence and applies Bayes' theorem.
It's efficient, particularly for large datasets, and performs well with text data
like spam detection, despite its naive assumptions.
• KNN
The K-Nearest Neighbors (KNN) algorithm is a supervised machine
learning algorithm that uses a distance-based approach to classify or predict
the grouping of a data point.
Decision Tree
.
.
Importing Algorithm And training the model
Classification report
Naïve Bayes
.
.
Importing Algorithm And training the model
Classification report
KNN
.
.
Importing Algorithm And training the model
Classification report
Results and Conclusion
MODEL ACCURACY MODEL FIT
Decision Tree 1 Overfit
Naïve Bayes 0.71 Partially overfit
KNN 0.86 Good fit
Thank You!!

Hotspot Crime Detection Using Machine Learning

  • 1.
  • 2.
    TABLE CONTENT 01 PROBLEMIDENTIFICATION 02 APPROACH TO SOLVE PROBLEM 03 DATASET AND LIBRARIES 04 EDA(EXPLATORY DATA ANALYSIS) 05 TRAIN TEST SPLIT 06 BUILDING CLASSIFICATION MODEL 07 RESULTS AND CONCLUSION
  • 3.
    PROBLEM IDENTIFICATION To developa machine learning model capable of accurately identifying crime hotspots within Los Angeles. By harnessing LAPD crime data, the model will provide actionable insights, enabling the development of targeted security recommendations for clients operating in high- risk areas. Through this endeavor, the project aims to strengthen community safety initiatives, foster collaboration with local law enforcement, and uphold their commitment to data-driven solutions for public safety.
  • 4.
    APPROACH TO SOLVETHE PROBLEM Comparison and Conclusion . Evaluation . Modeling . Model Selection . Collect & Pre processing Data .
  • 5.
    Dataset and Libraries "DATEOCC": "MM/DD/YYYY", "TIME OCC": "In 24 hour military time.", "AREA": "The LAPD has 21 Community Police Stations referred to as Geographic Areas within the department. These Geographic Areas are sequentially numbered from 1-21.", "AREA NAME": "The 21 Geographic Areas or Patrol Divisions are also given a name designation that references a landmark or the surrounding community that it is responsible for. For example 77th Street Division is located at the intersection of South Broadway and 77th Street, serving neighborhoods in South Los Angeles.", "Rpt Dist No": "A four-digit code that represents a sub-area within a Geographic Area. ", "Part 1-2": “Indicates the type of crime", "Crm Cd": "Indicates the crime committed. (Same as Crime Code 1)", "Vict Age": "Two character numeric", "Vict Sex": "F - Female M - Male X - Unknown", "Vict Descent": "Descent Code: A - Other Asian B - Black C - Chinese D - Cambodian F - Filipino G - Guamanian H - Hispanic/Latin/Mexican I - American Indian/Alaskan Native J - Japanese K - Korean L - Laotian O - Other P - Pacific Islander S - Samoan U - Hawaiian V - Vietnamese W - White X - Unknown Z - Asian Indian", "Premis Cd": "The type of structure, vehicle, or location where the crime took place.", "Premis Desc": "Defines the Premise Code provided.", "Weapon Used Cd": "The type of weapon used in the crime. ", "Weapon Desc": "Defines the Weapon Used Code provided.", "LOCATION": "Street address of crime incident rounded to the nearest hundred block to maintain anonymity.", "LAT": "Latitude", "LON": "Longtitude"
  • 6.
    Dataset and Libraries Libraries: Pandas:To Process the data as the data was in CSV format Matplotlib and Seaborn : It is commonly used for data visualization and creating various types of charts and plots Scikit-learn: Scikit-Learn, also known as Sklearn is a python library to implement machine learning models and statistical modelling
  • 7.
    EXPLORATORY DATA ANALYSIS FUNCTIONOPERATIONS df=pd.read_csv(“”) Importing our dataset into Data frame and storing in df (i.e variable) (pd refers to pandas). df.head(), df.tail() To Display the first 5 Rows and last 5 Rows . df.shape() array dimensions that tells the number of rows and columns of a given Data Frame. df.info() Display columns ,datatypes, non-null count and memory usage df.describe() Provides summary statistics of data like mean, median, minimum, maximum and more df.isnull().sum() Check the Total missing /null values. df.duplicated().sum() Check the duplicate values. LabelEncoder() Replace Categorial Value to Numerical StandardScaler() Scales your data into equal range sns.histplot() Display distribution of your continuous dataset sns.boxplot() To identify Outliers sns.countplot() It count of the number of records by category
  • 8.
    Building Classification Model Wehave used 3 Algorithm to find out the best accuracy according to our variables: • Decision Tree A decision tree is a machine learning model used for classification and regression. It splits data into branches based on feature values, creating a tree-like structure. It's easy to interpret, but can overfit, requiring techniques like pruning to optimize. • Naïve Bayes Naive Bayes is a probabilistic machine learning model used for classification. It assumes feature independence and applies Bayes' theorem. It's efficient, particularly for large datasets, and performs well with text data like spam detection, despite its naive assumptions. • KNN The K-Nearest Neighbors (KNN) algorithm is a supervised machine learning algorithm that uses a distance-based approach to classify or predict the grouping of a data point.
  • 9.
    Decision Tree . . Importing AlgorithmAnd training the model Classification report
  • 10.
    Naïve Bayes . . Importing AlgorithmAnd training the model Classification report
  • 11.
    KNN . . Importing Algorithm Andtraining the model Classification report
  • 12.
    Results and Conclusion MODELACCURACY MODEL FIT Decision Tree 1 Overfit Naïve Bayes 0.71 Partially overfit KNN 0.86 Good fit
  • 13.