The document presents a seminar on high-dimensional data visualization by Fabian Keller, outlining various dimensionality reduction techniques such as PCA, LLE, Isomap, and t-SNE, as well as visualization methods including scatterplots and parallel coordinate plots. It emphasizes the necessity of choosing appropriate techniques based on application needs, citing several examples across different fields like biology, finance, and big data analysis. The conclusion highlights the importance of tailoring visualization methods to specific requirements in handling high-dimensional data.

![Goal
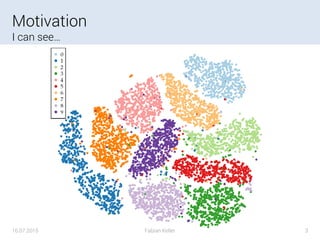
Of dimensionality reduction
• High Dimensional Data (>>1000 dimensions)
• Reduce Dimensions (for Clustering / Learning / …)
• Extract Meaning
• Visualize and Interact
16.07.2015 Fabian Keller 5
[c.f. Card et al 1999; dos Santos and Brodlie 2004]](https://image.slidesharecdn.com/largescalevisualization-160912204720/85/High-Dimensional-Data-Visualization-5-320.jpg)
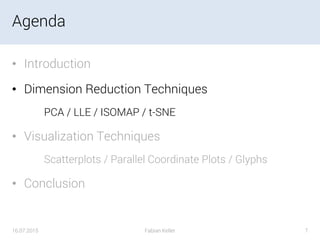

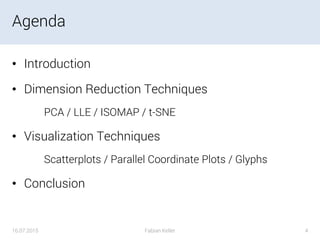
![Principal Component Analysis (PCA)
Eigen-*
16.07.2015 Fabian Keller 9
• Linear, Global
• Find “Principal
Components”
• Minimize
Reconstruction Error
[isomorphismes, 2014]](https://image.slidesharecdn.com/largescalevisualization-160912204720/85/High-Dimensional-Data-Visualization-9-320.jpg)
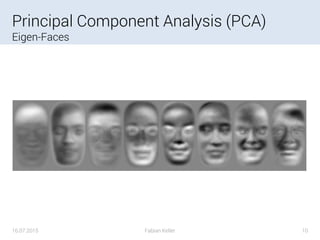
![Local-Linear Embedding (LLE)
Assumes the data is locally linear
• Non-Linear, Local
• Select neighbors and
approximate linearly
• Map to lower
dimension
16.07.2015 Fabian Keller 11
[Roweis, 2000]](https://image.slidesharecdn.com/largescalevisualization-160912204720/85/High-Dimensional-Data-Visualization-11-320.jpg)
![ISOMAP
Isometric feature mapping
16.07.2015 Fabian Keller 12
• Non-linear, Global
• K-Nearest Neighbors
• Construct
neighborhood graph
• Compute shortest
paths
[Balasubramanian, 2002]](https://image.slidesharecdn.com/largescalevisualization-160912204720/85/High-Dimensional-Data-Visualization-12-320.jpg)
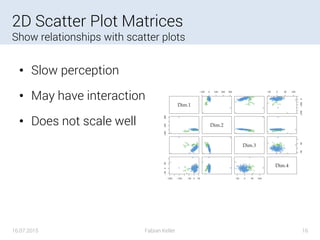
![2D Scatter Plot Matrices
Let an algorithm choose the plots
16.07.2015 Fabian Keller 17
[Zheng, 2014]](https://image.slidesharecdn.com/largescalevisualization-160912204720/85/High-Dimensional-Data-Visualization-17-320.jpg)
![3D Scatter Plots
Interactive
• Only one additional dimension
• Expensive interaction, useless without!
• Limited benefit compared to 2D scatter plots
16.07.2015 Fabian Keller 18
[Sedlmair, 2013]](https://image.slidesharecdn.com/largescalevisualization-160912204720/85/High-Dimensional-Data-Visualization-18-320.jpg)
![Parallel Coordinate Plot
Display >2 dimensions
16.07.2015 Fabian Keller 19
Interaction Examples: https://syntagmatic.github.io/parallel-coordinates/
• Noisy
• Slow perception
• Meaning of x-axis?!
[Harvard Business Manager, 2015-07]](https://image.slidesharecdn.com/largescalevisualization-160912204720/85/High-Dimensional-Data-Visualization-19-320.jpg)
![Glyphs
Encode important information
• Memorable semantics
• Small
• Details through
interaction
• Overwhelming?
16.07.2015 Fabian Keller 20
[Fuchs, 2013]](https://image.slidesharecdn.com/largescalevisualization-160912204720/85/High-Dimensional-Data-Visualization-20-320.jpg)
![Glyphs
Domain-specific clues
16.07.2015 Fabian Keller 21
[Fuchs, 2014]](https://image.slidesharecdn.com/largescalevisualization-160912204720/85/High-Dimensional-Data-Visualization-21-320.jpg)
![Glyphs
Time series data
16.07.2015 Fabian Keller 22
[Kintzel, 2011]](https://image.slidesharecdn.com/largescalevisualization-160912204720/85/High-Dimensional-Data-Visualization-22-320.jpg)


![ViT (Vision Transformer) Review [CDM]](https://cdn.slidesharecdn.com/ss_thumbnails/vitreviewcdm-201012184226-thumbnail.jpg?width=640&height=640&fit=bounds)


![제 23회 보아즈(BOAZ) 빅데이터 컨퍼런스 - [MBOAX] : ABSA를 활용한 소비자 반응 분석 기반 운영 효율화 대시보드 설계](https://cdn.slidesharecdn.com/ss_thumbnails/3-1boaz23rdconferencemboax-260203102709-9d519923-thumbnail.jpg?width=640&height=640&fit=bounds)


