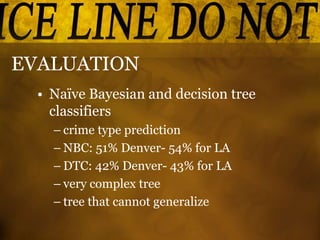
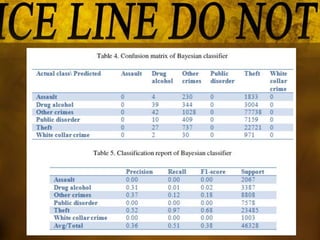
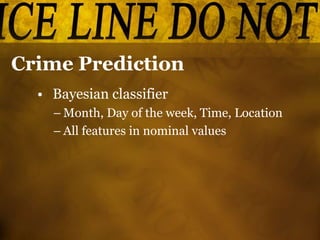
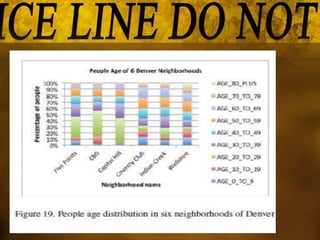
Crime Prediction Using Data Mining
Alia ALHamwi
Joelle Shannakian
Khaled Ismaeel
Mohammad AlBash
Contents
• Introduction
• DataSet
• Data Processing
• Models Building
• Key Results
Introduction
• find spatial and temporal criminal
hotspots using a set of real-world
datasets of crimes.
• predict what type of crime might
occur next in a specific location
within a particular time.
Goal
• police forces & resources
• stay away
• improve living place choices
Data Sets
• Main Fields
• Crime Category
• DateTime
• Neighborhoods of the city (location)
• Is it Crime or accident ?
DENVER
Los Angeles
Data Processing
• Data Cleaning
• Data Reduction
– among the available 19 attributes in
Denver crimes dataset, we just selected four.
– crime vs accidents .
• Data Integration
– Crime_Type,Crime_Date, and Crime_Location .
– Crime_Date = Crime_Month, Crime_Day, and
Crime_Time .
Data Processing
• Data Transformation and Discretization
Models Building
• Apriori Algorithm
– It scans the dataset to collect all itemsets that
satisfy a predefined minimum support
(optimum choice  Denver 0.0012 & Los
Angeles 0.0018).
– List of all crime hotspots.
– Location and time features, without the crime
type feature.
– Restriction, three specific itemsets  Location,
Day, Time.
• Naïve Bayesian Classifier
– Supervised learning algorithm.
– Statistical model that predicts class membership
probabilities based on Bayes’ theorem.
– P (CrimeType|Location,Day,Month,Time)
– Crime features contain  month, day, time,
location.
– Class Label  Crime type.
• Decision Tree Classifier
– Supervised Learning algorithm.
– Learning simple decision rules implied from the
data features  predict class label.
– Best tree  entropy & Information gain.
– generated tree was complex  restriction  ten
maximum leaf nodes.
EVALUATION
• Apriori Algorithm
– frequent crime patterns
– )+) readiness , easiness ,implement
– (-) very long running time
EVALUATION
• Naïve Bayesian and decision tree
classifiers
– crime type prediction
– NBC: 51% Denver- 54% for LA
– DTC: 42% Denver- 43% for LA
– very complex tree
– tree that cannot generalize
Key Results
• Crime Frequent Hotspots
• Crime Prediction
• Crime Hotspots Demographics Analysis
Crime Frequent Hotspots
• Apriori algorithm
• finding spatial and temporal criminal
hotspots
• Denver : 62 patterns
• Los Angeles : 59 patterns.
Crime Prediction
• Bayesian classifier
– Month, Day of the week, Time, Location
– All features in nominal values
Crime Hotspots Demographics
Analysis
• Relationship between crime rate and
demographics
– large population and large number of housing
– vacant houses and the dangerous locations
– people’s age and gender
– More man  more dangerous
– More female  more safe
– ages from 20 to 29
References
• https://arxiv.org/ftp/arxiv/papers/1
508/1508.02050.pdf

Crime prediction-using-data-mining

  • 1.
    Crime Prediction UsingData Mining Alia ALHamwi Joelle Shannakian Khaled Ismaeel Mohammad AlBash
  • 2.
    Contents • Introduction • DataSet •Data Processing • Models Building • Key Results
  • 3.
    Introduction • find spatialand temporal criminal hotspots using a set of real-world datasets of crimes. • predict what type of crime might occur next in a specific location within a particular time.
  • 4.
    Goal • police forces& resources • stay away • improve living place choices
  • 5.
    Data Sets • MainFields • Crime Category • DateTime • Neighborhoods of the city (location) • Is it Crime or accident ?
  • 6.
  • 7.
  • 8.
    Data Processing • DataCleaning • Data Reduction – among the available 19 attributes in Denver crimes dataset, we just selected four. – crime vs accidents . • Data Integration – Crime_Type,Crime_Date, and Crime_Location . – Crime_Date = Crime_Month, Crime_Day, and Crime_Time .
  • 9.
    Data Processing • DataTransformation and Discretization
  • 10.
    Models Building • AprioriAlgorithm – It scans the dataset to collect all itemsets that satisfy a predefined minimum support (optimum choice  Denver 0.0012 & Los Angeles 0.0018). – List of all crime hotspots. – Location and time features, without the crime type feature. – Restriction, three specific itemsets  Location, Day, Time.
  • 11.
    • Naïve BayesianClassifier – Supervised learning algorithm. – Statistical model that predicts class membership probabilities based on Bayes’ theorem. – P (CrimeType|Location,Day,Month,Time) – Crime features contain  month, day, time, location. – Class Label  Crime type.
  • 12.
    • Decision TreeClassifier – Supervised Learning algorithm. – Learning simple decision rules implied from the data features  predict class label. – Best tree  entropy & Information gain. – generated tree was complex  restriction  ten maximum leaf nodes.
  • 13.
    EVALUATION • Apriori Algorithm –frequent crime patterns – )+) readiness , easiness ,implement – (-) very long running time
  • 14.
    EVALUATION • Naïve Bayesianand decision tree classifiers – crime type prediction – NBC: 51% Denver- 54% for LA – DTC: 42% Denver- 43% for LA – very complex tree – tree that cannot generalize
  • 16.
    Key Results • CrimeFrequent Hotspots • Crime Prediction • Crime Hotspots Demographics Analysis
  • 17.
    Crime Frequent Hotspots •Apriori algorithm • finding spatial and temporal criminal hotspots • Denver : 62 patterns • Los Angeles : 59 patterns.
  • 18.
    Crime Prediction • Bayesianclassifier – Month, Day of the week, Time, Location – All features in nominal values
  • 20.
    Crime Hotspots Demographics Analysis •Relationship between crime rate and demographics – large population and large number of housing – vacant houses and the dangerous locations – people’s age and gender – More man  more dangerous – More female  more safe – ages from 20 to 29
  • 23.