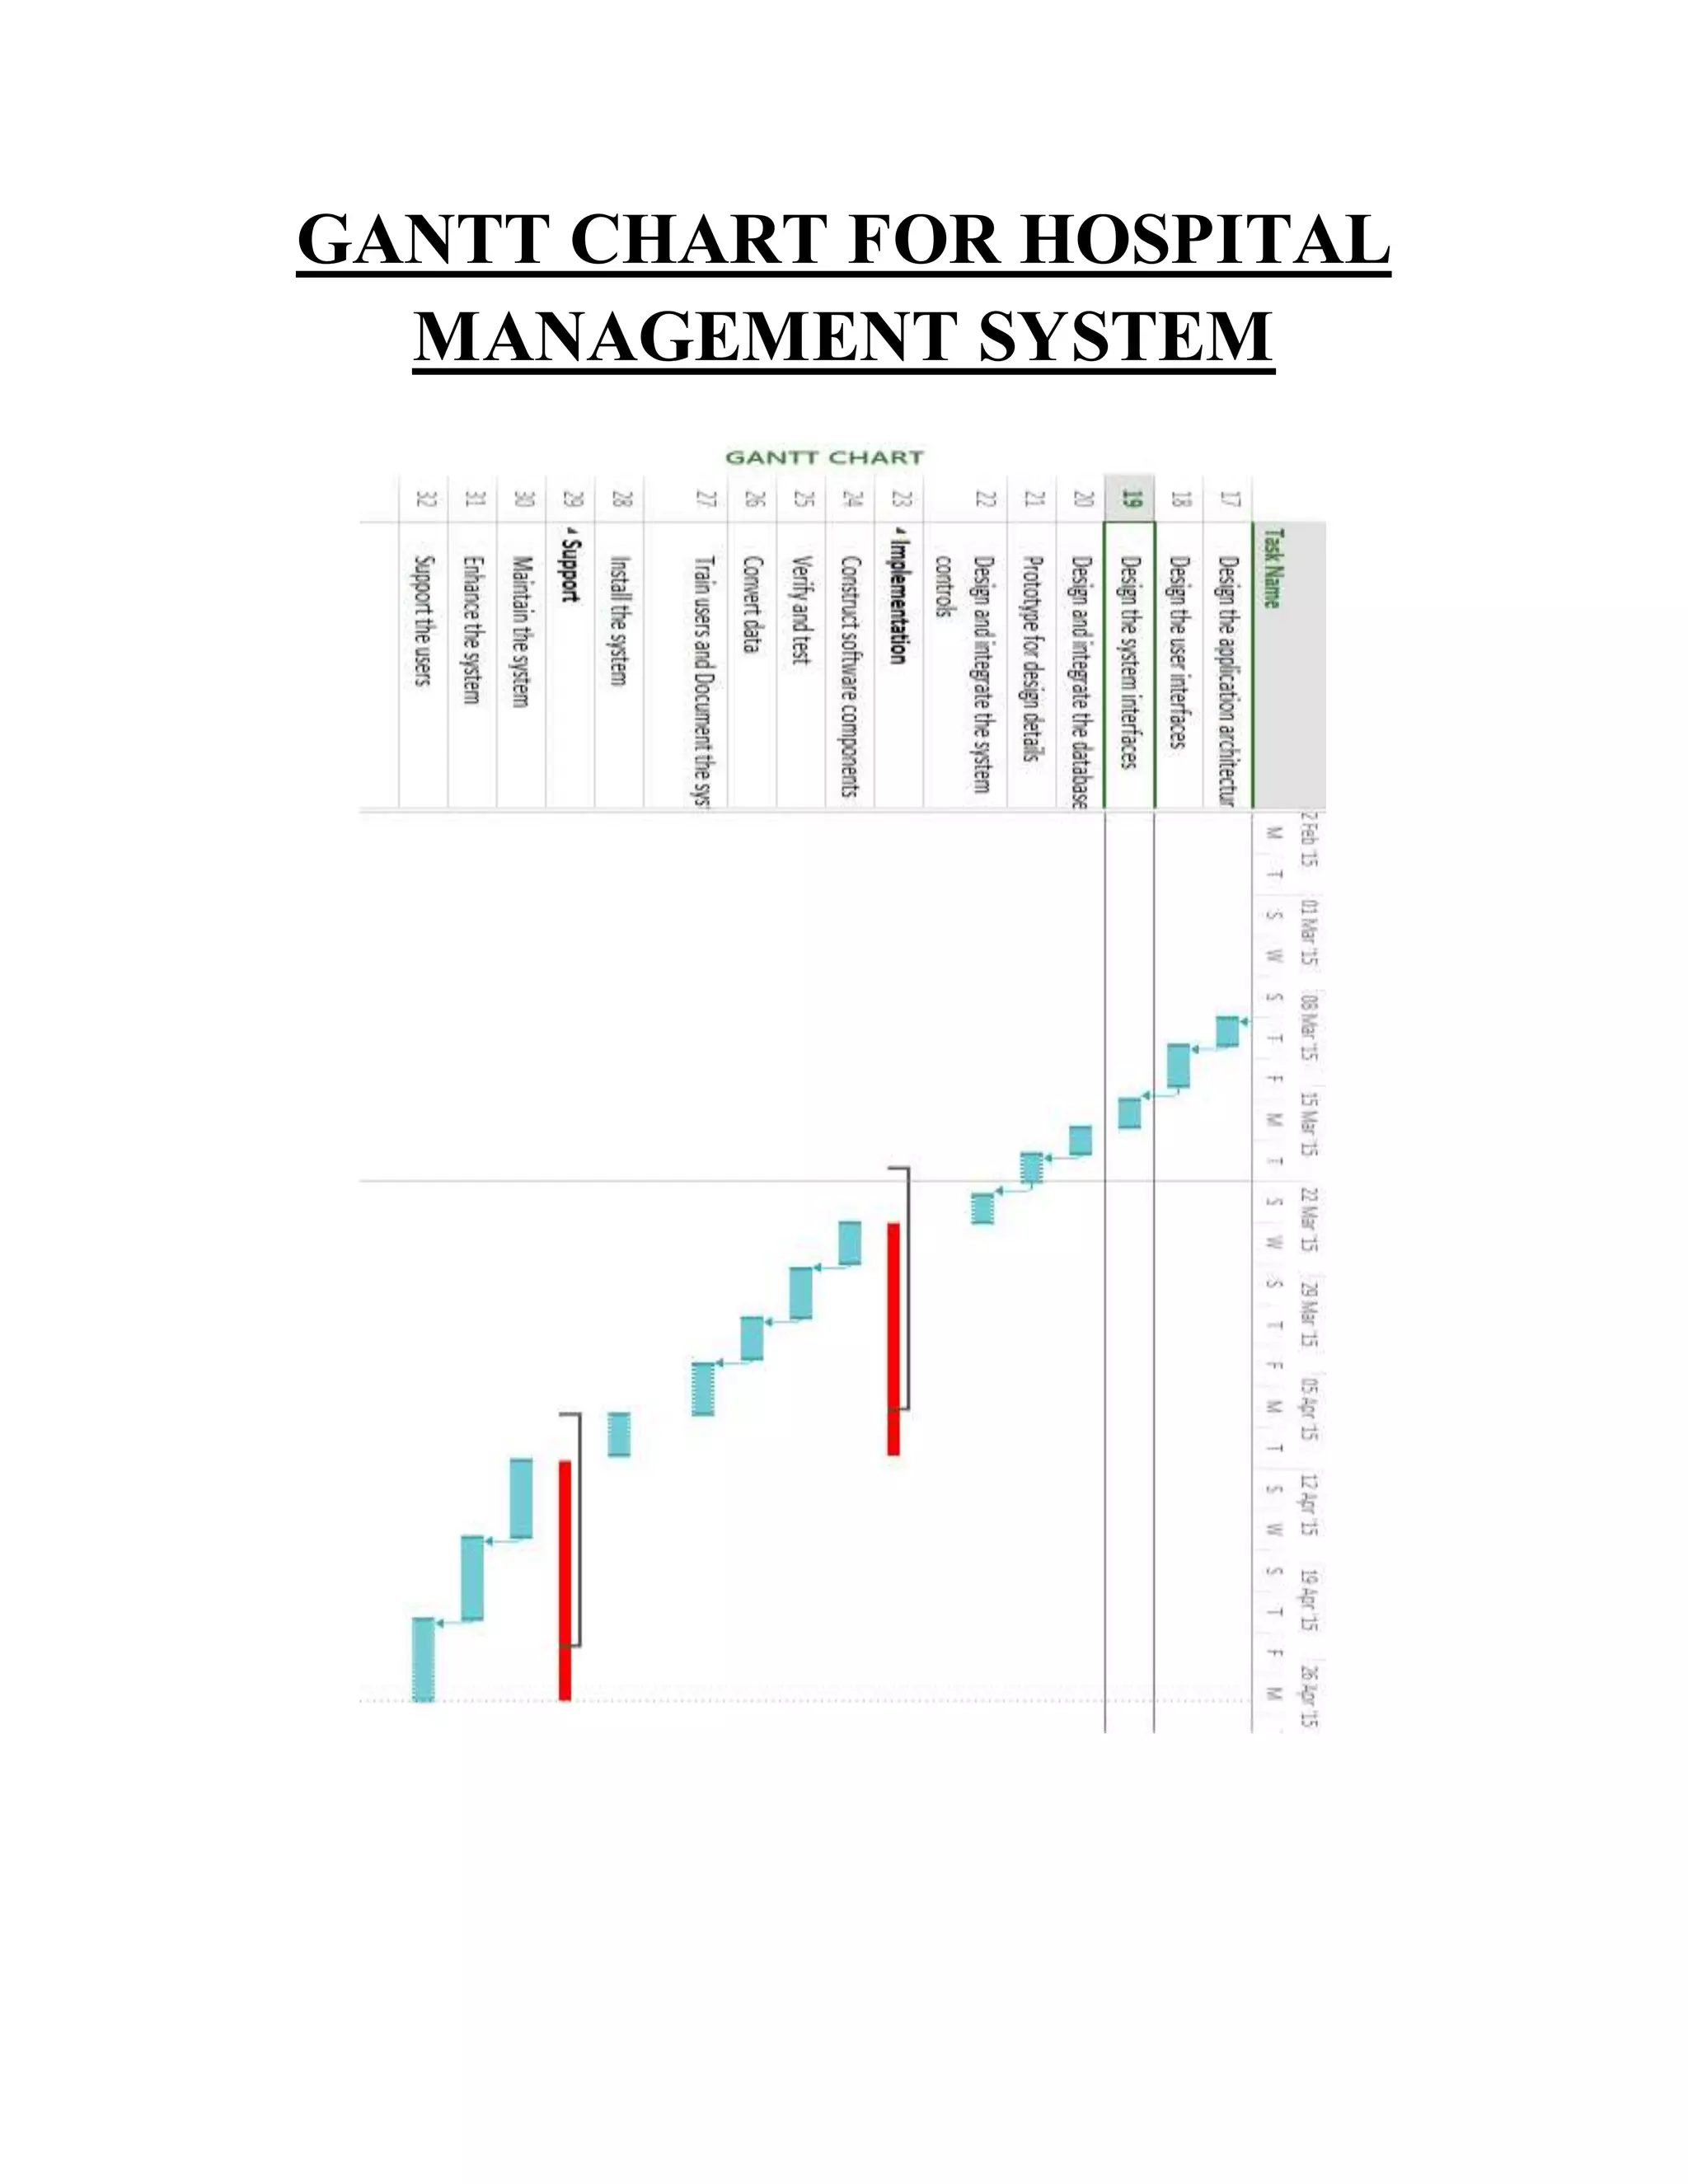
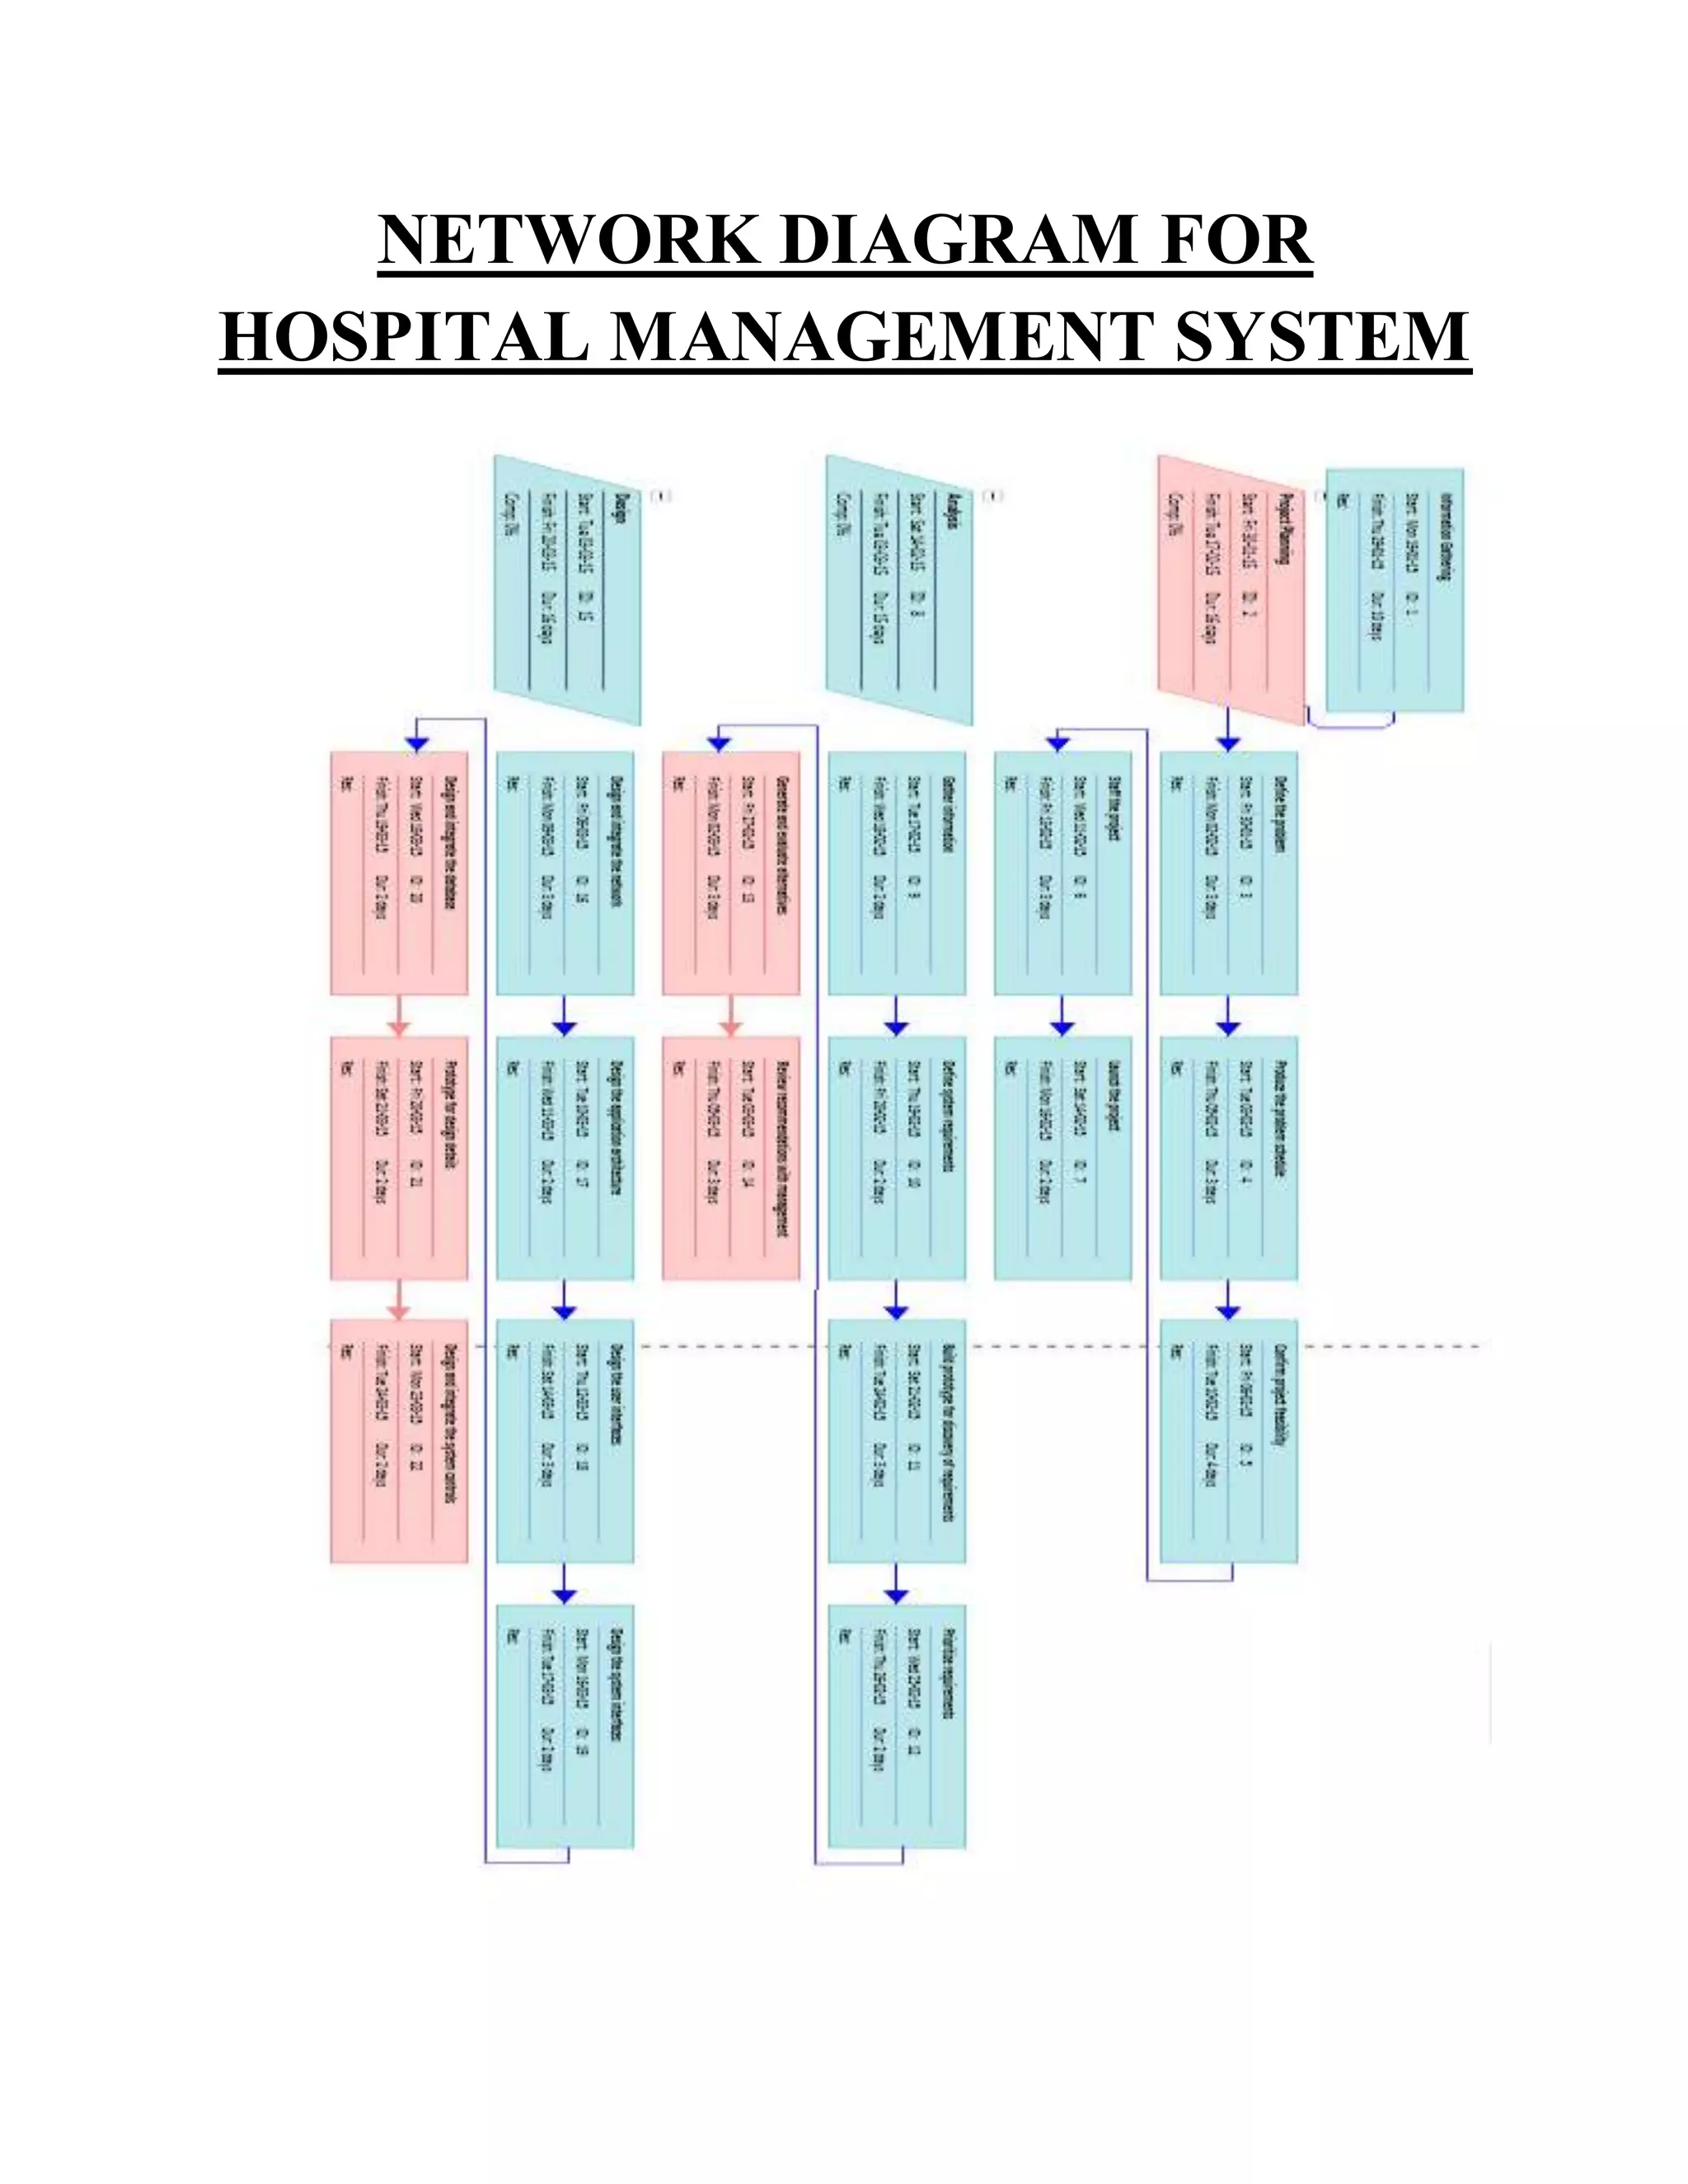
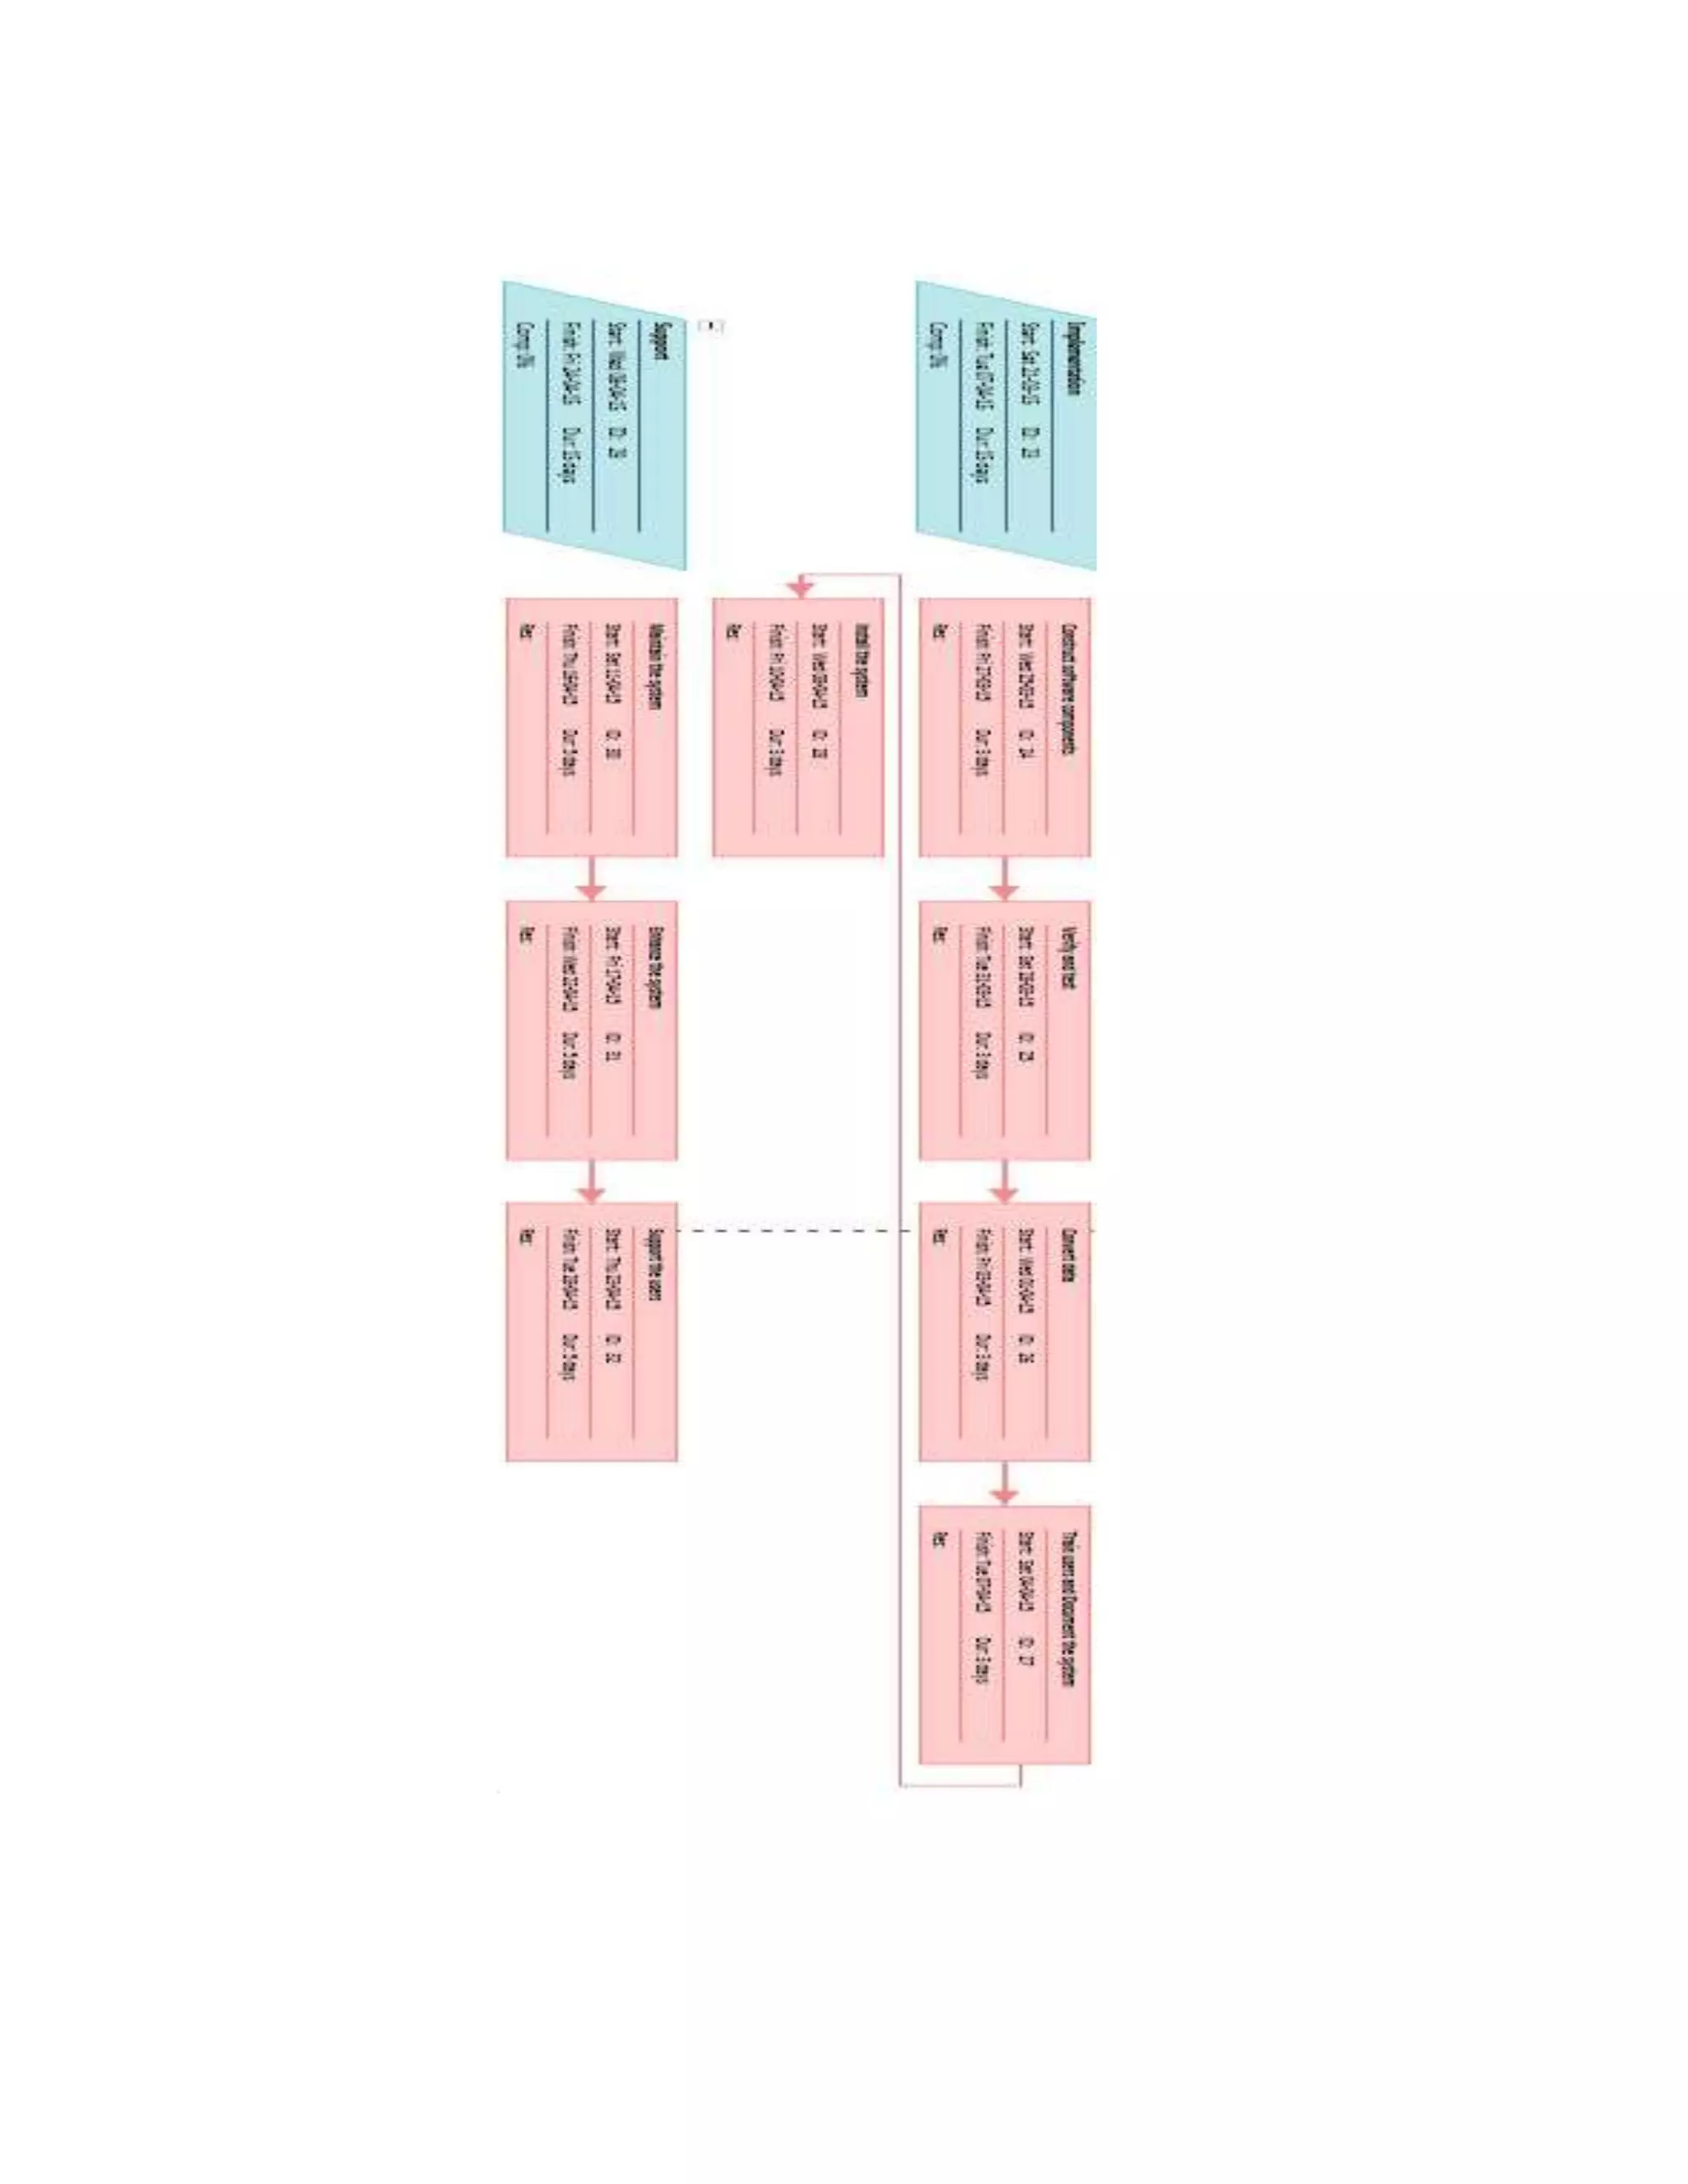
The document presents a detailed analysis of a network diagram for a hospital management system, including a Gantt chart and critical path methodology. It outlines the phases of the project, from information gathering and analysis to implementation and support, emphasizing the importance of accurately reflecting relationships between tasks. Additionally, it discusses the creation and analysis of network diagrams, tools available for development, and essential inputs required for effective project scheduling.
ACTIVITY ANALYSIS FORAON
DESCRIPTION
ESTIMATE
D
DURATIO
N(Days)
START FINISH
PREDECES
SOR
InformationGathering 10 days Mon 19-01-15Thu 29-01-15
Project Planning 16 days Fri 30-01-15 Tue 17-02-15
Define the problem 3 days Fri 30-01-15 Mon 02-02-15 1
Producethe problem
schedule
3 days Tue 03-02-15 Thu 05-02-15 3
Confirmproject
feasibility
4 days Fri 06-02-15 Tue 10-02-15 4
Staff the project 3 days Wed 11-02-15Fri 13-02-15
Launch the project 2 days Sat 14-02-15 Mon 16-02-15 6
Analysis 15 days Sat 14-02-15 Tue 03-03-15
Gather information 2 days Tue 17-02-15 Wed 18-02-15
Define system
requirements
2 days Thu 19-02-15 Fri 20-02-15 9
Build prototype for
discovery of
requirements
3 days Sat 21-02-15 Tue 24-02-15 10
Prioritize
requirements
2 days Wed 25-02-15Thu 26-02-15 11
Generate and
evaluate alternatives
3 days Fri 27-02-15 Mon 02-03-15
Review
recommendations with
management
3 days Tue 03-03-15 Thu 05-03-15 13
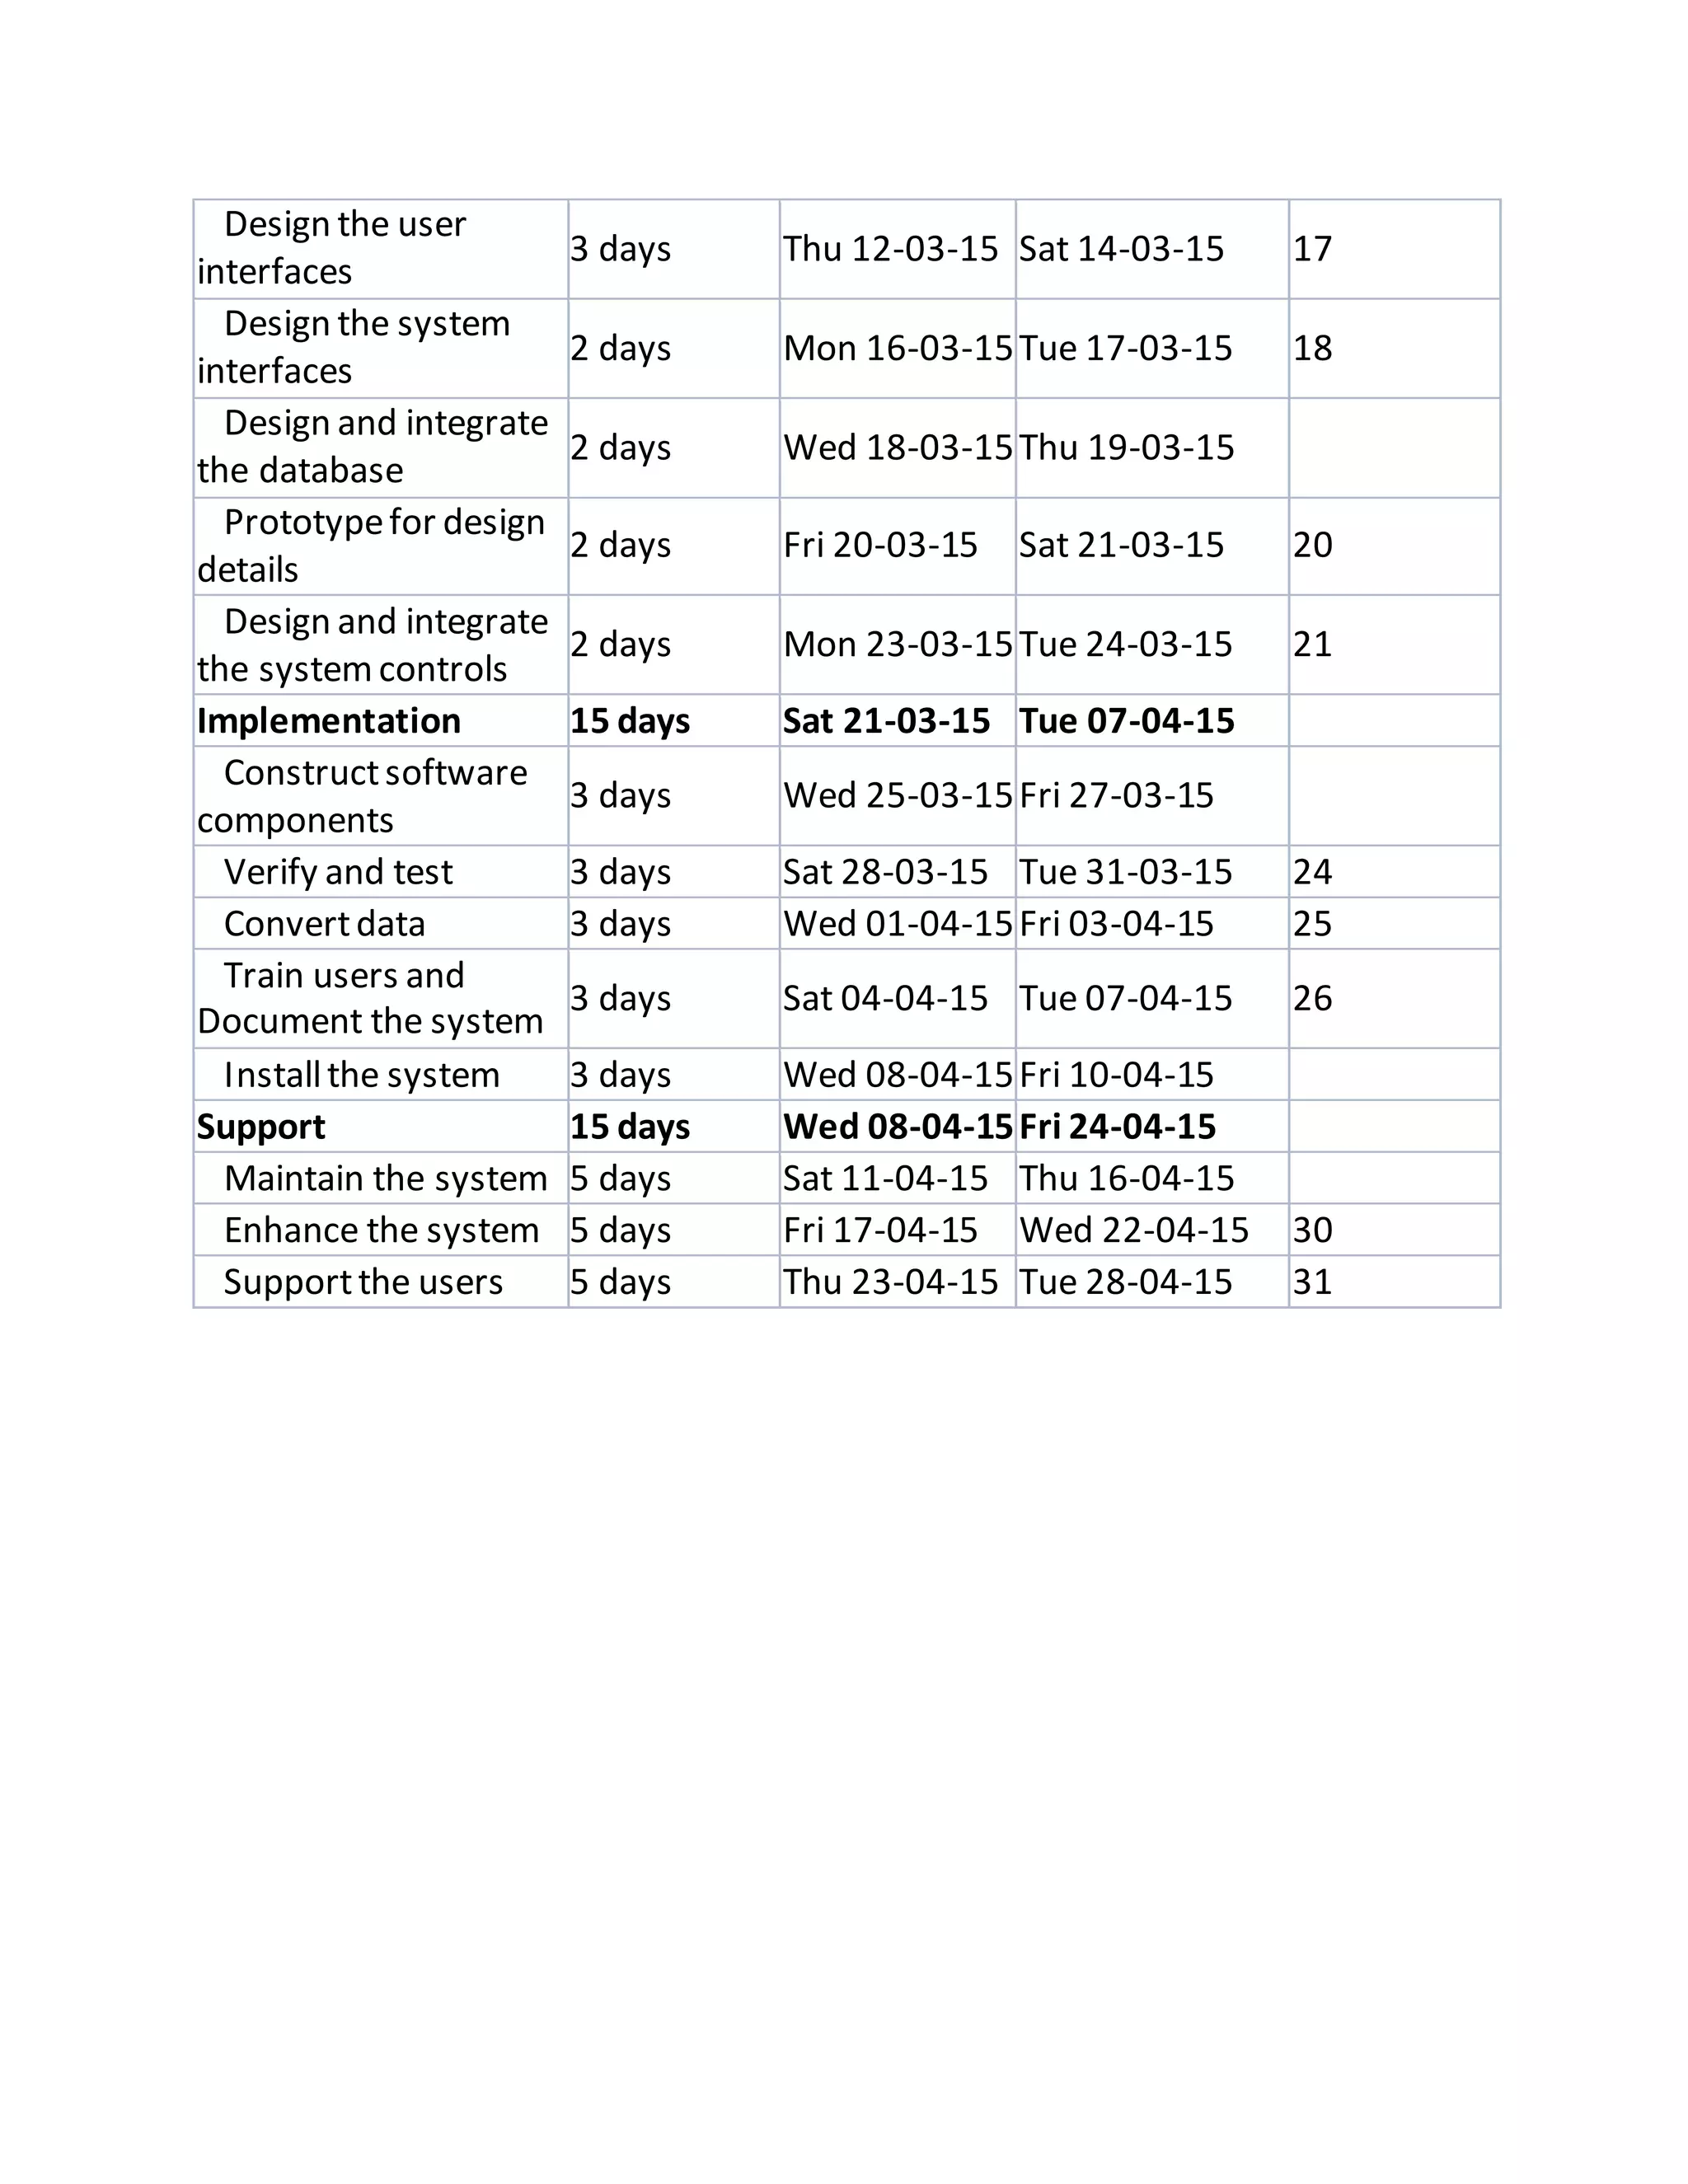
Design 16 days Tue 03-03-15 Fri 20-03-15
Design and integrate
the network
3 days Fri 06-03-15 Mon 09-03-15
Design the
application
architecture
2 days Tue 10-03-15 Wed 11-03-15 16
6.
Design the user
interfaces
3days Thu 12-03-15 Sat 14-03-15 17
Design the system
interfaces
2 days Mon 16-03-15Tue 17-03-15 18
Design and integrate
the database
2 days Wed 18-03-15Thu 19-03-15
Prototypefor design
details
2 days Fri 20-03-15 Sat 21-03-15 20
Design and integrate
the systemcontrols
2 days Mon 23-03-15Tue 24-03-15 21
Implementation 15 days Sat 21-03-15 Tue 07-04-15
Constructsoftware
components
3 days Wed 25-03-15Fri 27-03-15
Verify and test 3 days Sat 28-03-15 Tue 31-03-15 24
Convertdata 3 days Wed 01-04-15Fri 03-04-15 25
Train users and
Document the system
3 days Sat 04-04-15 Tue 07-04-15 26
Installthe system 3 days Wed 08-04-15Fri 10-04-15
Support 15 days Wed 08-04-15Fri 24-04-15
Maintain the system 5 days Sat 11-04-15 Thu 16-04-15
Enhance the system 5 days Fri 17-04-15 Wed 22-04-15 30
Supportthe users 5 days Thu 23-04-15 Tue 28-04-15 31
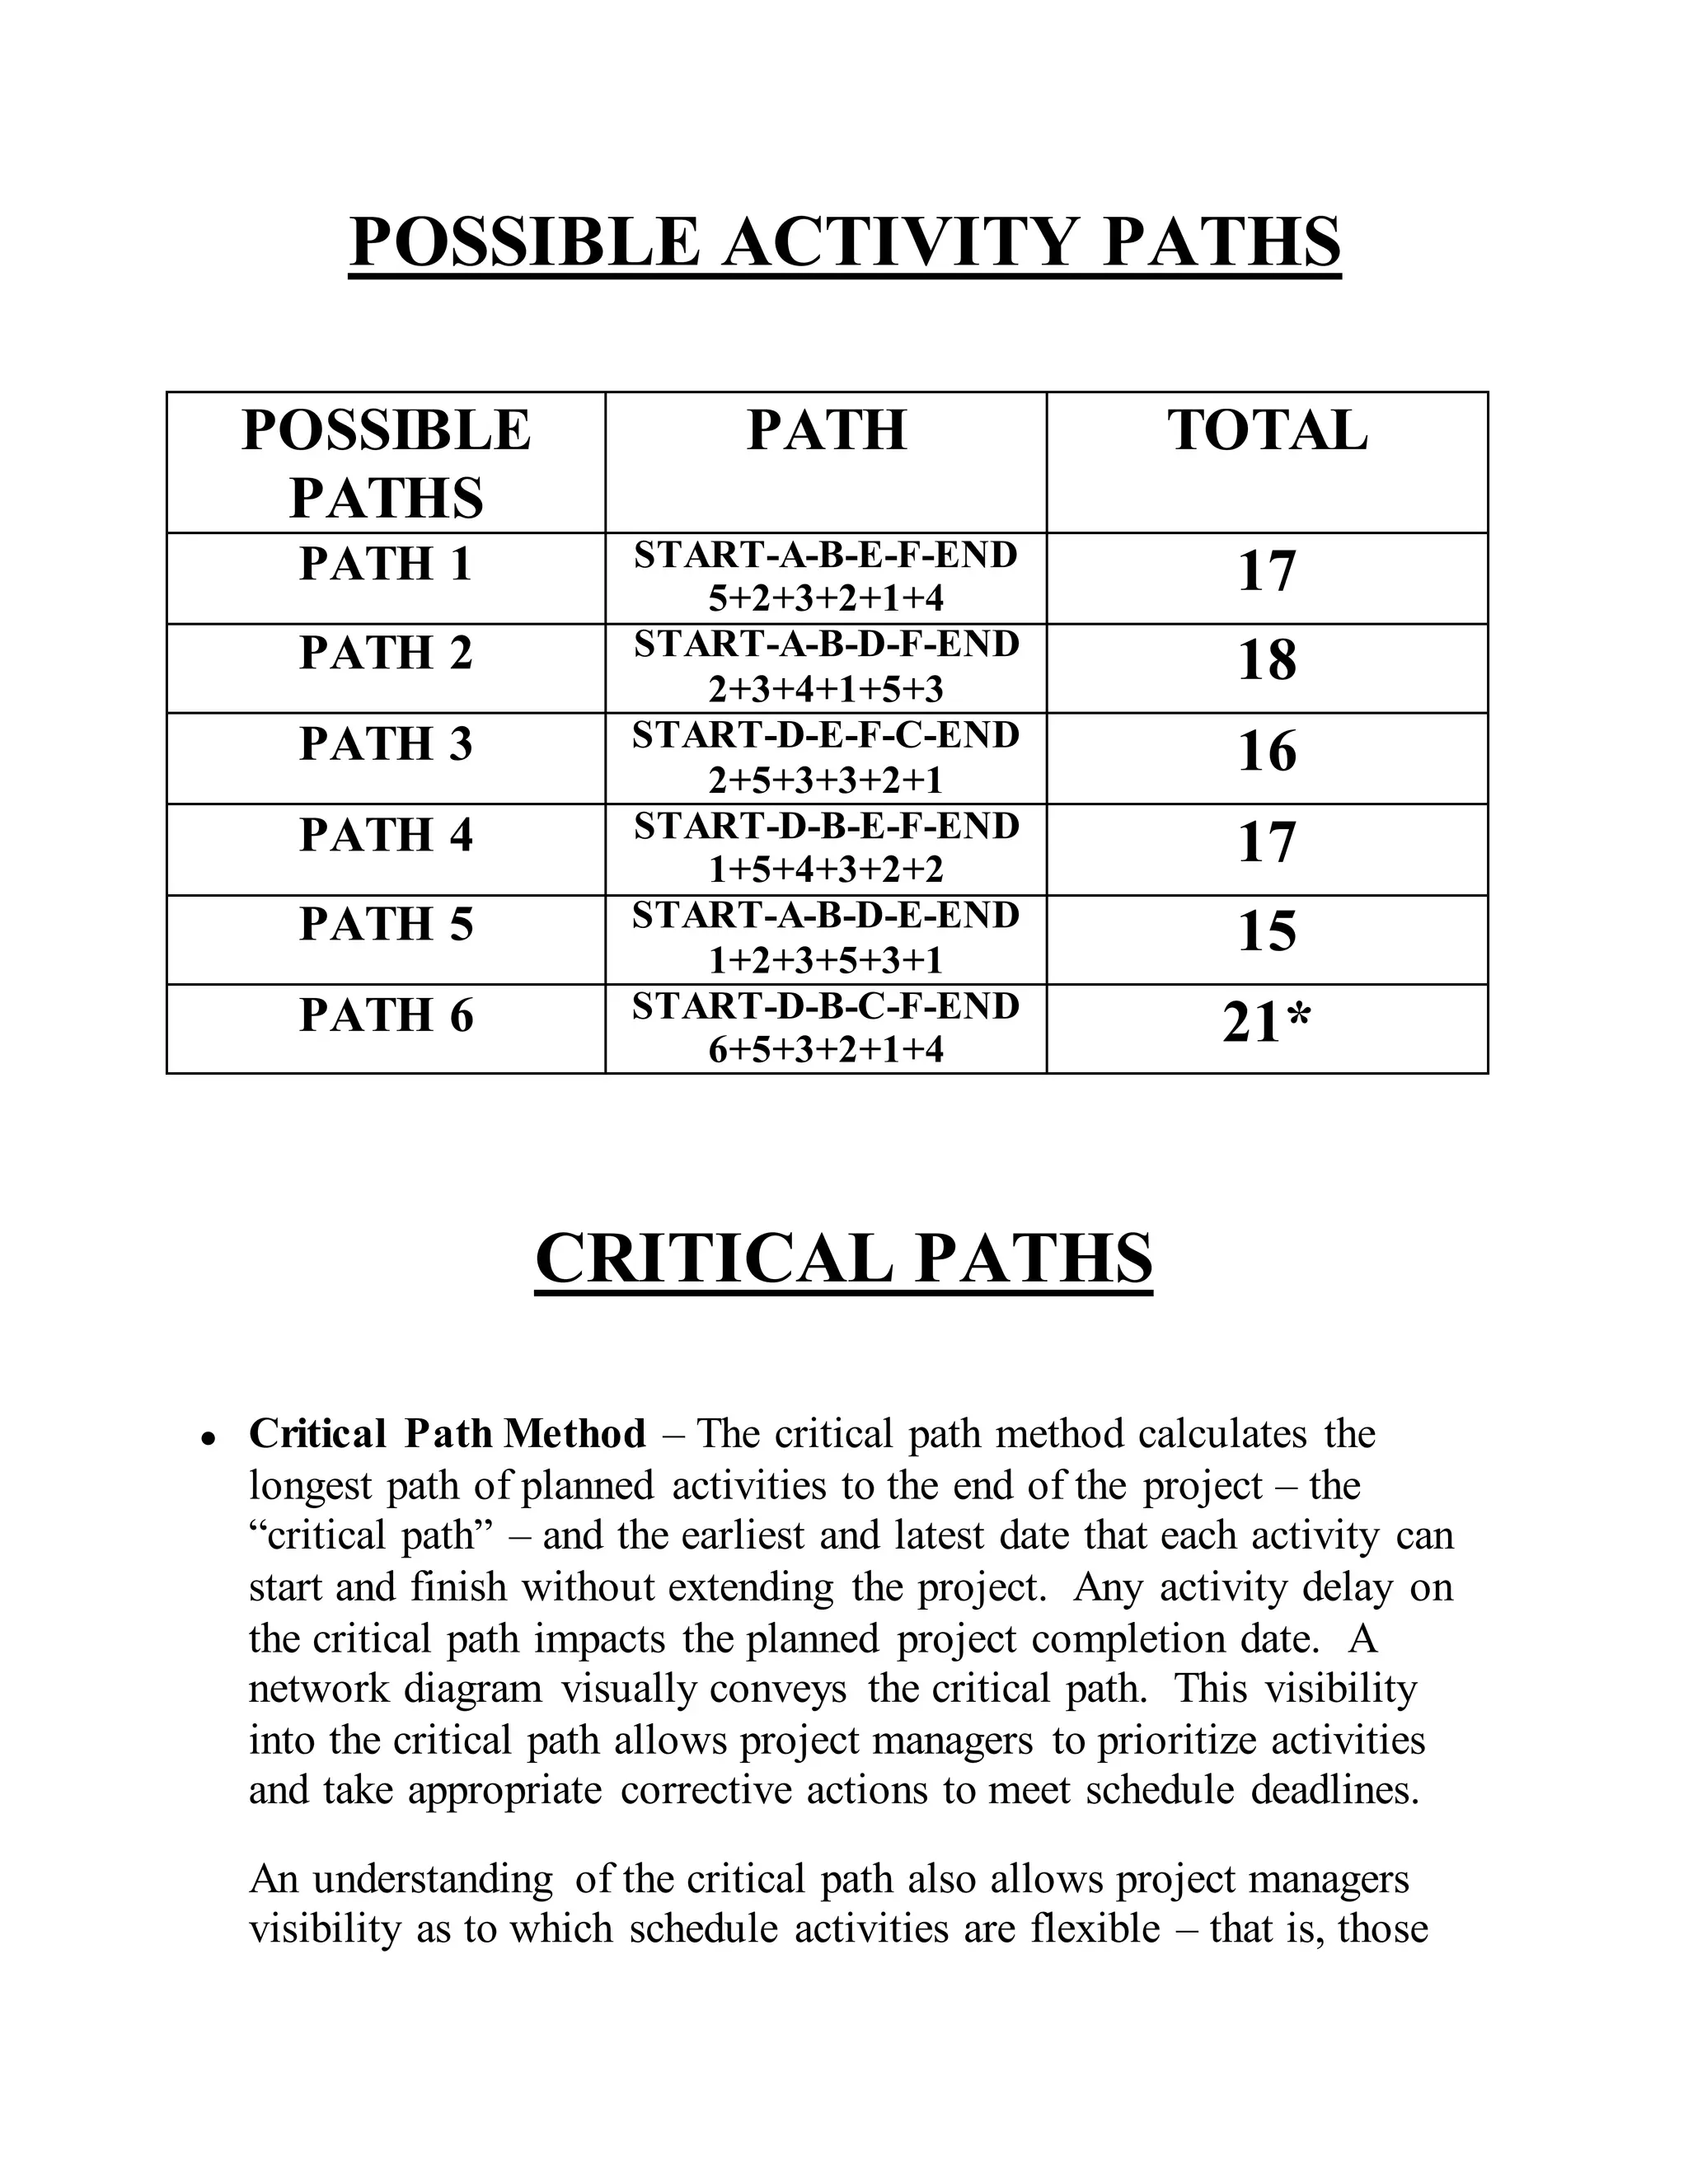
POSSIBLE ACTIVITY PATHS
POSSIBLE
PATHS
PATHTOTAL
PATH 1 START-A-B-E-F-END
5+2+3+2+1+4
17
PATH 2 START-A-B-D-F-END
2+3+4+1+5+3
18
PATH 3 START-D-E-F-C-END
2+5+3+3+2+1
16
PATH 4 START-D-B-E-F-END
1+5+4+3+2+2
17
PATH 5 START-A-B-D-E-END
1+2+3+5+3+1
15
PATH 6 START-D-B-C-F-END
6+5+3+2+1+4
21*
CRITICAL PATHS
● Critical Path Method – The critical path method calculates the
longest path of planned activities to the end of the project – the
“critical path” – and the earliest and latest date that each activity can
start and finish without extending the project. Any activity delay on
the critical path impacts the planned project completion date. A
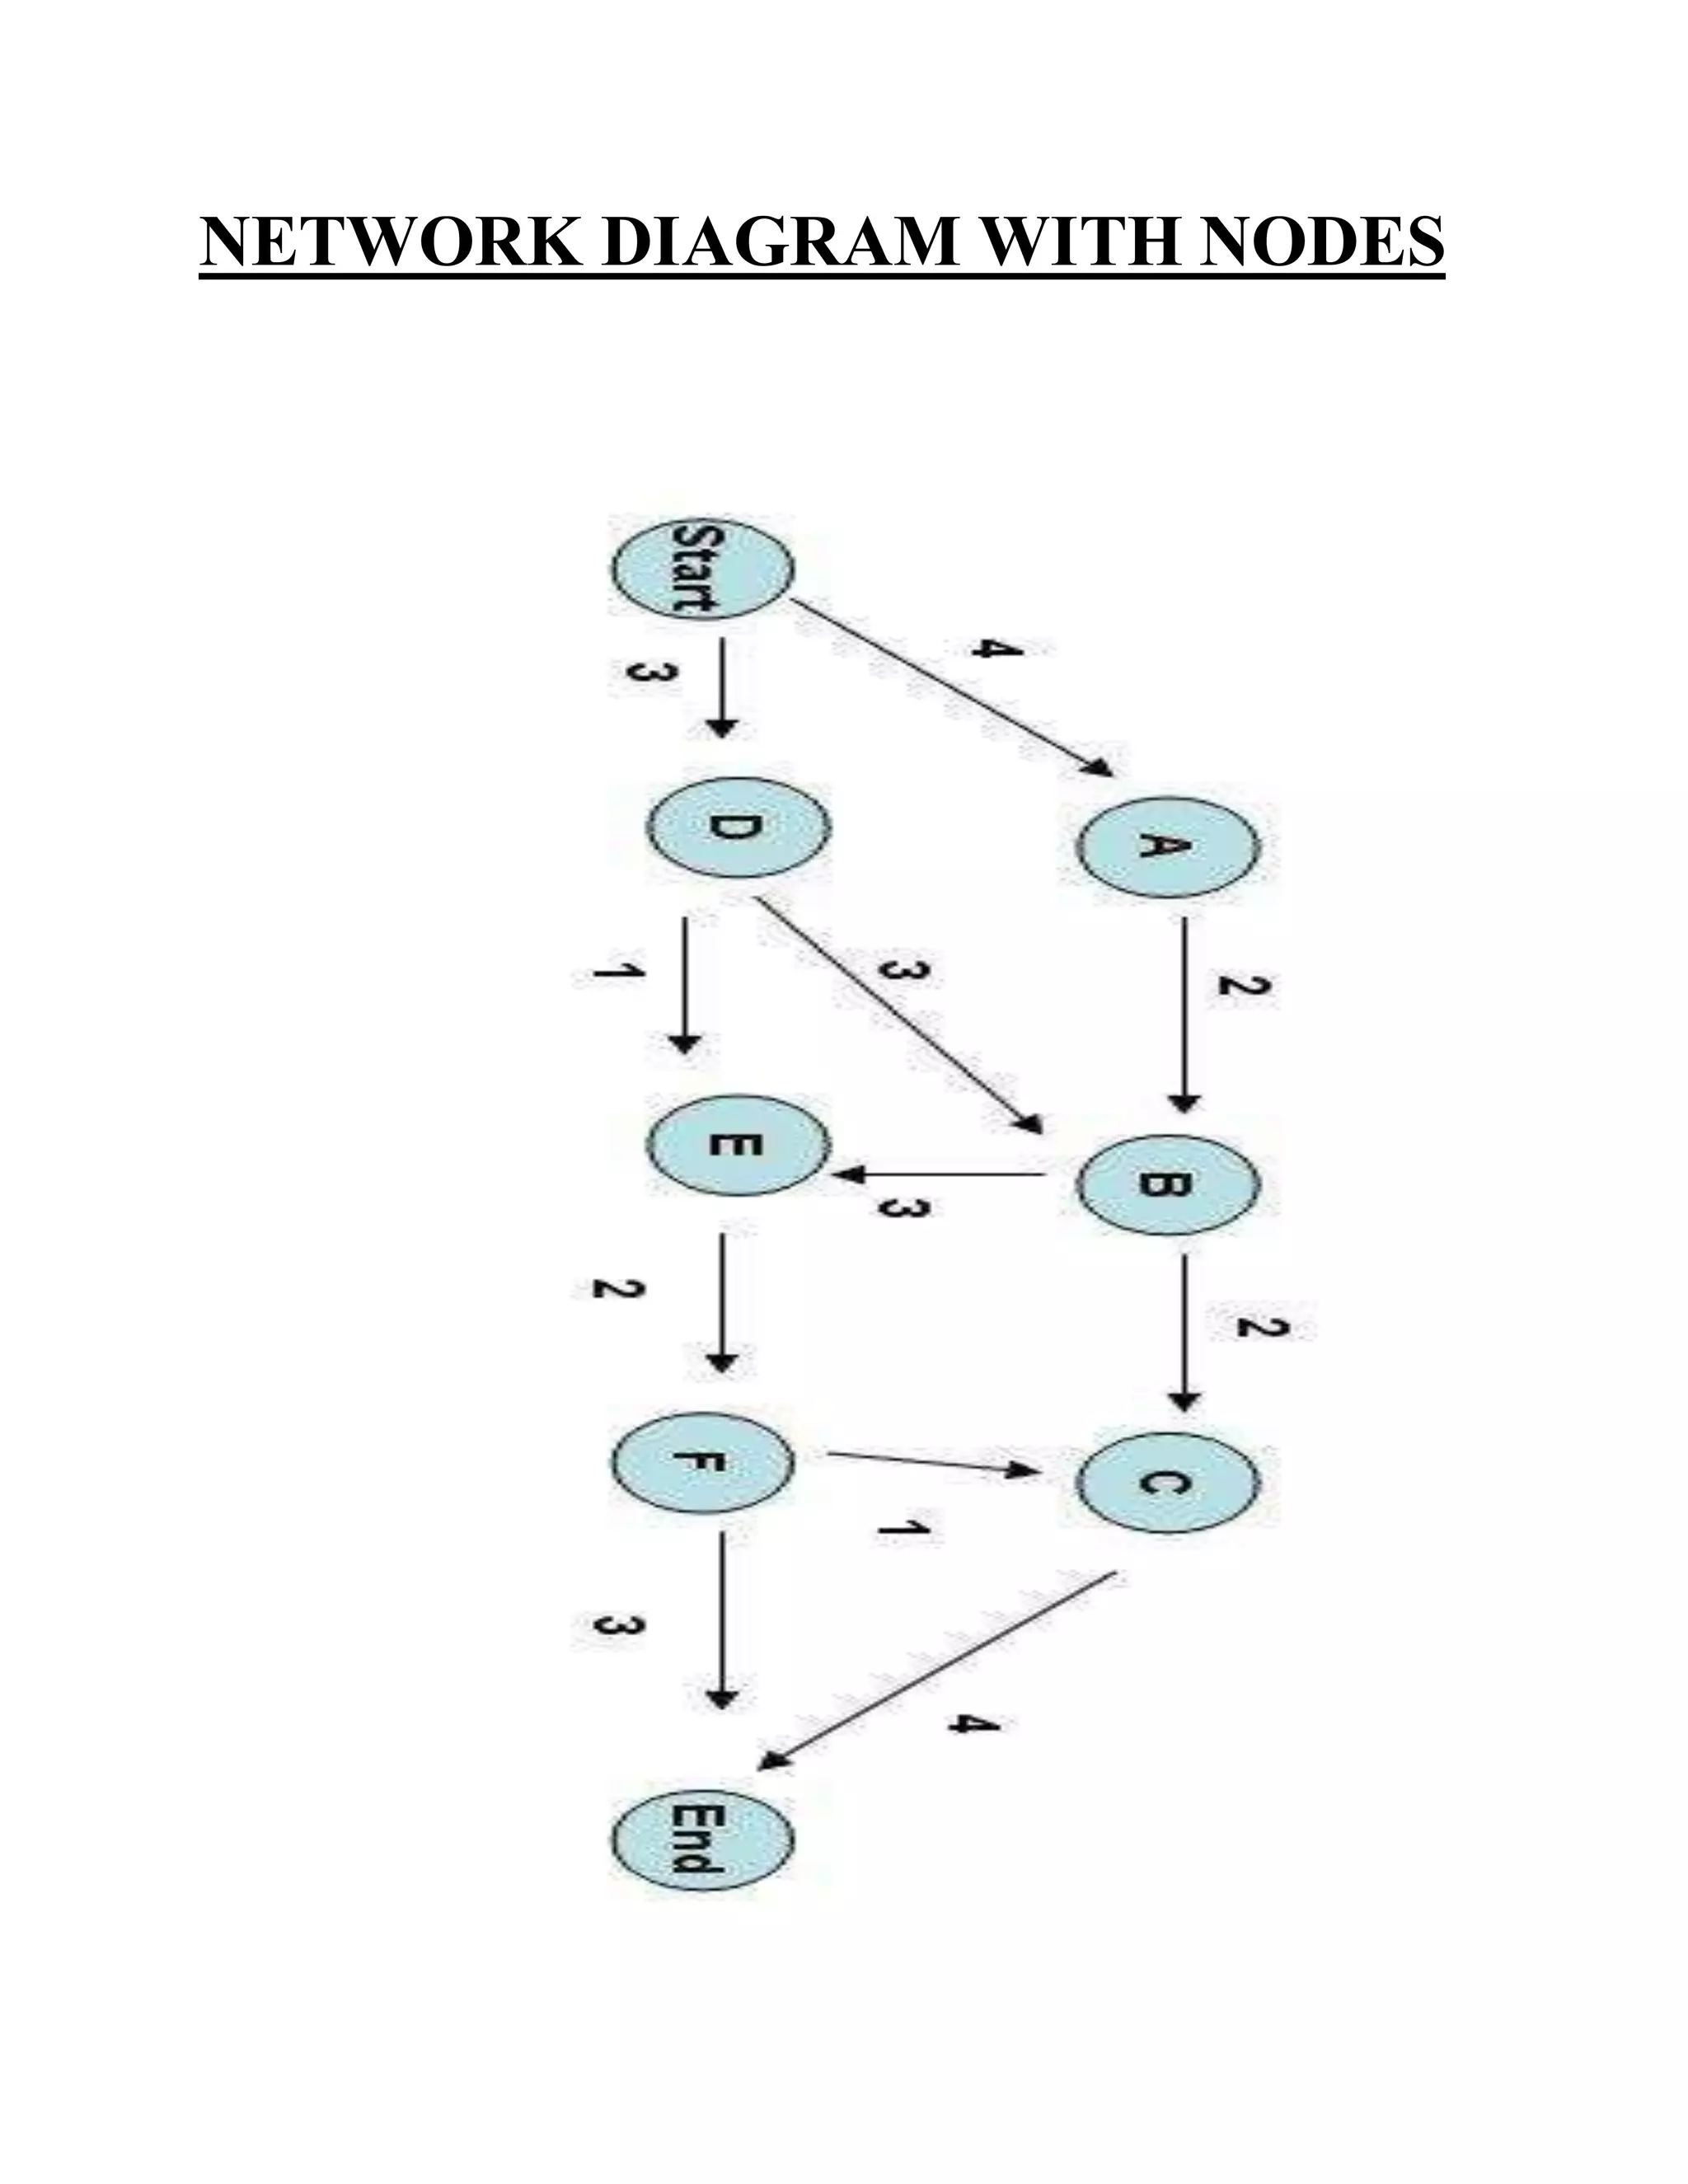
network diagram visually conveys the critical path. This visibility
into the critical path allows project managers to prioritize activities
and take appropriate corrective actions to meet schedule deadlines.
An understanding of the critical path also allows project managers
visibility as to which schedule activities are flexible – that is, those
9.
activities that arenot on the critical path. By looking at a network
diagram, project managers can determine when they have float or
slack, which is the amount of time that any given schedule activity
can be delayed without causing a delay to the start date of subsequent
activities (free float) or to the project completion date (total float).
Knowing when a project has float allows a Project Manager to
understand what tasks may slip and by how much before they have an
impact on the project schedule.
NETWORK DIAGRAMS
Network diagrams are schematic displays of project schedule activities
and the interdependencies between these activities. When developed
properly, this graphical view of a project’s activities conveys critical
schedule characteristics required to effectively analyze and adjust
schedules – thus resulting in accurate and feasible schedules. This
document addresses what should be considered in the development of a
network diagram, how network diagrams are created, and how they may
be analyzed to identify necessary corrective actions and ensure optimal
schedule definition.
NETWORK DIAGRAM CREATION
Network diagrams can be created manually but are also available as
project views in project scheduling tools such as Microsoft Project. (See
Microsoft Project, View→ More Views → Network Diagram).
Inputs:
● Project Scope Statement – The schedule definition required in
network diagram development must be based on the approved scope
documented in the Project Scope Statement. If network diagram and
10.
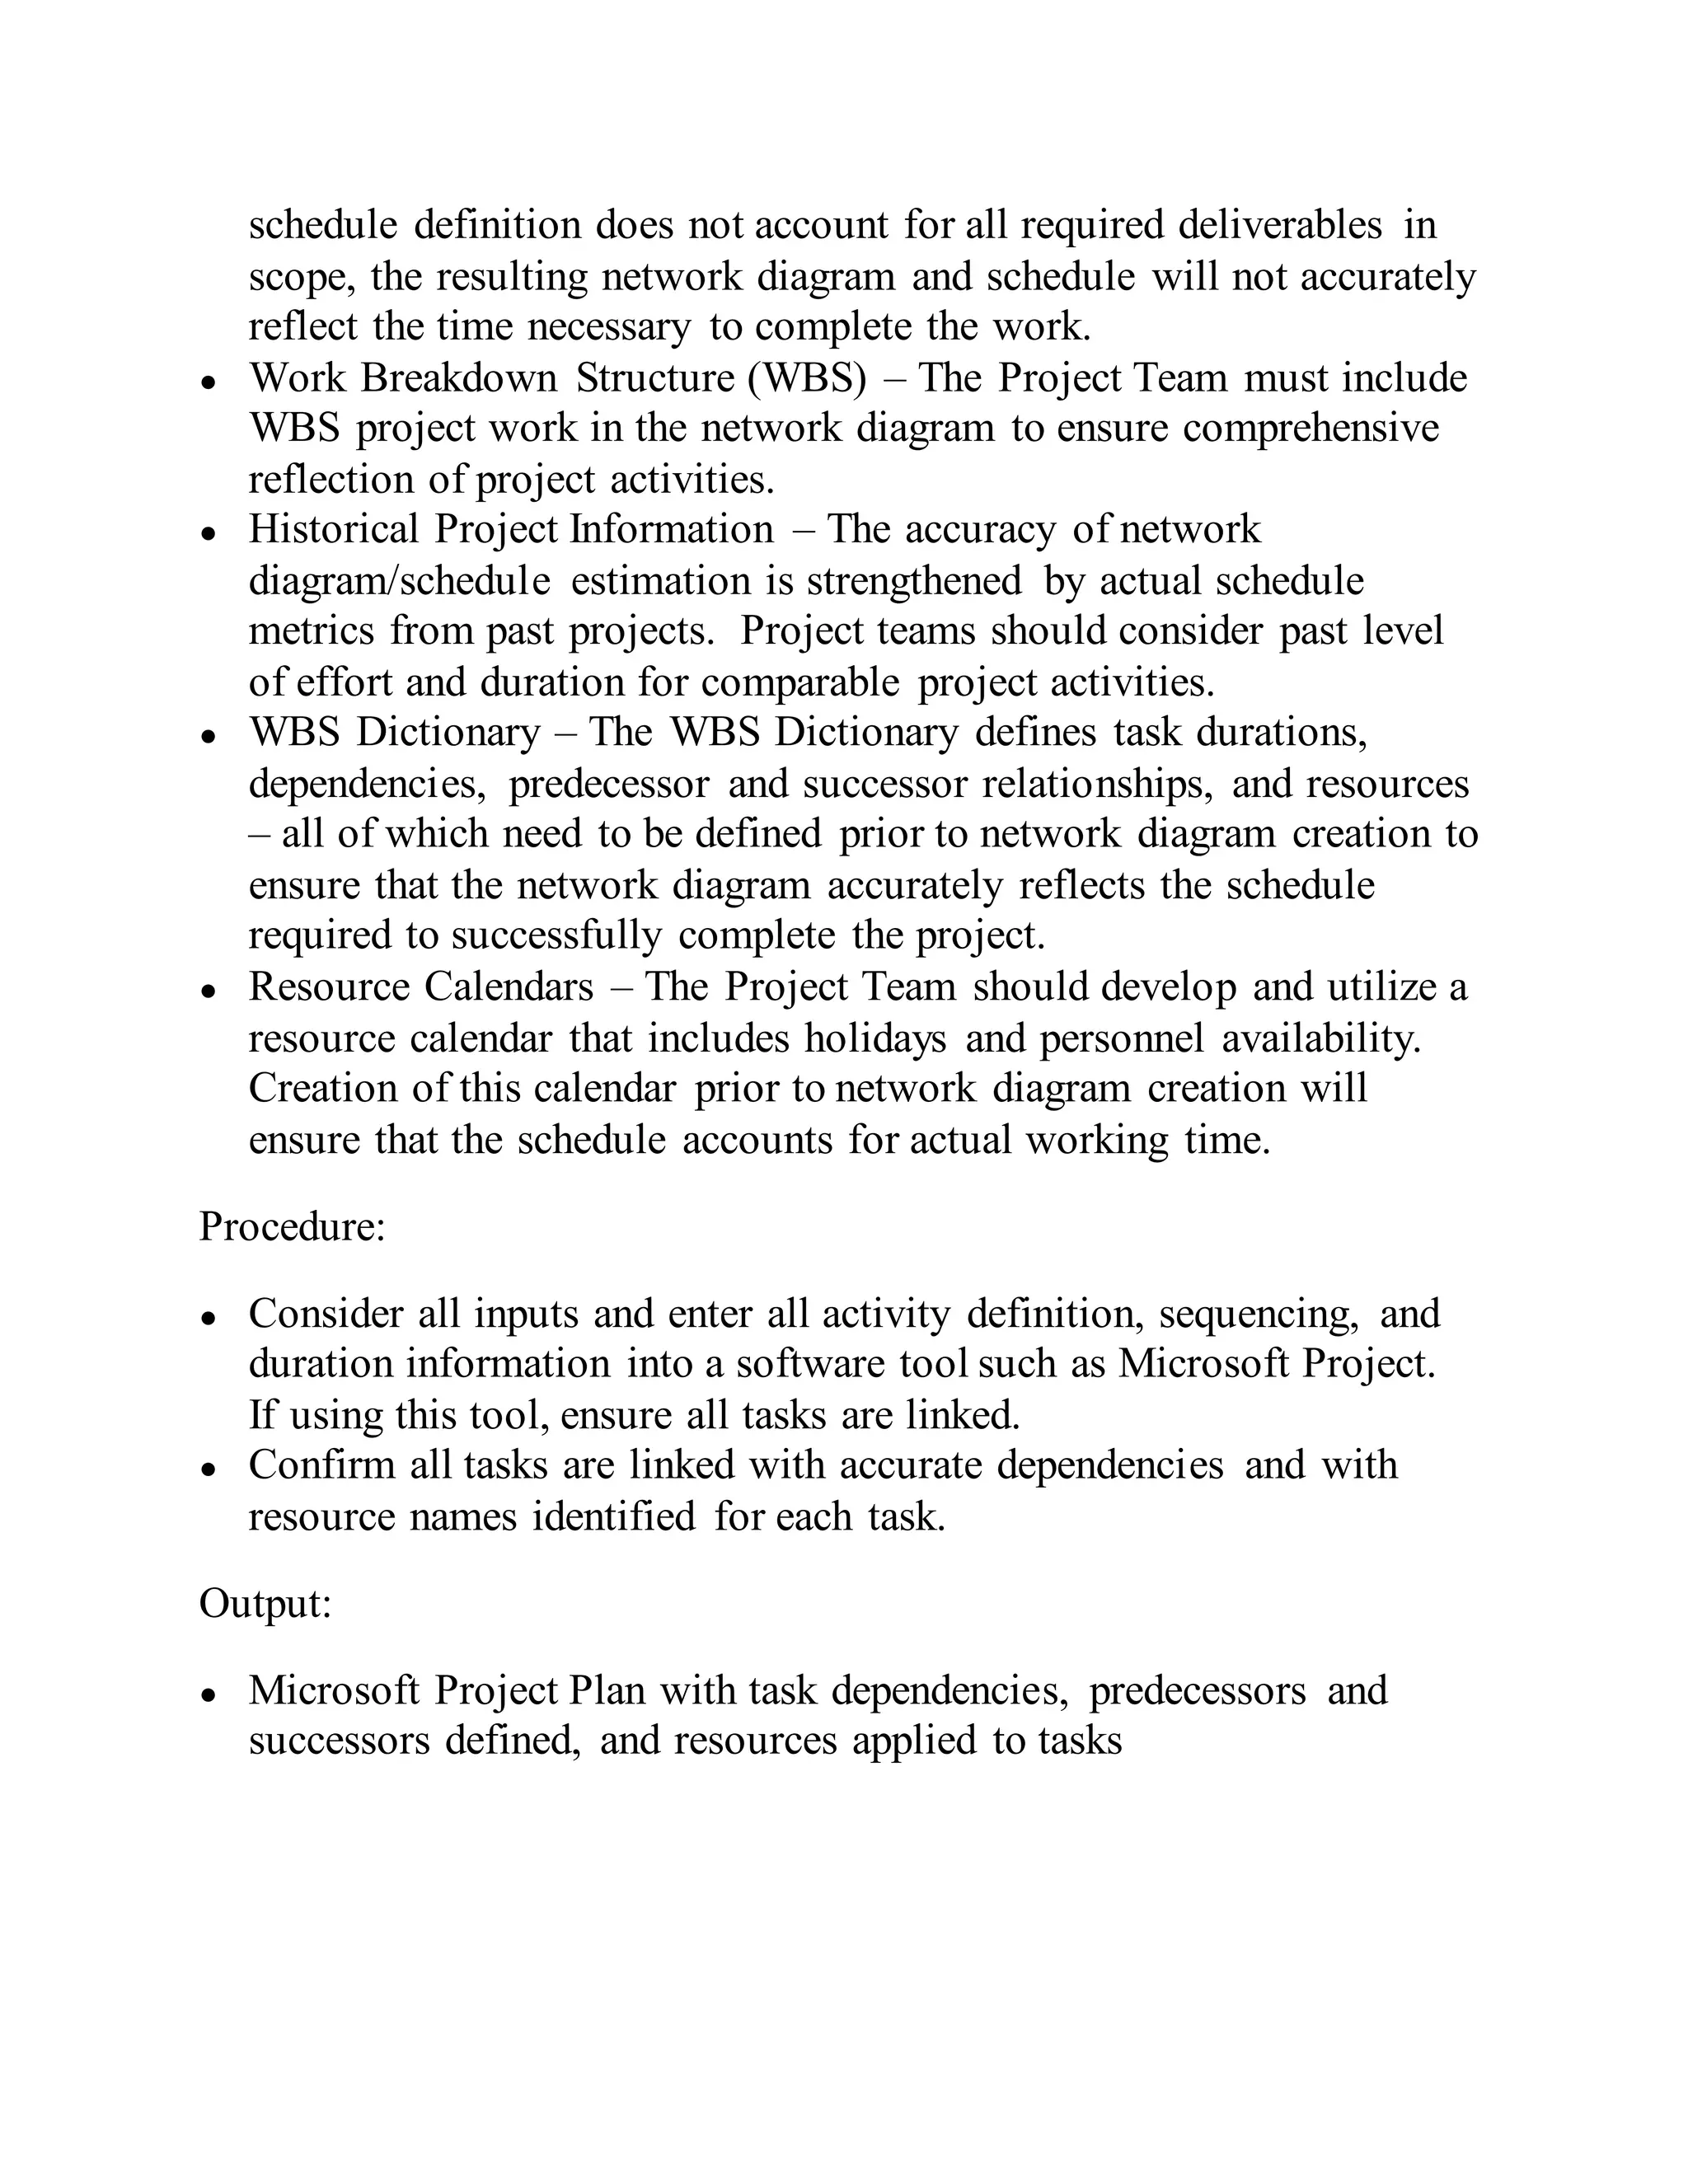
schedule definition doesnot account for all required deliverables in
scope, the resulting network diagram and schedule will not accurately
reflect the time necessary to complete the work.
● Work Breakdown Structure (WBS) – The Project Team must include
WBS project work in the network diagram to ensure comprehensive
reflection of project activities.
● Historical Project Information – The accuracy of network
diagram/schedule estimation is strengthened by actual schedule
metrics from past projects. Project teams should consider past level
of effort and duration for comparable project activities.
● WBS Dictionary – The WBS Dictionary defines task durations,
dependencies, predecessor and successor relationships, and resources
– all of which need to be defined prior to network diagram creation to
ensure that the network diagram accurately reflects the schedule
required to successfully complete the project.
● Resource Calendars – The Project Team should develop and utilize a
resource calendar that includes holidays and personnel availability.
Creation of this calendar prior to network diagram creation will
ensure that the schedule accounts for actual working time.
Procedure:
● Consider all inputs and enter all activity definition, sequencing, and
duration information into a software tool such as Microsoft Project.
If using this tool, ensure all tasks are linked.
● Confirm all tasks are linked with accurate dependencies and with
resource names identified for each task.
Output:
● Microsoft Project Plan with task dependencies, predecessors and
successors defined, and resources applied to tasks