2
Reading and Acknowledgment
●
J.K. Pinto (2016) Project Management - achieving
competitive advantage. 4th
edition, Pearson
– Chapter 9 and 10 on Project Scheduling
3.
3
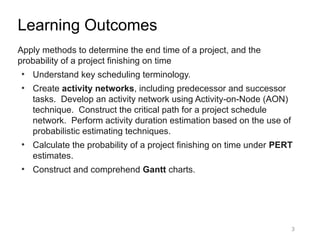
Learning Outcomes
Apply methodsto determine the end time of a project, and the
probability of a project finishing on time
●
Understand key scheduling terminology.
●
Create activity networks, including predecessor and successor
tasks. Develop an activity network using Activity-on-Node (AON)
technique. Construct the critical path for a project schedule
network. Perform activity duration estimation based on the use of
probabilistic estimating techniques.
●
Calculate the probability of a project finishing on time under PERT
estimates.
●
Construct and comprehend Gantt charts.
4.
4
Introduction to ProjectScheduling
● The methodologies in project scheduling build upon each
other.
● Project scheduling requires us to follow some carefully laid-
out steps, in order, for the schedule to take shape.
● Project scheduling techniques lie at the heart of project
planning and subsequent monitoring and control.
● Project scheduling represents the conversion of project
goals into an achievable methodology for their completion; it
creates a timetable and reveals the network logic that
relates project activities to each other in a coherent fashion.
5.
5
Definition of ProjectScheduling
Project Management Body of Knowledge defines project
scheduling as
● “an output of a schedule model that presents linked
activities with planned dates, durations, milestones, and
resources.”
6.
6
Scheduling Problems
• Estimatingthe difficulty of problems and hence the cost of
developing a solution is hard
• Software or hardware to be used for development may be
delivered late.
• Individuals working on a project may fall ill or may leave
• The unexpected always happens. Always allow contingency
in planning
7.
7
Project Scheduling Steps
•Split project into tasks and estimate time to complete each
task.
• Organize tasks concurrently to make optimal use of
workforce.
• Minimize task dependencies to avoid delays caused by one
task waiting for another to complete.
• Dependent on project managers intuition and experience.
8.
8
Milestones
• End-point ofa software process activity
• At each milestone there should be a formal output
• Identify critical points in your schedule.
• Often used at “review” or “delivery” times.
❑Or at end or beginning of phases
❑Eg. Software Requirements Review (SRR), Feasibility
report, Design Report, User Sign-off. Have a duration of
zero
• Shown as inverted triangle or a diamond
12
Objectives of ProjectScheduling
• Scheduling is to find the project duration taking into
consideration the task duration and interdependencies.
• Primary objectives of scheduling
▪Critical path (network diagram)
▪Minimum duration that the project will take
• Secondary objectives
▪Evaluation of schedule alternatives
▪Effective use of resources
13.
13
Network Diagrams
• Developedin the 1950’s
• A graphical representation of the tasks necessary to
complete a project
• Visualizes the flow of tasks & relationships
• Used to calculate the earliest start, earliest finish, latest
start and latest finish.
• To find the critical path and the slack time
14.
14
Terminology used inNetwork Diagram
● Path—A sequence of activities defined by the project network
logic.
● Event—A point when an activity is either started or completed.
Often used in conjunction with AOA networks, events consume no
resources and have no time to completion associated with them.
● Node—One of the defining points of a network; a junction point
joined to some or all of the others by dependency lines (paths).
● Predecessors—Those activities that must be completed prior to
initiation of a later activity in the network.
● Successors—Activities that cannot be started until previous
activities have been completed. These activities follow
predecessor tasks.
15.
15
Terminology (contd)
● Earlystart (es) date—The earliest possible date on which the
uncompleted portions of an activity (or the project) can start,
based on the network logic and any schedule constraints. Early
start dates can change as the project progresses and changes
are made to the project plan.
● Late start (ls) date—The latest possible date that an activity may
begin without delaying a specified milestone (usually the project
finish date).
● Forward pass—Network calculations that determine the earliest
start/earliest finish time (date) for each activity. The earliest start
and finish dates are determined by working forward through each
activity in the network.
● Backward pass—Calculation of late finish times (dates) for all
uncompleted network activities. The latest finish dates are
determined by working backward through each activity.
16.
16
Terminology (contd)
● Mergeactivity—An activity with two or more immediate
predecessors (tasks flowing into it). Merge activities can be
located by doing a forward pass through the network.
● Burst activity—An activity with two or more immediate successor
activities (tasks flowing out from it). Burst activities can be located
by doing a backward pass through the network.
● Slack / float—The amount of time an activity may be delayed from
its early start without delaying the finish of the project. Float is a
mathematical calculation and can change as the project
progresses and changes are made in the project plan.
– In general, float is the difference between the late start date
and the early start date (LS − ES) or between the late finish
date and early finish date (LF − EF).
17.
17
Terminology (contd)
● Criticalpath—The path through the project network with the
longest duration. The critical path may change from time to time
as activities are completed ahead of or behind schedule. Critical
path activities are identified as having zero float in the project.
● Critical Path Method (CPM)—A network analysis technique used
to determine the amount of scheduling flexibility (the amount of
float) on various logical network paths in the project schedule
network, and to determine the minimum total project duration. It
involves the calculation of early (forward scheduling) and late
(backward scheduling) start and finish dates for each activity.
18.
18
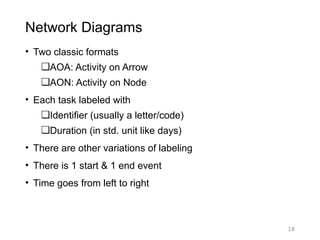
Network Diagrams
• Twoclassic formats
❑AOA: Activity on Arrow
❑AON: Activity on Node
• Each task labeled with
❑Identifier (usually a letter/code)
❑Duration (in std. unit like days)
• There are other variations of labeling
• There is 1 start & 1 end event
• Time goes from left to right
21
Network Diagram Formats
•AOA consists of
• Circles representing Events
• Such as ‘start’ or ‘end’ of a given task
• Lines representing Tasks
• Thing being done ‘Build UI’
• a.k.a. Arrow Diagramming Method (ADM)
• AON
• Tasks on Nodes
• Nodes can be circles or rectangles (usually latter)
• Task information written on node
• Arrows are dependencies between tasks
• a.k.a. Precedence Diagramming Method (PDM)
22.
22
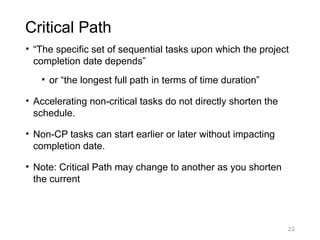
Critical Path
• “Thespecific set of sequential tasks upon which the project
completion date depends”
• or “the longest full path in terms of time duration”
• Accelerating non-critical tasks do not directly shorten the
schedule.
• Non-CP tasks can start earlier or later without impacting
completion date.
• Note: Critical Path may change to another as you shorten
the current
25
Forward Pass
• Todetermine early start (ES) and early finish (EF)
times for each task
• Work from left to right
• Adding times in each path
• Rule: when several tasks converge, the ES for the next
task is the largest of preceding EF times
• •16
27
Backward Pass
• Todetermine the last finish (LF) and last start (LS)
times
• Start at the end node
• Compute the bottom pair of numbers
• Subtract duration from connecting node’s earliest start
time
• When two or more activities are converging to one
activity x, we take the minimum of these latest start
times converging activities as the latest finish for the
activity x.
30
Calculating slack time
•Slack Time = LFT - EFT
• EFT = earliest time an event can take place
• LFT = latest date it can occur w/o extending project’s
completion date
32
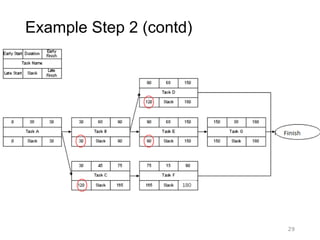
Example Step 4– Critical Path
180
0
0
30
90
90
0
0
Critical path is A → B → E → G
The path through the project network with the
longest duration. Critical path activities are
identified as having zero slack/float in the project.
33.
33
Network Diagrams
• Advantages
•Show precedence well
• Reveal interdependencies not shown in other
techniques
• Ability to calculate critical path
• Ability to perform “what if” exercises
• Disadvantages
• Default model assumes resources are unlimited
• Difficult to follow on large projects
34.
34
PERT
• Program Evaluationand Review Technique
• Based on idea that estimates are uncertain
• Therefore uses duration ranges
• And the probability of falling to a given range
• Use the following formula to calculate the expected
durations
36
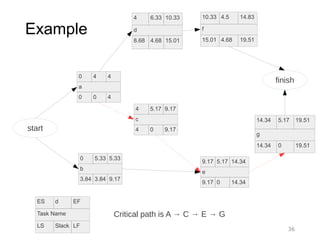
Example
10.33 4.5 14.83
f
15.014.68 19.51
4 6.33 10.33
d
8.68 4.68 15.01
0 4 4
a
0 0 4
0 5.33 5.33
b
3.84 3.84 9.17
4 5.17 9.17
c
4 0 9.17
9.17 5.17 14.34
e
9.17 0 14.34
14.34 5.17 19.51
g
14.34 0 19.51
ES d EF
Task Name
LS Slack LF
start
finish
Critical path is A → C → E → G
37.
37
PERT
• Advantages
• Accountsfor uncertainty
• Disadvantages
• Time and labor intensive
• Lack of functional ownership of estimates
• Mostly only used on large, complex project
• •27
38.
38
Gantt Chart
● Linksproject activities to a project schedule baseline.
● Can also be used to assess the difference between planned
and actual performance.
● Benefits (Slide 40-42)
– they are very easy to read and comprehend
– they identify the project network coupled with its
schedule baseline
– they allow for updating and project control
– they are useful for identifying resource needs and
assigning resources to tasks
– they are easy to create
39.
39
Example of aGantt Chart
● Activities are ordered from first to last along a column on the
left side of the chart with their ES and EF durations drawn
horizontally.
40.
40
Benefits of GanttChart (1/2)
● Comprehension
– Viewers can quickly identify the current date and see
what activities should have been completed, which
should be in progress, and which are scheduled for the
future
● Schedule baseline network
– Linked to real-time information, so that all project
activities have more than just ES, EF, LS, LF, and float
attached to them.
– Have the dates when they are expected to be started
and completed, just as they can be laid out in
conjunction with the overall project schedule.
41.
41
Benefits of GanttChart (2/2)
● Updating and control
– Allow project teams to readily access project information
activity by activity
– Easy to update the status of ongoing activities
– Allow managers to assess current activity status, making
it possible to begin planning for remedial steps in cases
where an activity’s completion is lagging behind
expectations
● Identifying resource needs
– Laying the whole project out on a schedule baseline
permits the project team to begin scheduling resources
well before they are needed, and resource planning
becomes easier.
42.
42
Disadvantages of GanttChart
• Does not show interdependencies well
• Does not show uncertainty of a given activity (as does
PERT)
43.
43
Reducing Project Duration
Howcan we shorten the schedule?
• Looks at cost and schedule tradeoffs
• Add resources to critical path tasks
• Limit or reduce requirements (scope)
• Changing the sequence of tasks
• Overlapping of phases, activities or tasks that would otherwise
be sequential
44.
44
Resource allocation
• Aresource is any item or person required for the execution
of a project. This covers many things from paper to key
personnel.
• Projects compete for resources as a normally a software
company will develop many software projects in parallel.
• Individual programmers might be committed to working on a
number of projects and it is important to book their time well
in advance
45.
45
Staff allocation (1/2)
Allocatinghuman resources is very subjective and depends
mainly on their availability, but the following proves useful:
• Assign concurrent task to different staff
• Assign dependent tasks to the same staff
• Assign tasks to individuals whose skills level suits the task.
Do not assign an expert an insignificant task, nor assign a
very complex task to a junior person
• Assign similar tasks to the same person. This will reduce
learning time
46.
46
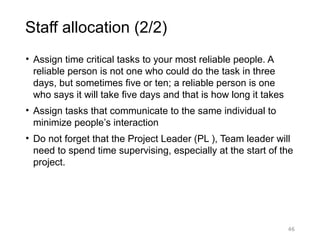
Staff allocation (2/2)
•Assign time critical tasks to your most reliable people. A
reliable person is not one who could do the task in three
days, but sometimes five or ten; a reliable person is one
who says it will take five days and that is how long it takes
• Assign tasks that communicate to the same individual to
minimize people’s interaction
• Do not forget that the Project Leader (PL ), Team leader will
need to spend time supervising, especially at the start of the
project.
47.
47
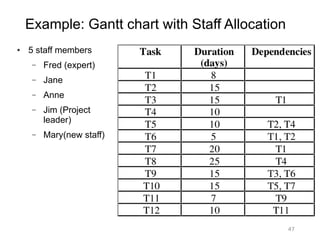
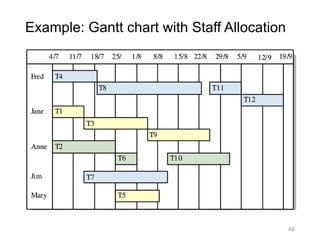
Example: Gantt chartwith Staff Allocation
● 5 staff members
– Fred (expert)
– Jane
– Anne
– Jim (Project
leader)
– Mary(new staff)