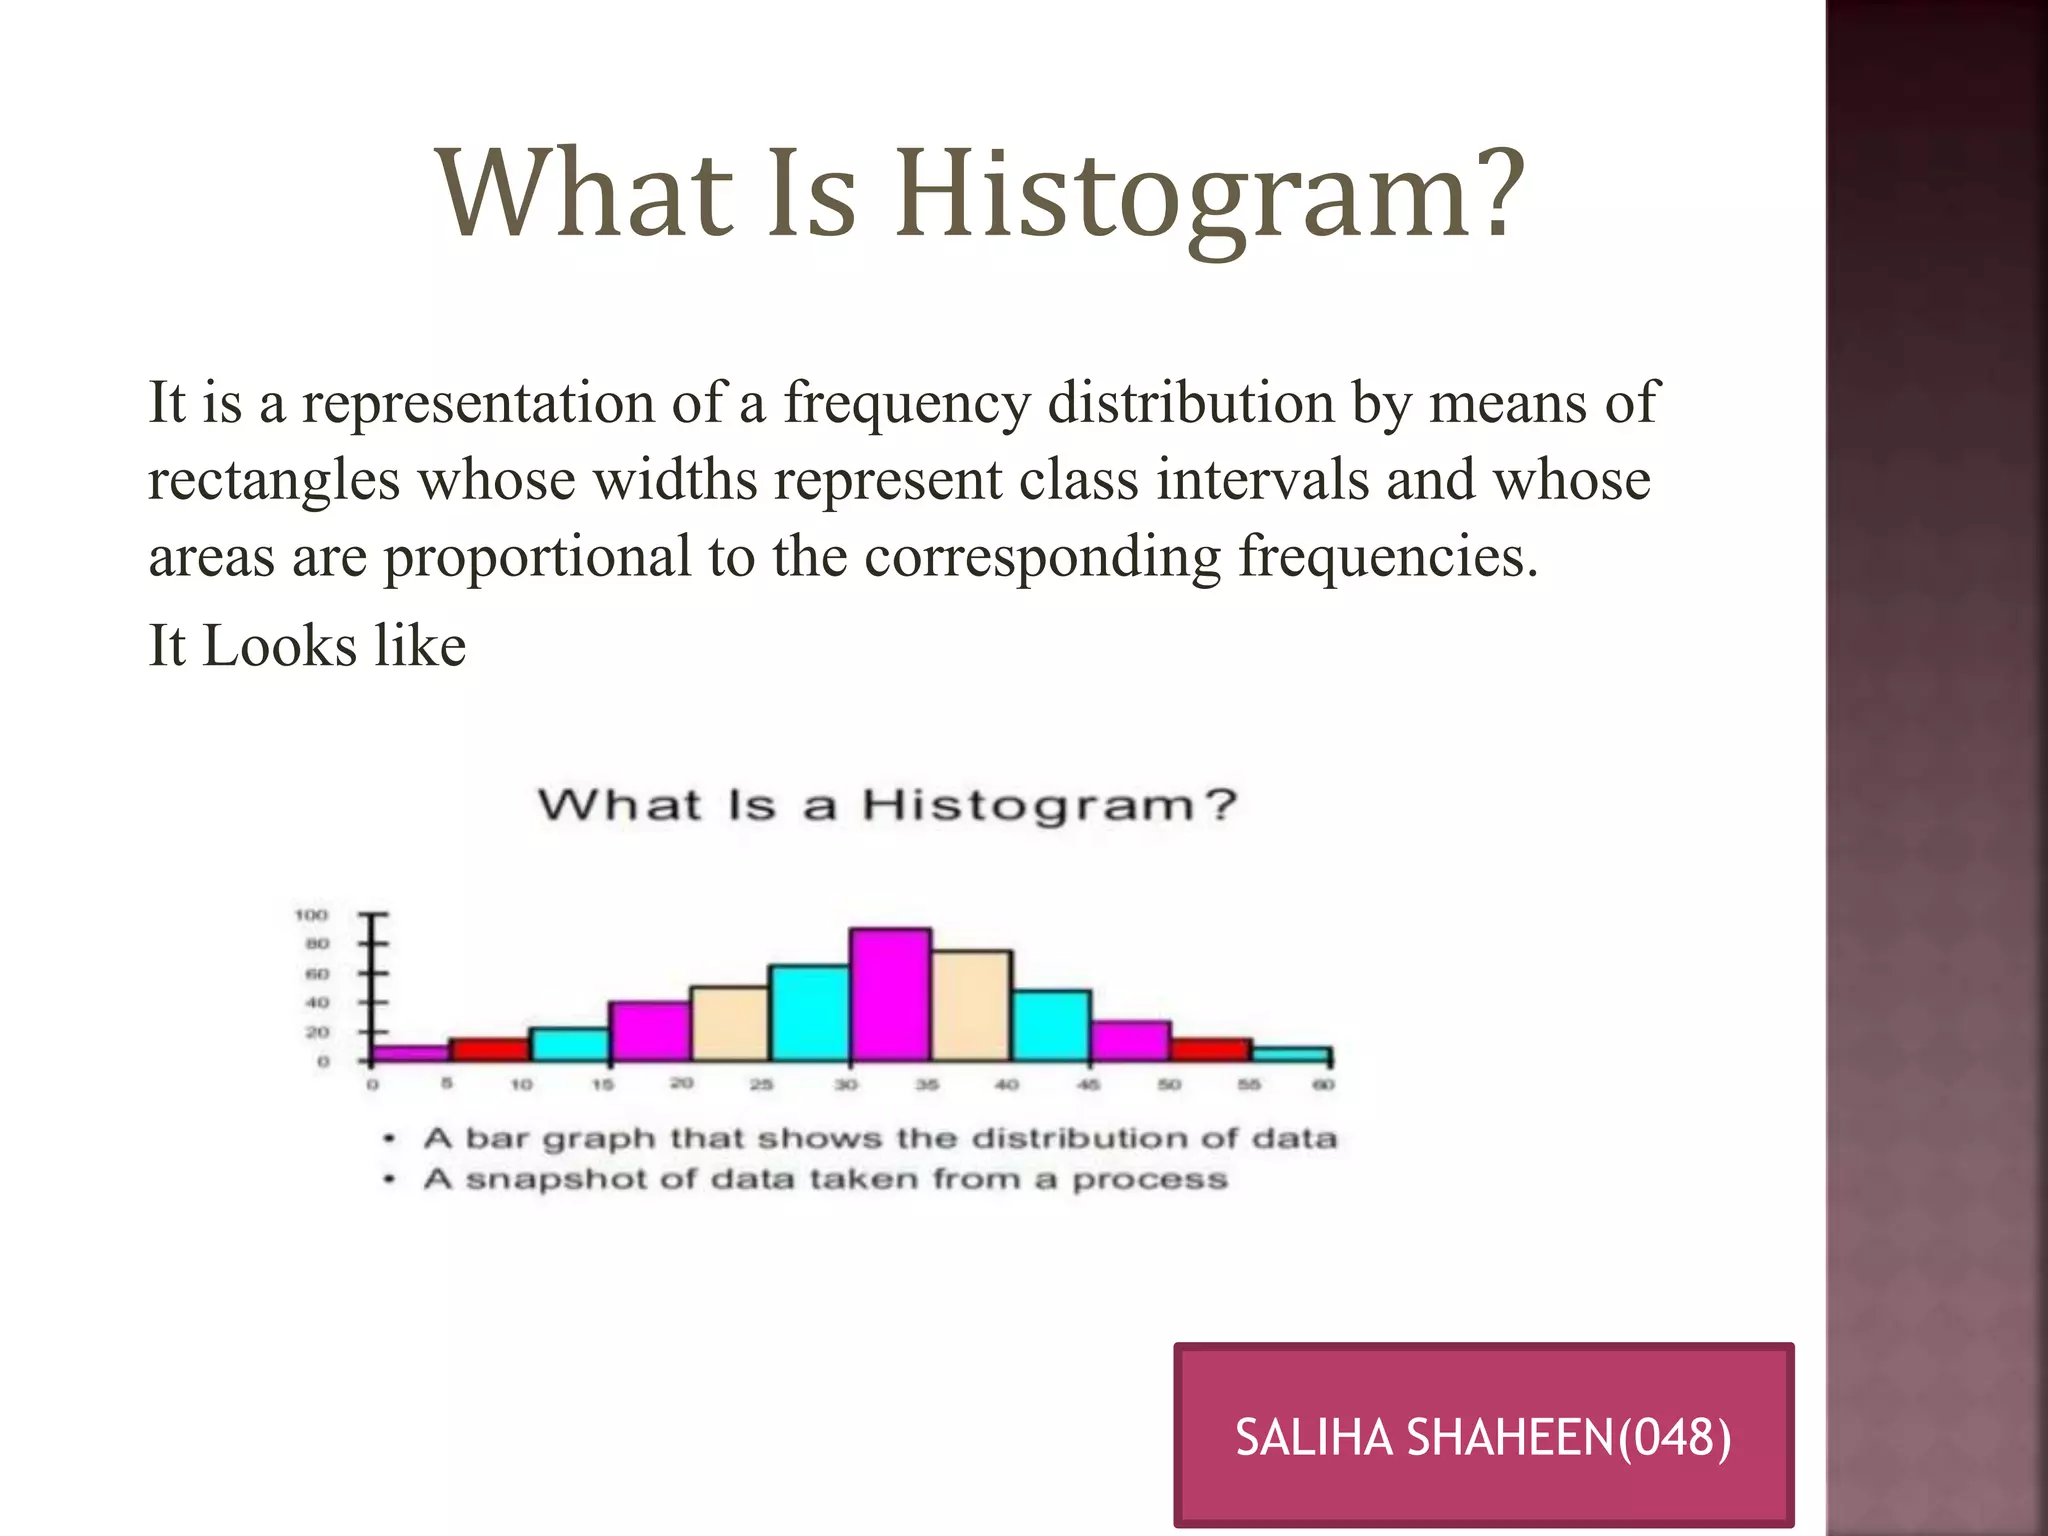
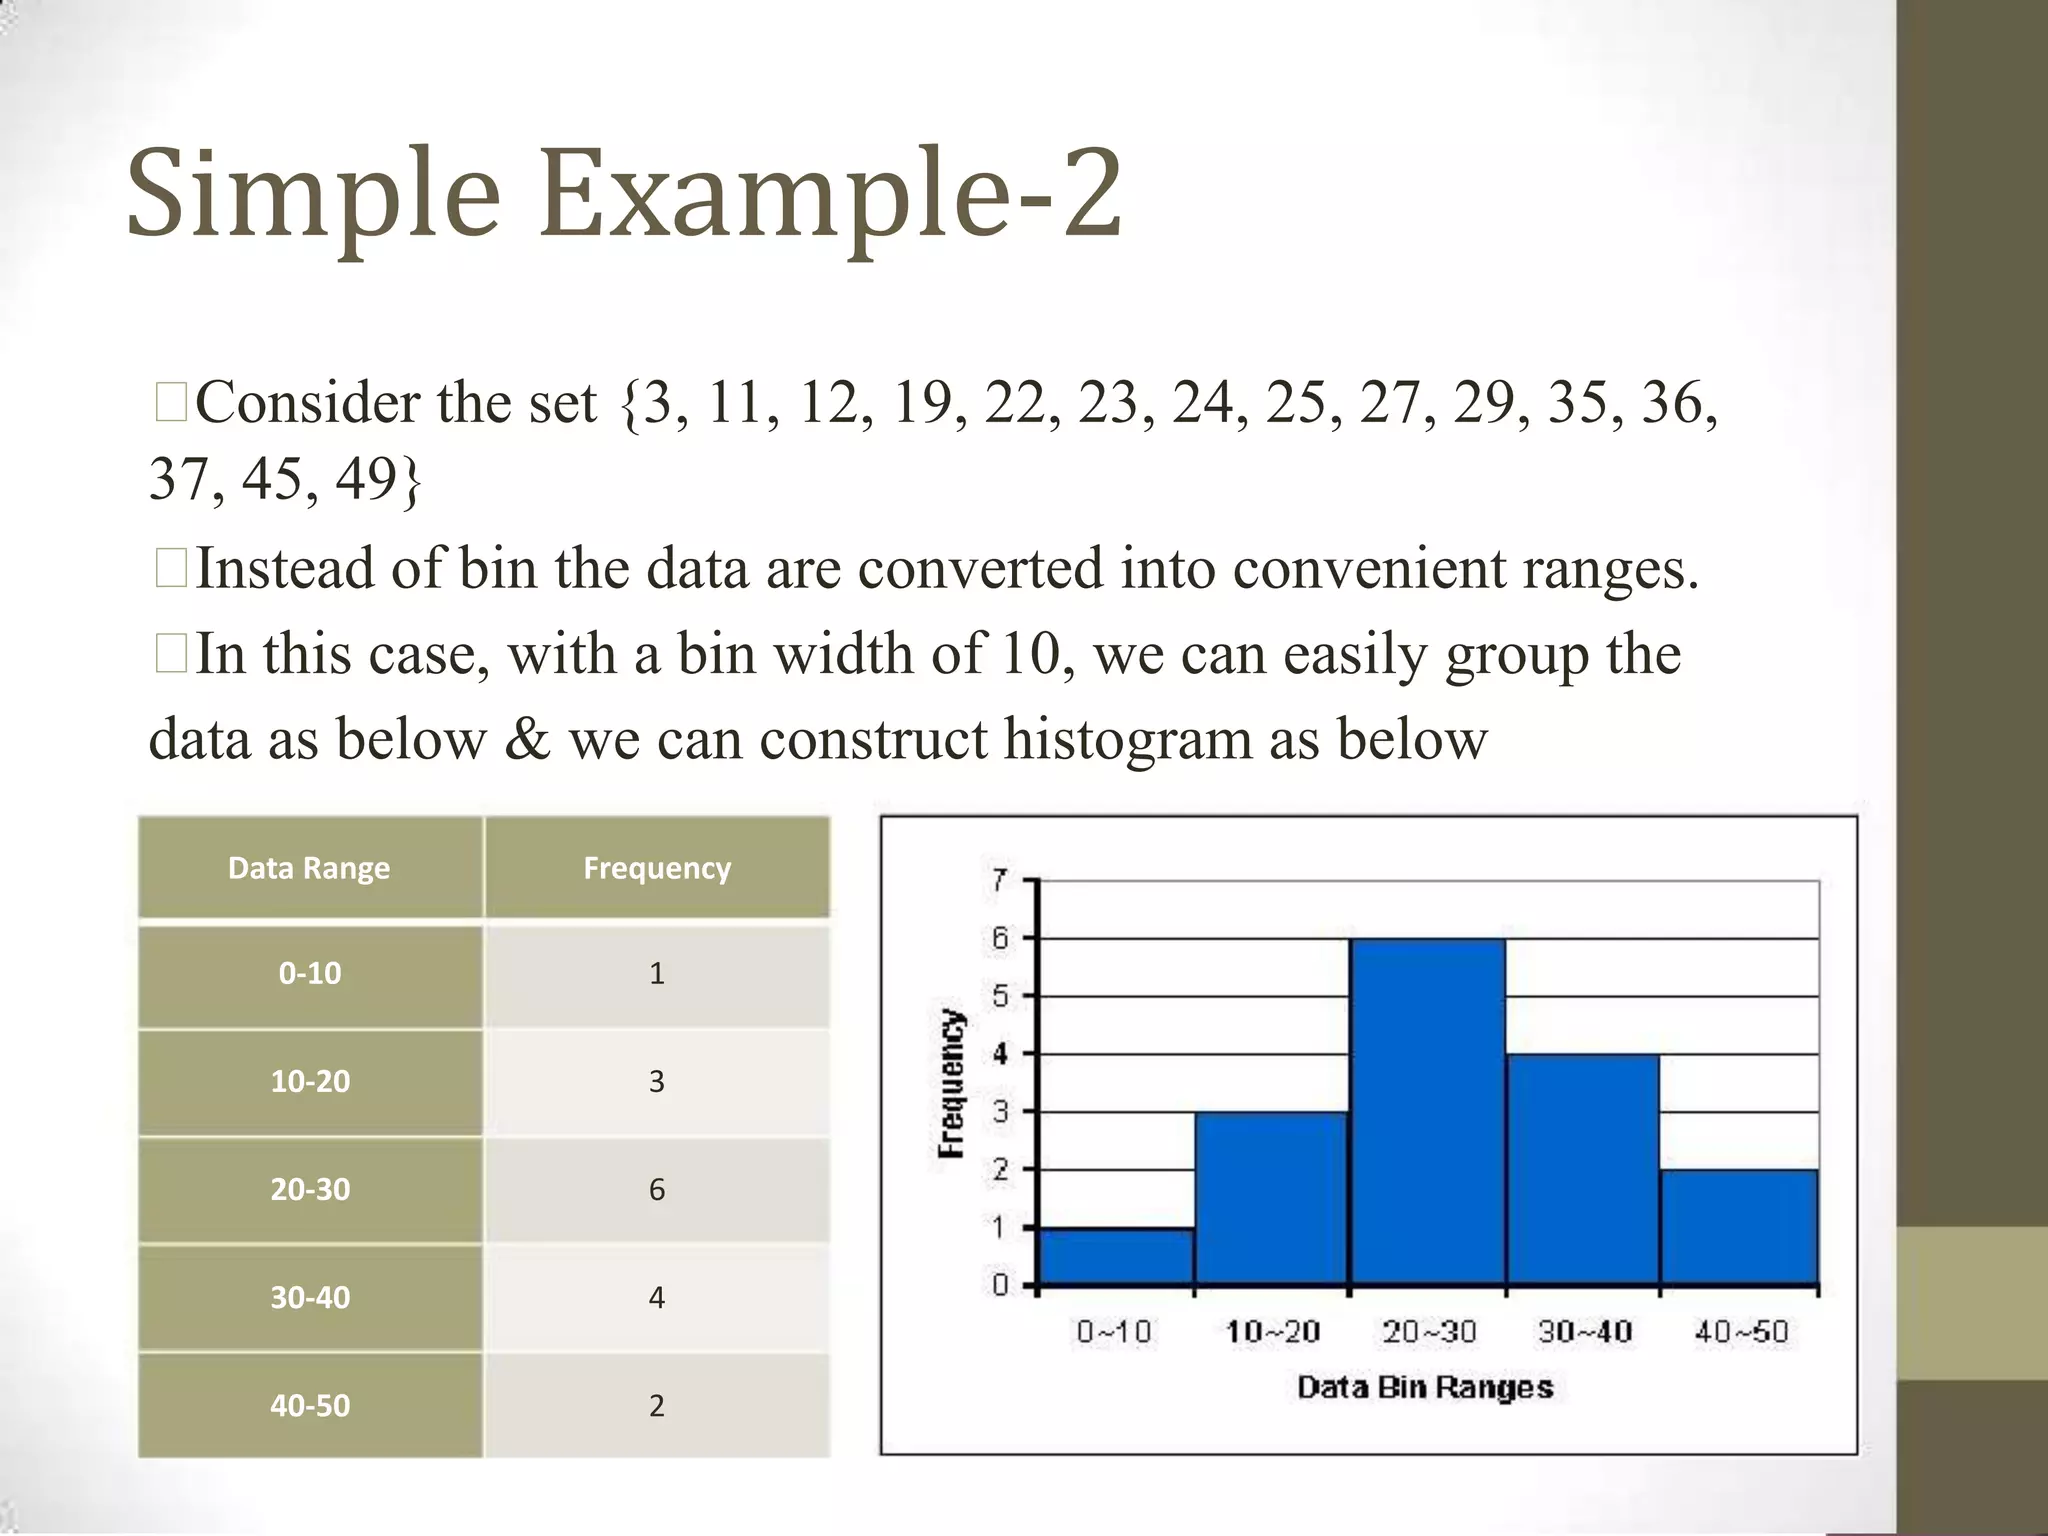
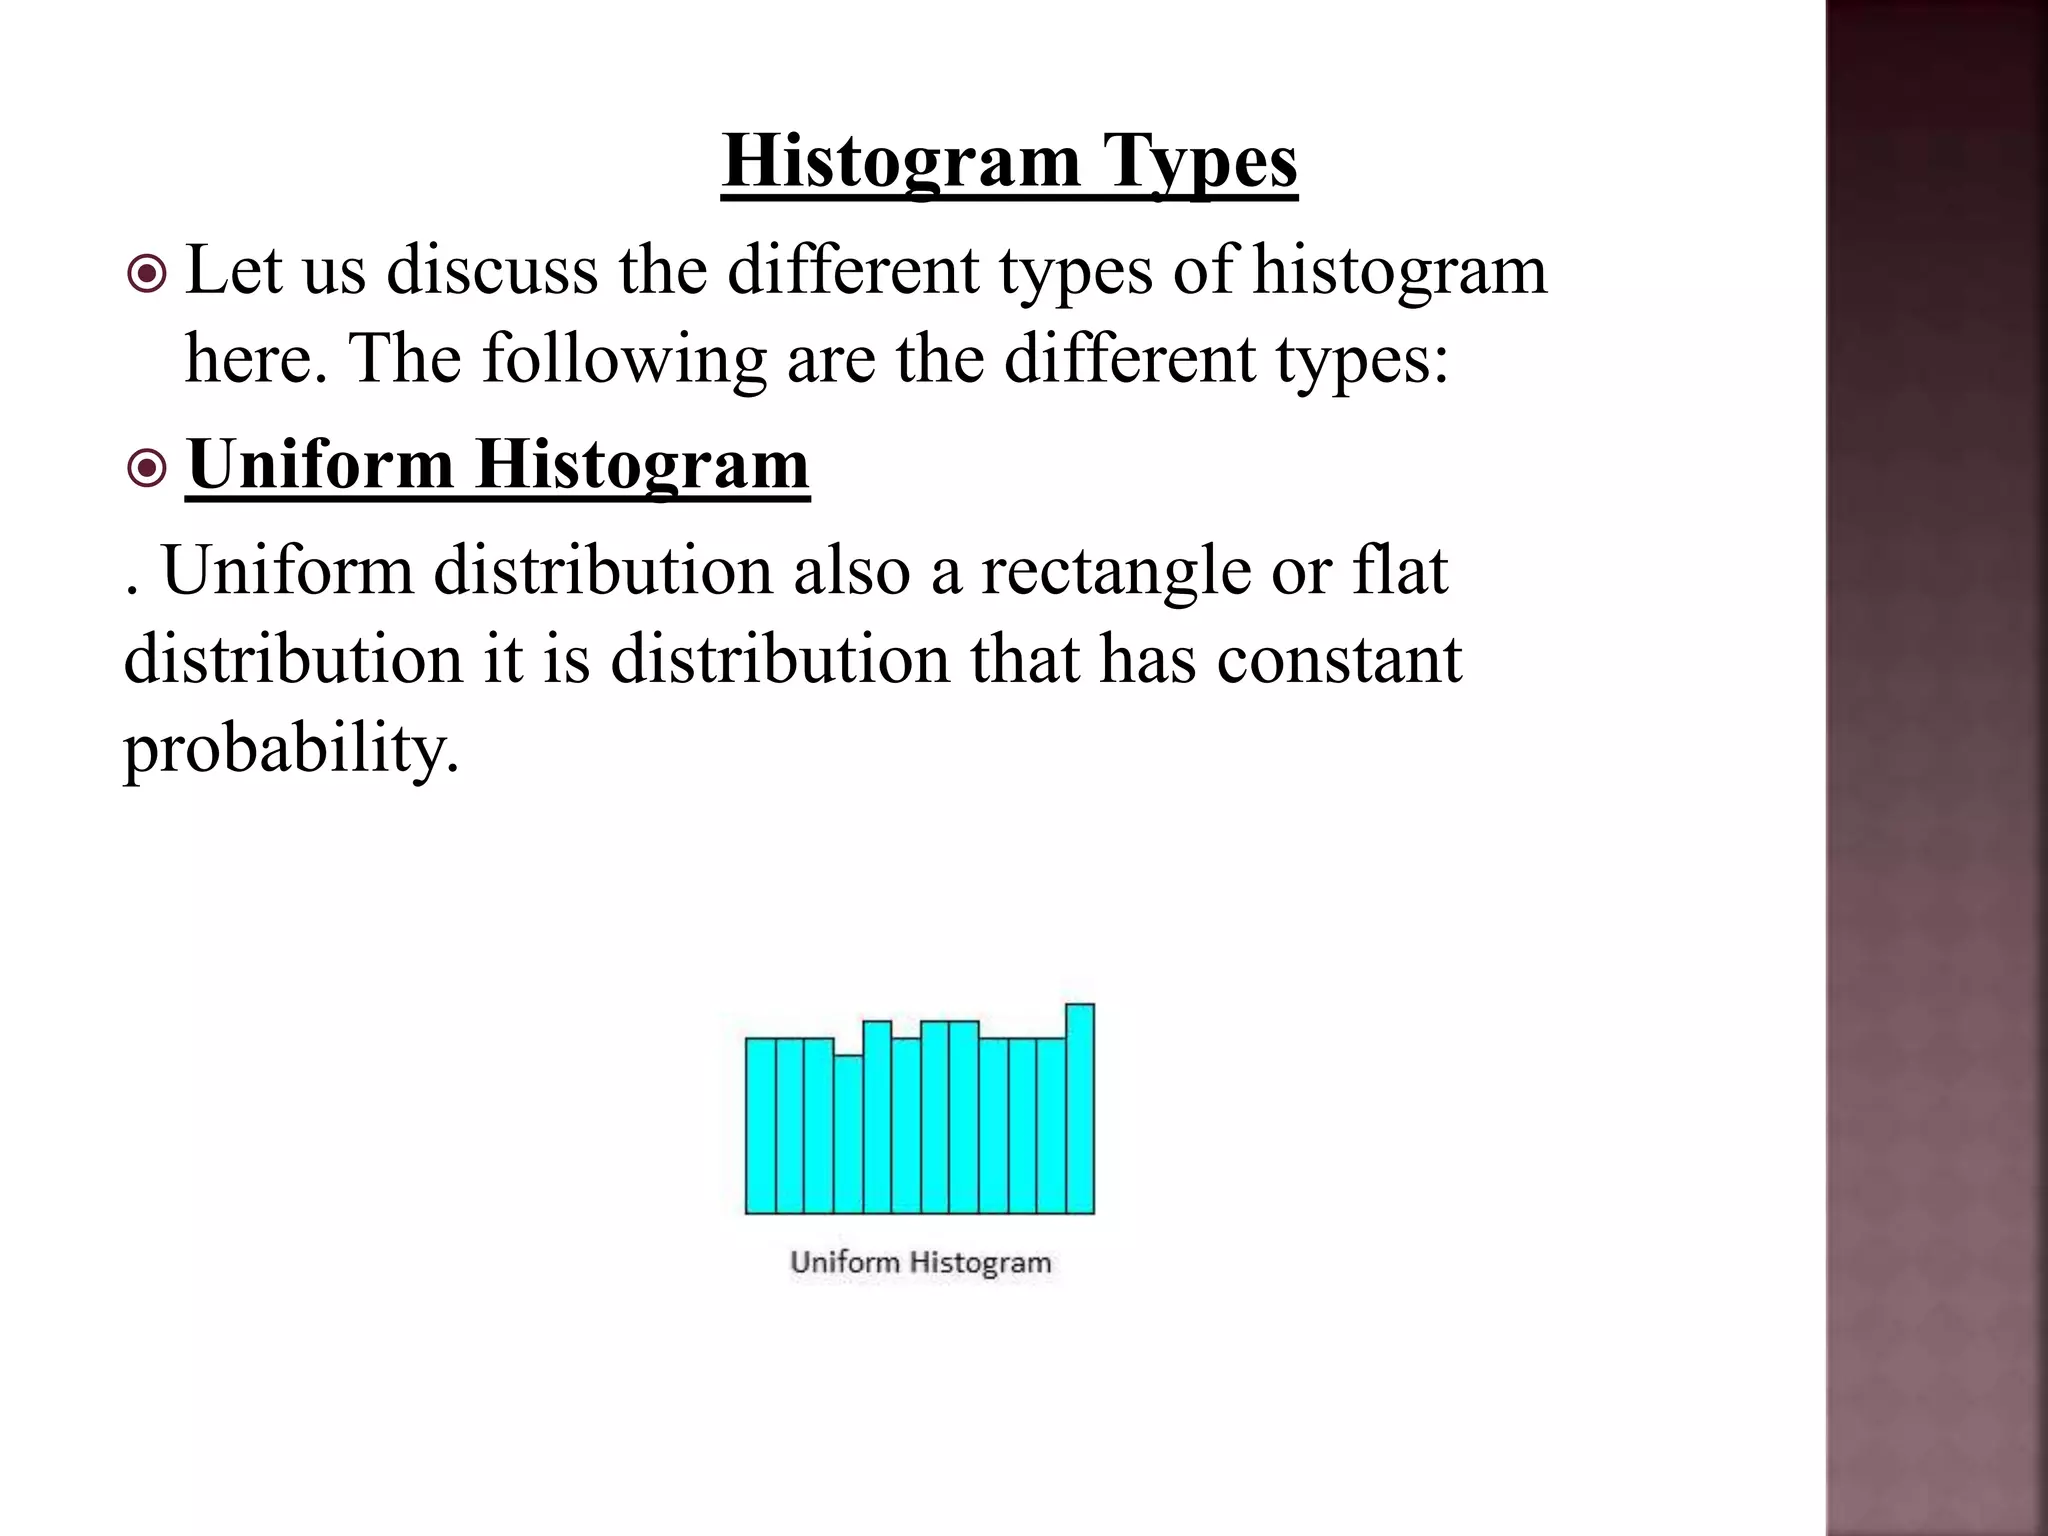
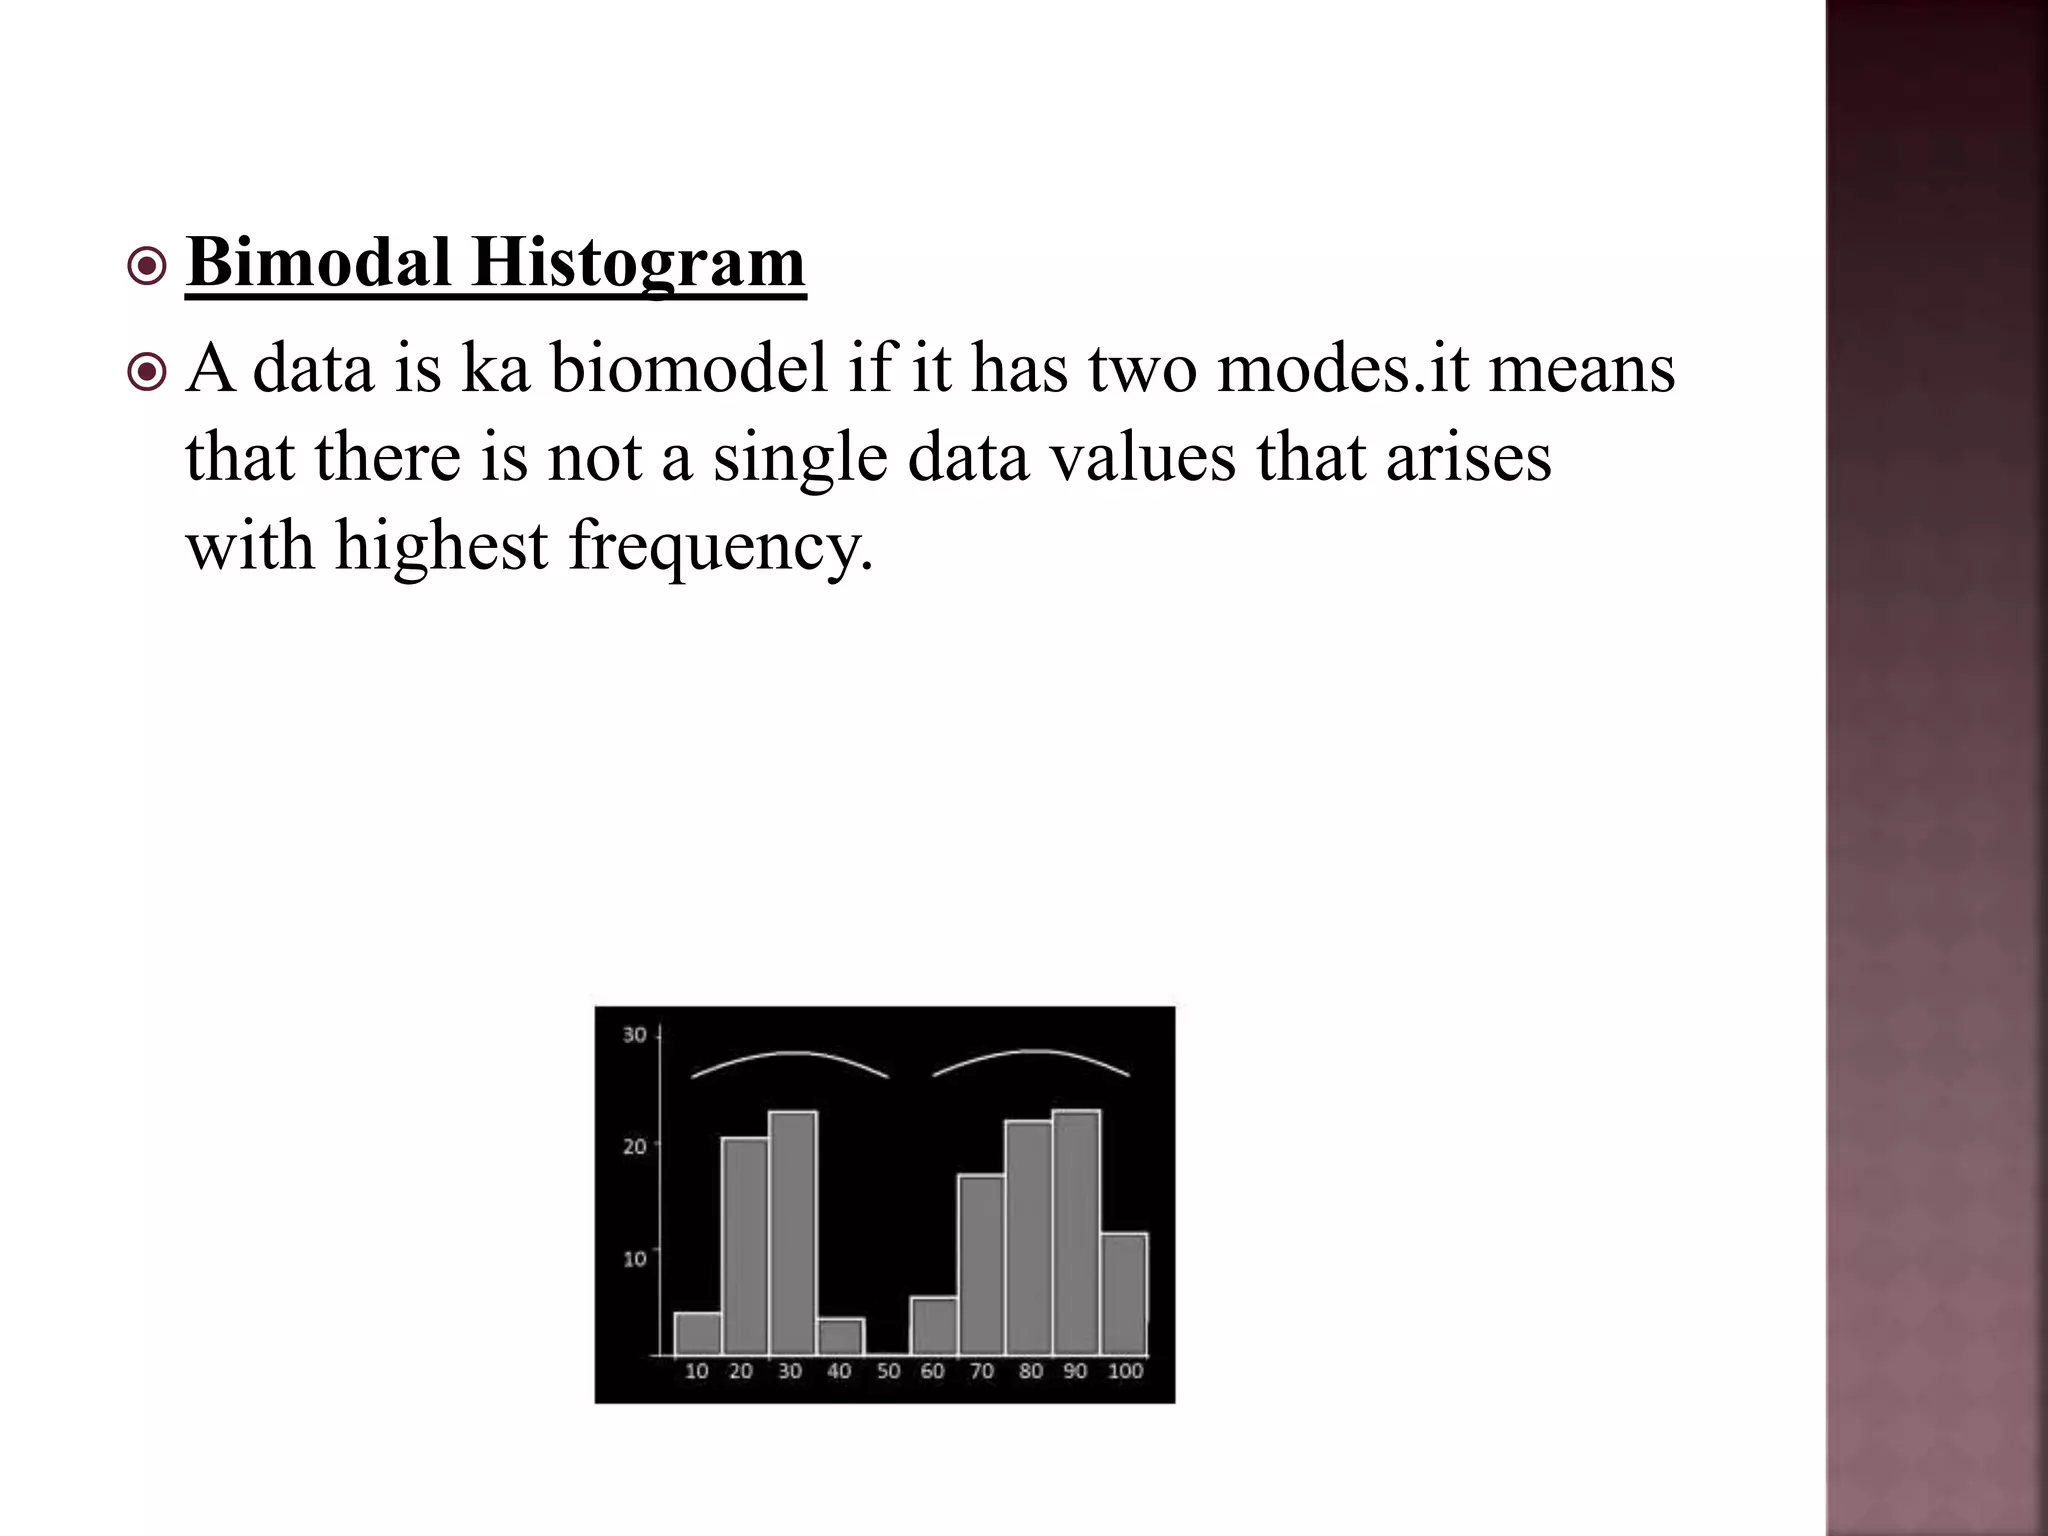
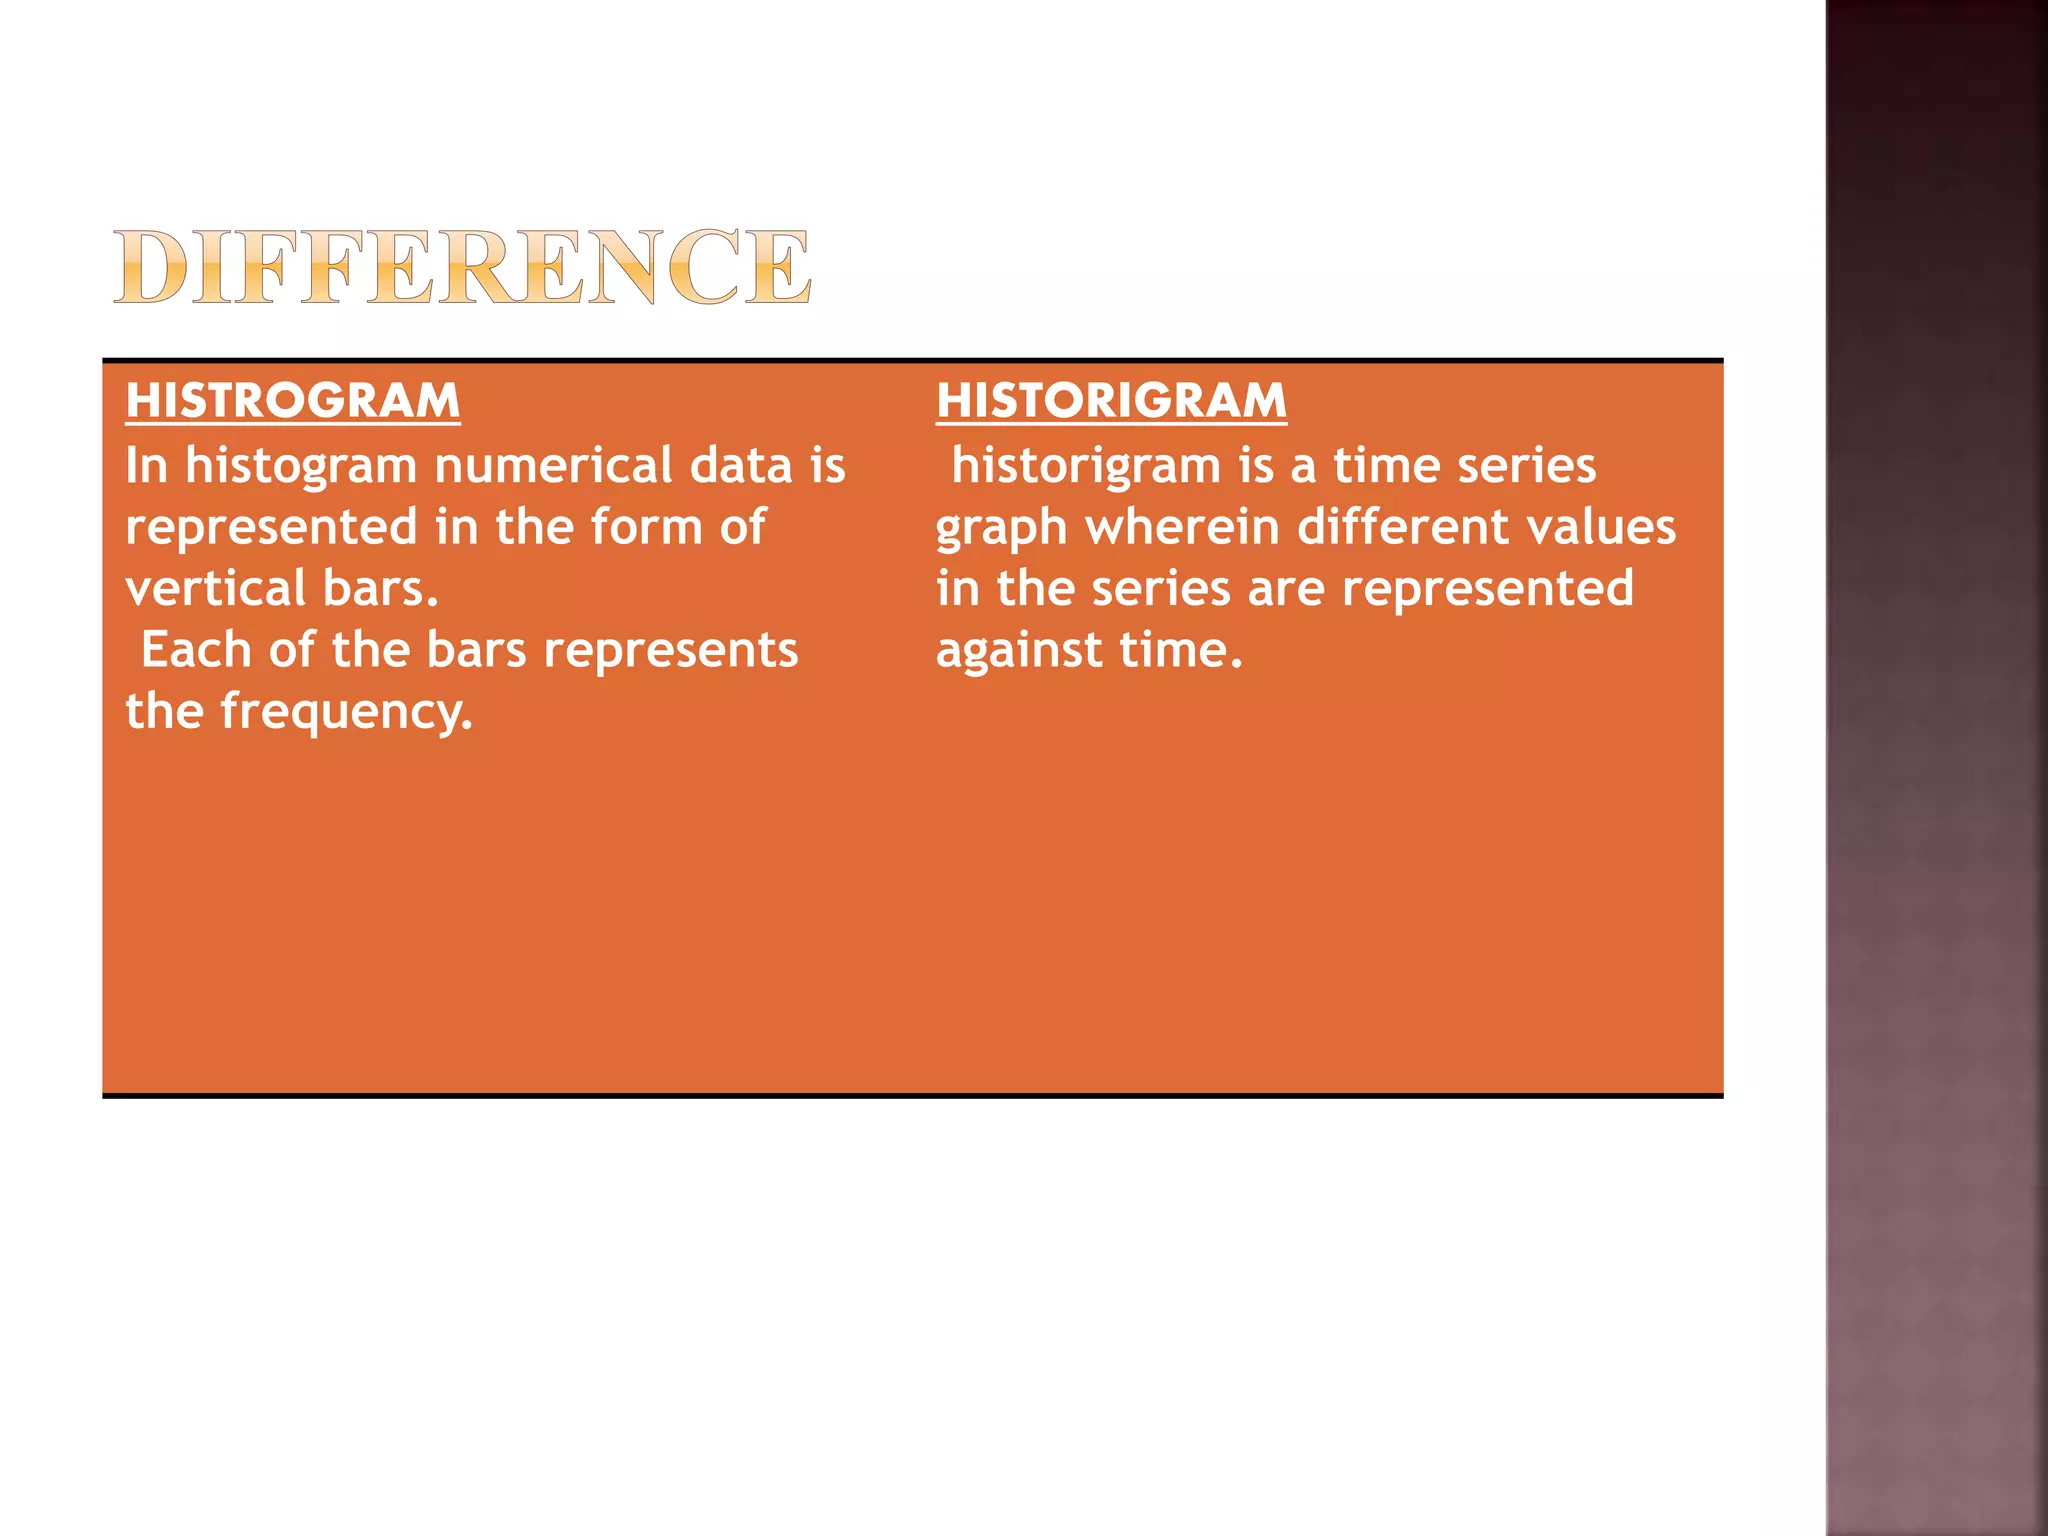
This document defines and explains histograms and historigrams. It begins by defining a histogram as a representation of a frequency distribution using rectangles whose widths represent class intervals and whose areas are proportional to the corresponding frequencies. It then provides an example of constructing a histogram from a data set. A historigram is defined as a graph of a time series with the value of the series on the y-axis plotted against time on the x-axis. The document explains the key parts of a histogram and provides steps for constructing one. It also discusses different types of histograms like uniform, bimodal and symmetric histograms.