SlideShare a Scribd company logo
1 of 6
Contents
Definition
How do I create a Histogram?
Practical use of Histogram?
Why We use a Histogram?
An example of Ungrouped data
1
“ A histogram is a display of statistical information that
uses rectangle to show the frequency of data items in
successive numerical intervals of equal size.
Histogram was first introduced by Karl Pearson.
2
How do I create a Histogram?
 Vertical axis
 Horizontal axis
 Draw a bar
Histograms are useful because they allow
us to glean certain information at a glance.
3
Practical use of
Histogram?
o Identifying the most common process outcome
o Identifying data symmetry
o Spotting deviations
o Verifying equal distribution
o Spotting areas that require little effort
 Image histogram
 Color histogram
4
Example of Grouped Data
5
Class Interval Frequency
10-15 10
15-20 30
20-25 5
6
Thanks!
Any questions?

More Related Content

What's hot

Data handling Presentation with solved examples
Data handling Presentation with solved examplesData handling Presentation with solved examples
Data handling Presentation with solved examplesrithikkapoor7
 
An Educational PPT on Handling data
An Educational PPT on Handling dataAn Educational PPT on Handling data
An Educational PPT on Handling dataBhartendu Jain
 
Chapter 3 research methodology 1
Chapter 3 research methodology 1Chapter 3 research methodology 1
Chapter 3 research methodology 1razalibmuda
 
Data handling class 8th
Data handling class 8thData handling class 8th
Data handling class 8thSanjay Thakran
 
Compression-based Graph Mining Exploiting Structure Primites
Compression-based Graph Mining Exploiting Structure PrimitesCompression-based Graph Mining Exploiting Structure Primites
Compression-based Graph Mining Exploiting Structure PrimitesWerner Hoffmann
 
geographic information system pdf
geographic information system pdfgeographic information system pdf
geographic information system pdfRolan Ben Lorono
 
20210225_ロボティクス勉強会_パーティクルフィルタのMAP推定の高速手法「FAST-MAP」を作ってみた
20210225_ロボティクス勉強会_パーティクルフィルタのMAP推定の高速手法「FAST-MAP」を作ってみた20210225_ロボティクス勉強会_パーティクルフィルタのMAP推定の高速手法「FAST-MAP」を作ってみた
20210225_ロボティクス勉強会_パーティクルフィルタのMAP推定の高速手法「FAST-MAP」を作ってみたMori Ken
 
What is Line Graph
What is Line GraphWhat is Line Graph
What is Line GraphAsad Afridi
 
Statistics
StatisticsStatistics
Statisticsdiereck
 
Euro30 2019 - Benchmarking tree approaches on street data
Euro30 2019 - Benchmarking tree approaches on street dataEuro30 2019 - Benchmarking tree approaches on street data
Euro30 2019 - Benchmarking tree approaches on street dataFabion Kauker
 
2.6b scatter plots and lines of best fit
2.6b scatter plots and lines of best fit2.6b scatter plots and lines of best fit
2.6b scatter plots and lines of best fithartcher
 
Creating graphs -_key_points
Creating graphs -_key_pointsCreating graphs -_key_points
Creating graphs -_key_pointsNadiya Mahjabin
 
Histogram and historigram
Histogram and historigram Histogram and historigram
Histogram and historigram salihashaheen
 

What's hot (17)

Data handling
Data handlingData handling
Data handling
 
Data handling Presentation with solved examples
Data handling Presentation with solved examplesData handling Presentation with solved examples
Data handling Presentation with solved examples
 
An Educational PPT on Handling data
An Educational PPT on Handling dataAn Educational PPT on Handling data
An Educational PPT on Handling data
 
Chapter 3 research methodology 1
Chapter 3 research methodology 1Chapter 3 research methodology 1
Chapter 3 research methodology 1
 
Data handling class 8th
Data handling class 8thData handling class 8th
Data handling class 8th
 
Datahandling
DatahandlingDatahandling
Datahandling
 
Compression-based Graph Mining Exploiting Structure Primites
Compression-based Graph Mining Exploiting Structure PrimitesCompression-based Graph Mining Exploiting Structure Primites
Compression-based Graph Mining Exploiting Structure Primites
 
geographic information system pdf
geographic information system pdfgeographic information system pdf
geographic information system pdf
 
20210225_ロボティクス勉強会_パーティクルフィルタのMAP推定の高速手法「FAST-MAP」を作ってみた
20210225_ロボティクス勉強会_パーティクルフィルタのMAP推定の高速手法「FAST-MAP」を作ってみた20210225_ロボティクス勉強会_パーティクルフィルタのMAP推定の高速手法「FAST-MAP」を作ってみた
20210225_ロボティクス勉強会_パーティクルフィルタのMAP推定の高速手法「FAST-MAP」を作ってみた
 
Graphs
GraphsGraphs
Graphs
 
What is Line Graph
What is Line GraphWhat is Line Graph
What is Line Graph
 
Statistics
StatisticsStatistics
Statistics
 
Euro30 2019 - Benchmarking tree approaches on street data
Euro30 2019 - Benchmarking tree approaches on street dataEuro30 2019 - Benchmarking tree approaches on street data
Euro30 2019 - Benchmarking tree approaches on street data
 
3D Analyst
3D Analyst3D Analyst
3D Analyst
 
2.6b scatter plots and lines of best fit
2.6b scatter plots and lines of best fit2.6b scatter plots and lines of best fit
2.6b scatter plots and lines of best fit
 
Creating graphs -_key_points
Creating graphs -_key_pointsCreating graphs -_key_points
Creating graphs -_key_points
 
Histogram and historigram
Histogram and historigram Histogram and historigram
Histogram and historigram
 

Similar to Statistics

Aed1222 lesson 6
Aed1222 lesson 6Aed1222 lesson 6
Aed1222 lesson 6nurun2010
 
Aed1222 lesson 6 2nd part
Aed1222 lesson 6 2nd partAed1222 lesson 6 2nd part
Aed1222 lesson 6 2nd partnurun2010
 
DATA HANDLING-meaning, concept ,examples
DATA HANDLING-meaning, concept ,examplesDATA HANDLING-meaning, concept ,examples
DATA HANDLING-meaning, concept ,examplesIqraAnsari62
 
The Role of Histograms in Exploring Data Insights
The Role of Histograms in Exploring Data InsightsThe Role of Histograms in Exploring Data Insights
The Role of Histograms in Exploring Data InsightsCIToolkit
 
Plotting histogram in bigdata analytics
Plotting histogram in bigdata analyticsPlotting histogram in bigdata analytics
Plotting histogram in bigdata analyticsRajalakshmiK19
 
Graphs- A tool to present data
Graphs- A tool to present dataGraphs- A tool to present data
Graphs- A tool to present dataDr-Jitendra Patel
 
3.5 Exploratory Data Analysis
3.5 Exploratory Data Analysis3.5 Exploratory Data Analysis
3.5 Exploratory Data Analysismlong24
 
Data Visualization (1).pptx
Data Visualization (1).pptxData Visualization (1).pptx
Data Visualization (1).pptxcfiskillzz159
 
Histograms & Mean Median Mode
Histograms & Mean Median ModeHistograms & Mean Median Mode
Histograms & Mean Median ModeBirbe Doll
 
2 biostatistics presenting data
2  biostatistics presenting data2  biostatistics presenting data
2 biostatistics presenting dataDr. Nazar Jaf
 
UNIT_4_data visualization.pptx
UNIT_4_data visualization.pptxUNIT_4_data visualization.pptx
UNIT_4_data visualization.pptxBhagyasriPatel2
 
Data Mining Exploring DataLecture Notes for Chapter 3
Data Mining Exploring DataLecture Notes for Chapter 3Data Mining Exploring DataLecture Notes for Chapter 3
Data Mining Exploring DataLecture Notes for Chapter 3OllieShoresna
 
Graphicalrepresntationofdatausingstatisticaltools2019_210902_105156.pdf
Graphicalrepresntationofdatausingstatisticaltools2019_210902_105156.pdfGraphicalrepresntationofdatausingstatisticaltools2019_210902_105156.pdf
Graphicalrepresntationofdatausingstatisticaltools2019_210902_105156.pdfHimakshi7
 
Graphical representation histogram
Graphical representation  histogramGraphical representation  histogram
Graphical representation histogramMayuri Joshi
 

Similar to Statistics (20)

Histogram
HistogramHistogram
Histogram
 
Histogram
HistogramHistogram
Histogram
 
Aed1222 lesson 6
Aed1222 lesson 6Aed1222 lesson 6
Aed1222 lesson 6
 
Aed1222 lesson 6 2nd part
Aed1222 lesson 6 2nd partAed1222 lesson 6 2nd part
Aed1222 lesson 6 2nd part
 
DATA HANDLING-meaning, concept ,examples
DATA HANDLING-meaning, concept ,examplesDATA HANDLING-meaning, concept ,examples
DATA HANDLING-meaning, concept ,examples
 
The Role of Histograms in Exploring Data Insights
The Role of Histograms in Exploring Data InsightsThe Role of Histograms in Exploring Data Insights
The Role of Histograms in Exploring Data Insights
 
Plotting histogram in bigdata analytics
Plotting histogram in bigdata analyticsPlotting histogram in bigdata analytics
Plotting histogram in bigdata analytics
 
Graphs- A tool to present data
Graphs- A tool to present dataGraphs- A tool to present data
Graphs- A tool to present data
 
3.5 Exploratory Data Analysis
3.5 Exploratory Data Analysis3.5 Exploratory Data Analysis
3.5 Exploratory Data Analysis
 
Data Visualization (1).pptx
Data Visualization (1).pptxData Visualization (1).pptx
Data Visualization (1).pptx
 
Histograms & Mean Median Mode
Histograms & Mean Median ModeHistograms & Mean Median Mode
Histograms & Mean Median Mode
 
2 biostatistics presenting data
2  biostatistics presenting data2  biostatistics presenting data
2 biostatistics presenting data
 
UNIT_4_data visualization.pptx
UNIT_4_data visualization.pptxUNIT_4_data visualization.pptx
UNIT_4_data visualization.pptx
 
Histogram
HistogramHistogram
Histogram
 
Data Mining Exploring DataLecture Notes for Chapter 3
Data Mining Exploring DataLecture Notes for Chapter 3Data Mining Exploring DataLecture Notes for Chapter 3
Data Mining Exploring DataLecture Notes for Chapter 3
 
Graphicalrepresntationofdatausingstatisticaltools2019_210902_105156.pdf
Graphicalrepresntationofdatausingstatisticaltools2019_210902_105156.pdfGraphicalrepresntationofdatausingstatisticaltools2019_210902_105156.pdf
Graphicalrepresntationofdatausingstatisticaltools2019_210902_105156.pdf
 
Introduction to Descriptive Statistics
Introduction to Descriptive StatisticsIntroduction to Descriptive Statistics
Introduction to Descriptive Statistics
 
Graphical representation histogram
Graphical representation  histogramGraphical representation  histogram
Graphical representation histogram
 
Statistics three
Statistics threeStatistics three
Statistics three
 
Workshop lyons ray
Workshop lyons rayWorkshop lyons ray
Workshop lyons ray
 

Recently uploaded

Organic Name Reactions for the students and aspirants of Chemistry12th.pptx
Organic Name Reactions  for the students and aspirants of Chemistry12th.pptxOrganic Name Reactions  for the students and aspirants of Chemistry12th.pptx
Organic Name Reactions for the students and aspirants of Chemistry12th.pptxVS Mahajan Coaching Centre
 
1029 - Danh muc Sach Giao Khoa 10 . pdf
1029 -  Danh muc Sach Giao Khoa 10 . pdf1029 -  Danh muc Sach Giao Khoa 10 . pdf
1029 - Danh muc Sach Giao Khoa 10 . pdfQucHHunhnh
 
Presentation by Andreas Schleicher Tackling the School Absenteeism Crisis 30 ...
Presentation by Andreas Schleicher Tackling the School Absenteeism Crisis 30 ...Presentation by Andreas Schleicher Tackling the School Absenteeism Crisis 30 ...
Presentation by Andreas Schleicher Tackling the School Absenteeism Crisis 30 ...EduSkills OECD
 
microwave assisted reaction. General introduction
microwave assisted reaction. General introductionmicrowave assisted reaction. General introduction
microwave assisted reaction. General introductionMaksud Ahmed
 
Accessible design: Minimum effort, maximum impact
Accessible design: Minimum effort, maximum impactAccessible design: Minimum effort, maximum impact
Accessible design: Minimum effort, maximum impactdawncurless
 
Call Girls in Dwarka Mor Delhi Contact Us 9654467111
Call Girls in Dwarka Mor Delhi Contact Us 9654467111Call Girls in Dwarka Mor Delhi Contact Us 9654467111
Call Girls in Dwarka Mor Delhi Contact Us 9654467111Sapana Sha
 
Introduction to AI in Higher Education_draft.pptx
Introduction to AI in Higher Education_draft.pptxIntroduction to AI in Higher Education_draft.pptx
Introduction to AI in Higher Education_draft.pptxpboyjonauth
 
Measures of Central Tendency: Mean, Median and Mode
Measures of Central Tendency: Mean, Median and ModeMeasures of Central Tendency: Mean, Median and Mode
Measures of Central Tendency: Mean, Median and ModeThiyagu K
 
Interactive Powerpoint_How to Master effective communication
Interactive Powerpoint_How to Master effective communicationInteractive Powerpoint_How to Master effective communication
Interactive Powerpoint_How to Master effective communicationnomboosow
 
Student login on Anyboli platform.helpin
Student login on Anyboli platform.helpinStudent login on Anyboli platform.helpin
Student login on Anyboli platform.helpinRaunakKeshri1
 
Software Engineering Methodologies (overview)
Software Engineering Methodologies (overview)Software Engineering Methodologies (overview)
Software Engineering Methodologies (overview)eniolaolutunde
 
SOCIAL AND HISTORICAL CONTEXT - LFTVD.pptx
SOCIAL AND HISTORICAL CONTEXT - LFTVD.pptxSOCIAL AND HISTORICAL CONTEXT - LFTVD.pptx
SOCIAL AND HISTORICAL CONTEXT - LFTVD.pptxiammrhaywood
 
Arihant handbook biology for class 11 .pdf
Arihant handbook biology for class 11 .pdfArihant handbook biology for class 11 .pdf
Arihant handbook biology for class 11 .pdfchloefrazer622
 
Kisan Call Centre - To harness potential of ICT in Agriculture by answer farm...
Kisan Call Centre - To harness potential of ICT in Agriculture by answer farm...Kisan Call Centre - To harness potential of ICT in Agriculture by answer farm...
Kisan Call Centre - To harness potential of ICT in Agriculture by answer farm...Krashi Coaching
 
The Most Excellent Way | 1 Corinthians 13
The Most Excellent Way | 1 Corinthians 13The Most Excellent Way | 1 Corinthians 13
The Most Excellent Way | 1 Corinthians 13Steve Thomason
 

Recently uploaded (20)

Mattingly "AI & Prompt Design: The Basics of Prompt Design"
Mattingly "AI & Prompt Design: The Basics of Prompt Design"Mattingly "AI & Prompt Design: The Basics of Prompt Design"
Mattingly "AI & Prompt Design: The Basics of Prompt Design"
 
INDIA QUIZ 2024 RLAC DELHI UNIVERSITY.pptx
INDIA QUIZ 2024 RLAC DELHI UNIVERSITY.pptxINDIA QUIZ 2024 RLAC DELHI UNIVERSITY.pptx
INDIA QUIZ 2024 RLAC DELHI UNIVERSITY.pptx
 
Organic Name Reactions for the students and aspirants of Chemistry12th.pptx
Organic Name Reactions  for the students and aspirants of Chemistry12th.pptxOrganic Name Reactions  for the students and aspirants of Chemistry12th.pptx
Organic Name Reactions for the students and aspirants of Chemistry12th.pptx
 
1029 - Danh muc Sach Giao Khoa 10 . pdf
1029 -  Danh muc Sach Giao Khoa 10 . pdf1029 -  Danh muc Sach Giao Khoa 10 . pdf
1029 - Danh muc Sach Giao Khoa 10 . pdf
 
Presentation by Andreas Schleicher Tackling the School Absenteeism Crisis 30 ...
Presentation by Andreas Schleicher Tackling the School Absenteeism Crisis 30 ...Presentation by Andreas Schleicher Tackling the School Absenteeism Crisis 30 ...
Presentation by Andreas Schleicher Tackling the School Absenteeism Crisis 30 ...
 
microwave assisted reaction. General introduction
microwave assisted reaction. General introductionmicrowave assisted reaction. General introduction
microwave assisted reaction. General introduction
 
TataKelola dan KamSiber Kecerdasan Buatan v022.pdf
TataKelola dan KamSiber Kecerdasan Buatan v022.pdfTataKelola dan KamSiber Kecerdasan Buatan v022.pdf
TataKelola dan KamSiber Kecerdasan Buatan v022.pdf
 
Accessible design: Minimum effort, maximum impact
Accessible design: Minimum effort, maximum impactAccessible design: Minimum effort, maximum impact
Accessible design: Minimum effort, maximum impact
 
Call Girls in Dwarka Mor Delhi Contact Us 9654467111
Call Girls in Dwarka Mor Delhi Contact Us 9654467111Call Girls in Dwarka Mor Delhi Contact Us 9654467111
Call Girls in Dwarka Mor Delhi Contact Us 9654467111
 
Introduction to AI in Higher Education_draft.pptx
Introduction to AI in Higher Education_draft.pptxIntroduction to AI in Higher Education_draft.pptx
Introduction to AI in Higher Education_draft.pptx
 
Código Creativo y Arte de Software | Unidad 1
Código Creativo y Arte de Software | Unidad 1Código Creativo y Arte de Software | Unidad 1
Código Creativo y Arte de Software | Unidad 1
 
Mattingly "AI & Prompt Design: Structured Data, Assistants, & RAG"
Mattingly "AI & Prompt Design: Structured Data, Assistants, & RAG"Mattingly "AI & Prompt Design: Structured Data, Assistants, & RAG"
Mattingly "AI & Prompt Design: Structured Data, Assistants, & RAG"
 
Measures of Central Tendency: Mean, Median and Mode
Measures of Central Tendency: Mean, Median and ModeMeasures of Central Tendency: Mean, Median and Mode
Measures of Central Tendency: Mean, Median and Mode
 
Interactive Powerpoint_How to Master effective communication
Interactive Powerpoint_How to Master effective communicationInteractive Powerpoint_How to Master effective communication
Interactive Powerpoint_How to Master effective communication
 
Student login on Anyboli platform.helpin
Student login on Anyboli platform.helpinStudent login on Anyboli platform.helpin
Student login on Anyboli platform.helpin
 
Software Engineering Methodologies (overview)
Software Engineering Methodologies (overview)Software Engineering Methodologies (overview)
Software Engineering Methodologies (overview)
 
SOCIAL AND HISTORICAL CONTEXT - LFTVD.pptx
SOCIAL AND HISTORICAL CONTEXT - LFTVD.pptxSOCIAL AND HISTORICAL CONTEXT - LFTVD.pptx
SOCIAL AND HISTORICAL CONTEXT - LFTVD.pptx
 
Arihant handbook biology for class 11 .pdf
Arihant handbook biology for class 11 .pdfArihant handbook biology for class 11 .pdf
Arihant handbook biology for class 11 .pdf
 
Kisan Call Centre - To harness potential of ICT in Agriculture by answer farm...
Kisan Call Centre - To harness potential of ICT in Agriculture by answer farm...Kisan Call Centre - To harness potential of ICT in Agriculture by answer farm...
Kisan Call Centre - To harness potential of ICT in Agriculture by answer farm...
 
The Most Excellent Way | 1 Corinthians 13
The Most Excellent Way | 1 Corinthians 13The Most Excellent Way | 1 Corinthians 13
The Most Excellent Way | 1 Corinthians 13
 

Statistics

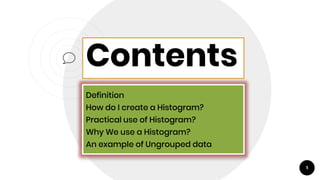
  • 1. Contents Definition How do I create a Histogram? Practical use of Histogram? Why We use a Histogram? An example of Ungrouped data 1
  • 2. “ A histogram is a display of statistical information that uses rectangle to show the frequency of data items in successive numerical intervals of equal size. Histogram was first introduced by Karl Pearson. 2
  • 3. How do I create a Histogram?  Vertical axis  Horizontal axis  Draw a bar Histograms are useful because they allow us to glean certain information at a glance. 3
  • 4. Practical use of Histogram? o Identifying the most common process outcome o Identifying data symmetry o Spotting deviations o Verifying equal distribution o Spotting areas that require little effort  Image histogram  Color histogram 4
  • 5. Example of Grouped Data 5 Class Interval Frequency 10-15 10 15-20 30 20-25 5