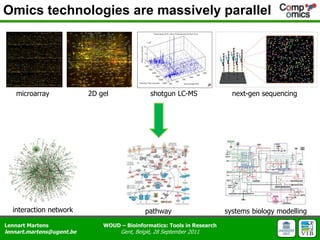
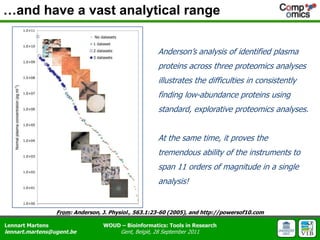
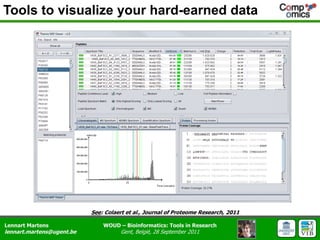
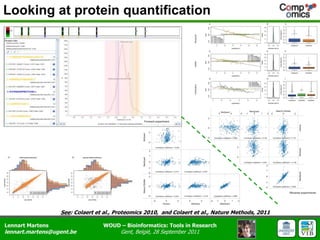
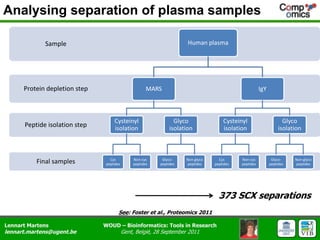
proteomicsand cross-omics integration	lennart martenslennart.martens@ugent.beComputational Omics and Systems Biology GroupDepartment of Medical Protein Research, VIBDepartment of Biochemistry, Ghent UniversityGhent, Belgium
OMICS TECHNOLOGIESIN (CLINICAL) RESEARCH
Omics technologies are massively parallelmicroarray2D gelshotgun LC-MSnext-gen sequencinginteraction networkpathwaysystems biology modelling
…and have a vast analytical rangeAnderson’s analysis of identified plasma proteins across three proteomics analyses illustrates the difficulties in consistently finding low-abundance proteins using standard, explorative proteomics analyses.At the same time, it proves the tremendous ability of the instruments to span 11 orders of magnitude in a single analysis!From: Anderson, J. Physiol., 563.1:23-60 (2005), and http://powersof10.com
ANALYZINGMS PROTEOMICS DATA
Tools to visualize your hard-earned dataSee: Colaert et al., Journal of Proteome Research, 2011
Looking at protein quantificationSee: Colaert et al., Proteomics 2010,  and Colaert et al., Nature Methods, 2011
Analysing separation of plasma samples373 SCX separationsSee: Foster et al., Proteomics 2011
Viewing the analysed data (peptide level) See: Foster et al., Proteomics 2011
A whole experiment in 100 numbersSee: Foster et al., Proteomics 2011
From 20 magicnumbers to 2 dimensionsyeasthumangreen plantszebrafishDrosophilaSee: Foster et al., Proteomics 2011
PREDICTING MS PROTEOMICS DATA
Predicting RT for modified peptidesSee: Moruz et al., submitted
Fragmentation variability (i)See: Barsnes et al, Proteomics, 2010
Fragmentation variability (ii)See: Barsnes et al., Proteomics 2011
Predicting fragment ion intensities (i)
INTEGRATING OMICS DATA
Clinical data – lipidomics CRC
Patient clustering
Direct pathway analysispathwayspatients
ACKNOWLEDGMENTS
CompOmicsgroupand collaboratorsDr. Kenny Helsens, UGentDr. HaraldBarsnes, UiB, Bergen, NODr. Michael Mueller, ICL, London, UKDr. Sven Degroeve, UGentDr.ElienVandermarliere, UGentLuminitaMoruz, CBR/SU, SKNielsHulstaert, UGentMarc Vaudel, ISAS, Dortmund, DEGiulia Gonnelli, UGentThiloMuth, MPI Magdeburg, DEJoe Foster, EMBL-EBI, Cambridge, UKDr.NiklaasColaert, ex-UGent
Acknowledgments - CollaboratorsVIB / UGent, Gent, Belgium  Prof. Dr. Joël Vandekerckhove, Dept. Head (emeritus)Stockholm University, CBR, Sweden  Prof. Dr. Lukas Käll, Group LeaderISAS, Dortmund, Germany  Prof. Dr. Albert Sickmann, Director BioanalyticsEMBL-EBI, Cambridge, UK  Dr. Rolf Apweiler, PANDA Group Leader  Dr. Juan Antonio Vizcaíno, PRIDE Group CoordinatorBergen University, Bergen, Norway  Prof. Ingvar Eidhammer, BCCS  Dr. Frode Berven, PROBE Director
Acknowledgments - Funding
Thank you!Questions?

High-throughput proteomics: from understanding data to predicting them

Editor's Notes

  • #10 From the HUPO PPP2 data set submitted by the Richard Smith Lab at PNNL, 373 experiment, each representing an SCX fraction were retried from pride. The experiments represented 12 individual samples that had undergone a combination of either IgY / MARS depletion and Cys/N-glycosylated peptide fractionation. A experiment vs peptide frequency matrix is generated and then subject to some filtering by tf-idf to increase the contribution of lower abundance peptides to the experiment. The matrix then undergoes latent semantic analysis to further boost signal and identify hidden patterns. This is then transformed into a distance matrix and visualised as a heat map.Approximately one third of the way through the SCX fractionation procedure peptides appear to be bleeding across all subsequent fractions, reducing the separation efficience and hence the detection sensitivity of the system considerably. ii) The effect seen in (i) is confirmed here: the separation is performing quite poorly, with bleeding evident. iii) Additionally, the region highlighted in (ii) shows unexpected similarity between 'MARS Cys' and 'MARS non-Cys' experiments; in theory, the overlap should be extremely small due to the opposite selection procedure. iv) Slight black blurring around the diagonal indicates peptide identification similarity between adjacent fractions; potentially an early warning sign that the SCX separation performance is starting to degrade. We do see superb reproducibility between samples that have undergone the same sample preparation protocol, however. v) Further evidence of the points made in (iv): somewhat further increased blurring, but excellent reproducibility of identifications obtained via IgY depletion. vi) Shows reproduciblity in identifications between different depletion methods; a good QC measure but it also indicated the depletion method does alter the peptides you detect in addition to removing highly abundant proteins. vii) Another example of the points raised in (vi), but now for a different peptide selection technology. viii) An unexpected similarity between 'IgY Non-Cys' and 'IgY Non-Gly' sample separation.
  • #11 For single experiment all the MS2 spectra are collected, the peaklist is then filtered for the top 10% most intense peaks. The m/z components are then turned into a distance matrix, these matrices are then combined into a single vector, and a histogram plotted of the frequencies of m/z differences between peaks. On the left we see the region 40-200 plotted (the m/z range of amino acids) the m/z units corresponding to amino acids are shaded in grey, these peak clearly separate themselves form the general level of noise in. This highlights that the majority of peaks really represent peptides. In the graph on the right the same region is plotted, we see the amino acid bars lie well within the noise of the graphs and there is an unusually large peak at 44. this more than likely represented PEG a common contaminants in mass spectrometry which has overshadowed the valuable peaks hindering peptide identification.