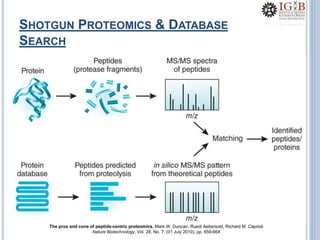
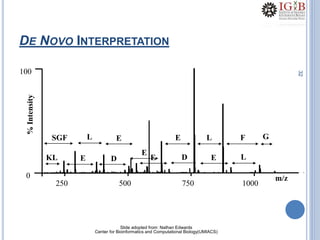
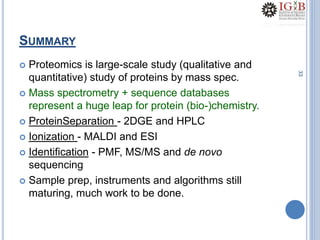
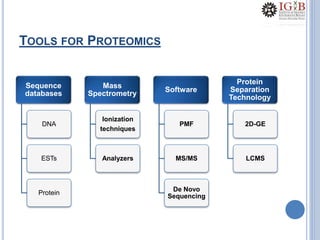
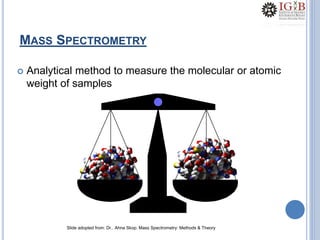
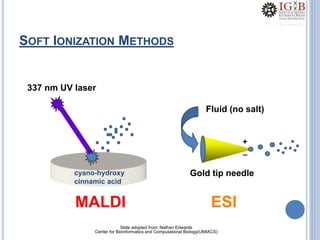
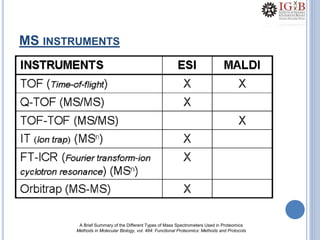
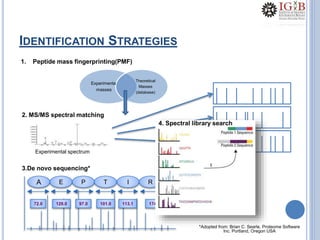
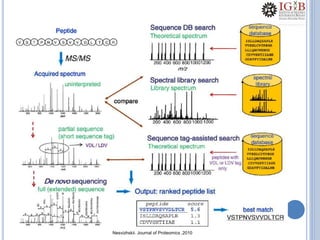
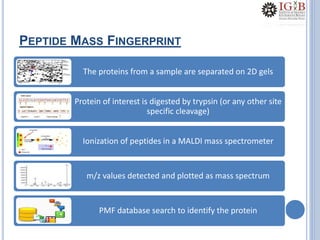
Course B
WHY BOTHER WITH PROTEOMICS?
• Proteins are the machines that drive much
of biology
• Genes are merely the recipe
• The direct characterization of a sample’s
proteins en masse.
• What proteins are present?
• How much of each protein is present?
WHY NOT MICROARRAYS?
Is Proteomics the New Genomics? Jürgen Cox and Matthias Mann, Cell 130, August 10, 2007
ONE GENOME…MANY PROTEOMES
Perhaps not… they
still have a
dynamic
“proteome” code
to break. They
cannot hit a
moving target
AN ANALYTICAL CHALLENGE
Dynamic range
of protein
abundances is
a challenge for
separation
sciences
No equivalent
of PCR for
proteins-deal
with µ- to nmol
concentrations
Alternate
splice forms of
a gene can
make different
proteins
>200 Post
translational
modifications;
cannot be
deduced from
a gene or
mRNA
Edman sequencing cannot provide the solutions !!!
TOOLS FOR PROTEOMICS
Sequence
databases
DNA
ESTs
Protein
Mass
Spectrometry
Ionization
techniques
Analyzers
Software
PMF
MS/MS
De Novo
Sequencing
Protein
Separation
Technology
2D-GE
LCMS
MASS SPECTROMETRY
The PCR for proteins ?
MASS SPECTROMETRY
 Analytical method to measure the molecular or atomic
weight of samples
Slide adopted from: Dr.. Ahna Skop. Mass Spectrometry: Methods & Theory
SOFT IONIZATION METHODS
337 nm UV laser
MALDI
cyano-hydroxy
cinnamic acid
Gold tip needle
Fluid (no salt)
ESI
+
_
Slide adopted from: Nathan Edwards
Center for Bioinformatics and Computational Biology(UMIACS)
MASS SPECTROMETRY PRINCIPLES
Ionizer
Sample
+
_
Mass Analyzer Detector
Slide adopted from: Nathan Edwards
Center for Bioinformatics and Computational Biology(UMIACS)
MASS SPEC EQUATION (TOF)
m
z
2Vt2
=
m = mass of ion L = drift tube length
z = charge of ion t = time of travel
V = voltage
L2
MONOISOTOPIC MASS
www.matrixscience.com
•Mass of the most abundant isotope of a molecule
•Measured in amu or Da
•Usually the lightest isotope of small molecules
UNDERSTANDING A SPECRUM
m/z
RelativeIntensity
853.2 854.3 1200.5
1201.0
+2
+1
(1200.5 × 2) – 2 = 2399.0
MS INSTRUMENTS
A Brief Summary of the Different Types of Mass Spectrometers Used in Proteomics
Methods in Molecular Biology, vol. 484: Functional Proteomics: Methods and Protocols
IDENTIFICATION STRATEGIES
Experimental
masses
Theoretical
Masses
(database)
1. Peptide mass fingerprinting(PMF)
2. MS/MS spectral matching
Experimental spectrum
Theoretical spectra
3.De novo sequencing*
72.0 129.0 97.0 101.0 113.1 174.1
A E P T I R H2O
*Adopted from: Brian C. Searle, Proteome Software
Inc. Portland, Oregon USA
4. Spectral library search
Nesvizhskii. Journal of Proteomics ,2010
PEPTIDE MASS FINGERPRINTING
A rapid way to identify proteins
PEPTIDE MASS FINGERPRINT
The proteins from a sample are separated on 2D gels
Protein of interest is digested by trypsin (or any other site
specific cleavage)
Ionization of peptides in a MALDI mass spectrometer
m/z values detected and plotted as mass spectrum
PMF database search to identify the protein
PROTEASE DIGESTION
trypsin
PEPTIDE MASS FINGERPRINT
m/z
RelativeIntensity
PMF DATABASE SEARCH
450.2201
609.3667
698.3100
1007.5391
1199.4916
2098.9909
PEAKLIST
>gi|2924450|emb|CAA17750.1| PROBABLE FATTY-ACID-CoA LIGASE FADD18 (FRAGMENT) (FATTY-ACID-CoA
SYNTHETASE) (FATTY-ACID-CoA SYNTHASE) [Mycobacterium tuberculosis H37Rv]
MAASLSENLSCHSSNMCRLSGNAATNLERPGEEPPGDRCTRRQAVRPARTLAKKGNIPVGYYKDEKKTAETFRTINGVRYAIPGD
YAQVEEDGTVTMLGRGSVSINSGGEKVYPEEVEAALKGHPDVFDALVVGVPDPRY
GQQVAAVVQARPGCRPSLAELDSFVRSEIAGYKVPRSLWFVDEVKRSPAGKPDYRWAKEQTEARPADDVH
AGHVTSGS
>gi|15610649|ref|NP_218030.1| fatty-acid-CoA ligase [Mycobacterium tuberculosis H37Rv]
MAASLSENLSCHSSNMCRLSGNAATNLERPGEEPPGDRCTRRQAVRPARTLAKKGNIPVGYYKDEKKTAE
TFRTINGVRYAIPGDYAQVEEDGTVTMLGRGSVSINSGGEKVYPEEVEAALKGHPDVFDALVVGVPDPRY
GQQVAAVVQARPGCRPSLAELDSFVRSEIAGYKVPRSLWFVDEVKRSPAGKPDYRWAKEQTEARPADDVH
AGHVTSGS
Protein FASTA
database
450.2017 (P21234)
609.2667 (P12345)
664.3300 (P89212)
1007.4251 (P12345)
1114.4416 (P89212)
1183.5266 (P12345)
1300.5116 (P21234)
1407.6462 (P21234)
1526.6211 (P89212)
1593.7101 (P89212)
1740.7501 (P21234)
2098.8909 (P12345)
in silico
digestion
OUTPUT:
2 Unknown masses
1 hit on P21234
3 hits on P12345
RESULT:
protein is P12345
22
MODIFICATIONS
 Fixed modifications: will be present on any
occurrence of the affected amino acid.Eg.+57@C
 Variable modifications: may be present on some
or all positions of the affected amino acid.
Eg.+16@M
Slide adopted from: Nathan Edwards
Center for Bioinformatics and Computational Biology(UMIACS)
TANDEM MASS SPECTROMETRY
Peptide Sequencing by two stage MS
PRECURSOR SELECTION
m/z
RelativeIntensity
MS1
Tandem MS or MS/MS or MS2
Unfragmented
parent/precursor ion
COLLISION INDUCED DISSOCIATION
CID in presence of inert gas
26
FRAGMENTATION
PEPTIDE
MW ion ion MW
98 b1 P EPTIDE y6 703
227 b2 PE PTIDE y5 574
324 b3 PEP TIDE y4 477
425 b4 PEPT IDE y3 376
538 b5 PEPTI DE y2 263
653 b6 PEPTID E y2 148
SHOTGUN PROTEOMICS & DATABASE
SEARCH
The pros and cons of peptide-centric proteomics. Mark W. Duncan, Ruedi Aebersold, Richard M. Caprioli
Nature Biotechnology, Vol. 28, No. 7. (01 July 2010), pp. 659-664
DATABASE SEARCH ALGORITHMS
 SEQUEST
 Mascot
 X!Tandem
 OMSSA
 ProbID
 Phenyx
 Myrimatch
 MassWiz
DE NOVO SEQUENCING
Sequencing a peptide from scratch
30
DE NOVO INTERPRETATION
100
0
250 500 750 1000
m/z
%Intensity
Slide adopted from: Nathan Edwards
Center for Bioinformatics and Computational Biology(UMIACS)
31
DE NOVO INTERPRETATION
100
0
250 500 750 1000
m/z
%Intensity
E L
Slide adopted from: Nathan Edwards
Center for Bioinformatics and Computational Biology(UMIACS)
32
DE NOVO INTERPRETATION
100
0
250 500 750 1000
m/z
%Intensity
E L F
KL
SGF G
E D
E
L E
E D E L
Slide adopted from: Nathan Edwards
Center for Bioinformatics and Computational Biology(UMIACS)
33
SUMMARY
 Proteomics is large-scale study (qualitative and
quantitative) study of proteins by mass spec.
 Mass spectrometry + sequence databases
represent a huge leap for protein (bio-)chemistry.
 ProteinSeparation - 2DGE and HPLC
 Ionization - MALDI and ESI
 Identification - PMF, MS/MS and de novo
sequencing
 Sample prep, instruments and algorithms still
maturing, much work to be done.
NEXT…
 Significance Assessment of database matches
 False Discovery rate
 Protein Inference

1.proteomics coursework-3 dec2012-aky