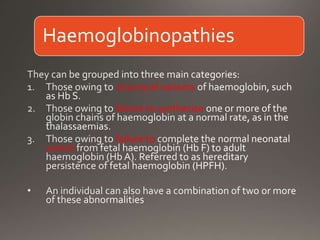
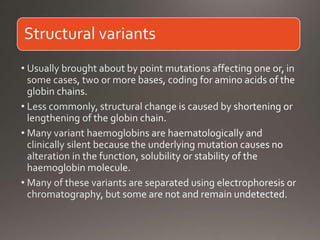
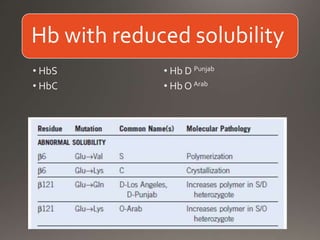
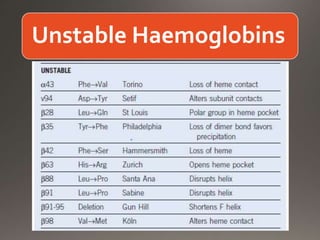
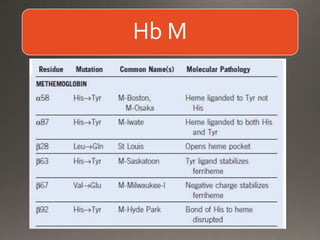
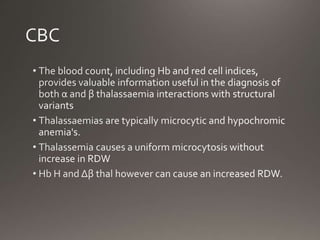
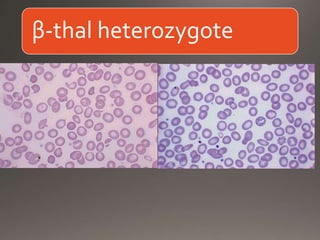
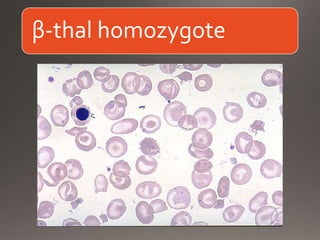
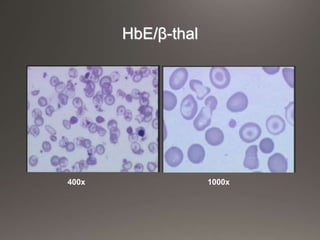
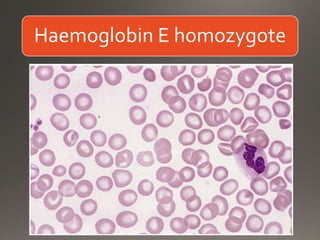
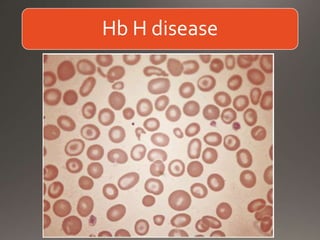
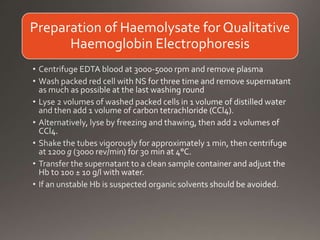
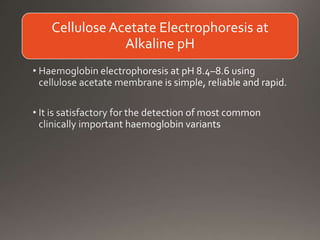
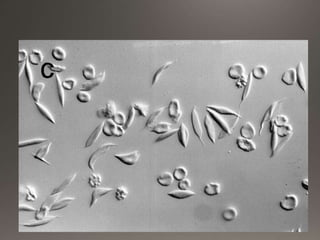
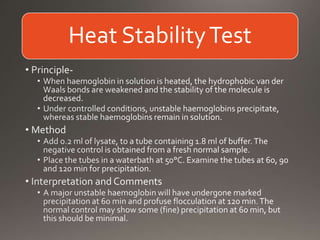
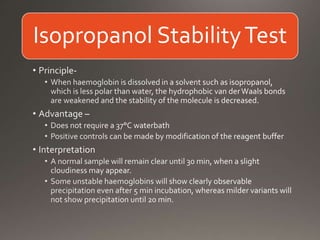
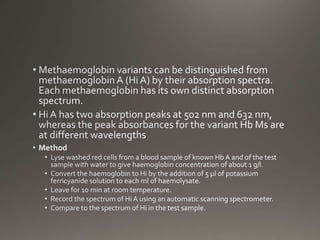
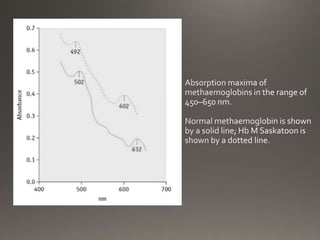
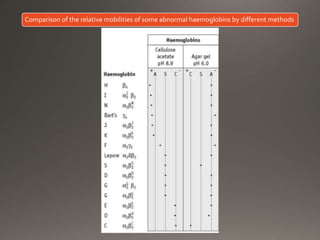
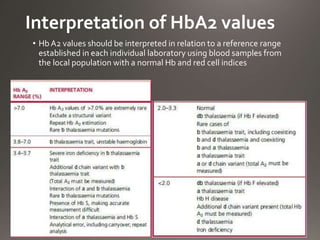
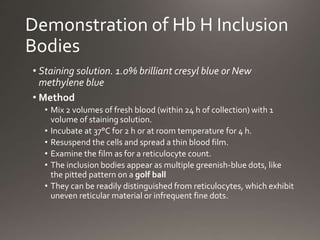
48. Electrophoresis Advantages
• Commercial, widely available, rapid methods used for
many years.
• Gives an estimate of HbA2 level.
• Identifies some variant haemoglobins which are well
characterized
49. Electrophoresis Disadvantages
• Labor-intensive.
• Inaccurate in quantification of low-concentration variants
(HbA2) and in detection of fast variants (HbH, Hb Barts).
• The precision and accuracy for Hb A2 using scanning of
electrophoretic gels is poor (in comparison to HPLC).
50. Will be covered in subsequent session
Automated High-Performance Liquid
Chromatography
55. • The sickling phenomenon may be demonstrated in a thin
wet film of blood (sealed with a petroleum jelly/paraffin
wax mixture or with nail varnish).
• If Hb S is present, the red cells lose their smooth, round
shape and become sickled.
• This process may take up to 12 h in Hb S trait, whereas
changes are apparent in homozygotes and compound
heterozygotes after 1 h at 37°C.
• These changes can be hastened by the addition of a
reducing agent such as sodium metabisulphide or sodium
dithionite
• A test on a positive control of HbA plus Hb S must be
performed at the same time.
Sickling inWhole Blood
69. Comparison of the relative mobilities of some abnormal haemoglobins by different methods
70. Investigation of suspected
thalassaemia
• Full blood count with red cell indices and blood film and,
in selected cases, reticulocyte count
• HbA2 measurement by cellulose acetate
electrophoresis with elution
• HbA2 measurement of microcolumn chromatography
• Automated HPLC
• Quantitation of Hb F
• Assessment of the distribution of Hb F
• Assessment of iron status
• Demonstration of red cell inclusion bodies
• DNA analysis
73. Measurement of Hb A2 by Elution from
Cellulose Acetate
•Principle
• Haemolysate is separated into its component fractions
by alkaline electrophoresis on cellulose acetate
membrane.
• The relative proportions of the separated fractions are
quantitated by spectrometry of the eluates of the
separated fractions
• Duplicate values obtained should be within 0.2%.
• This method is inaccurate in the presence of Hb C, Hb E
and Hb OArab because they do not separate from HbA2
76. Interpretation of HbA2 values
• Hb A2 values should be interpreted in relation to a reference range
established in each individual laboratory using blood samples from
the local population with a normal Hb and red cell indices
77. Quantitation of Hb F
• Hb F may be estimated by several methods based on its
resistance to denaturation at alkaline pH, by HPLC or by
an immunological method
• Modified Betke Method
• Method of Jonxis andVisser
• Radial immunodiffusion method
78. Assessment of the intracellular
distribution of Hb F
• Differences in the intracellular distribution of Hb F
• heterozygotes for δβ thalassaemia -- heterocellular distribution
• ClassicalAfrican type of HPFH -- pancellular distribution
• Immunofluorescent Method
80. Demonstration of Hb H Inclusion
Bodies
• Staining solution. 1.0% brilliant cresyl blue or New
methylene blue
• Method
• Mix 2 volumes of fresh blood (within 24 h of collection) with 1
volume of staining solution.
• Incubate at 37°C for 2 h or at room temperature for 4 h.
• Resuspend the cells and spread a thin blood film.
• Examine the film as for a reticulocyte count.
• The inclusion bodies appear as multiple greenish-blue dots, like
the pitted pattern on a golf ball
• They can be readily distinguished from reticulocytes, which exhibit
uneven reticular material or infrequent fine dots.
81. HbH preparation interpretation
• In α+ thalassaemia trait, only a very occasional H body
(1:1000 to 1:10 000) is usually seen
• This test is most useful in Hb H disease, where inclusions
are usually found in more than 30% of red cells.
• Number of cells developing inclusions does not correlate
with genotype
• Absence of inclusion does not preclude a diagnosis
of α thalassaemia trait