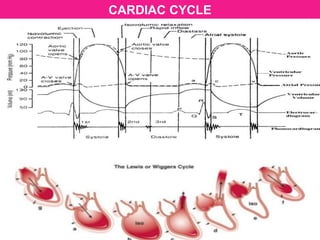
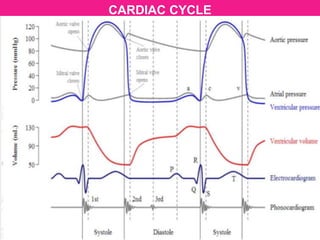
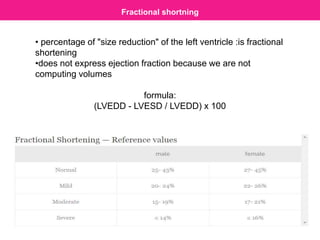
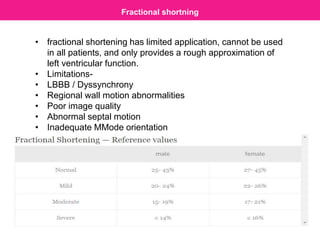
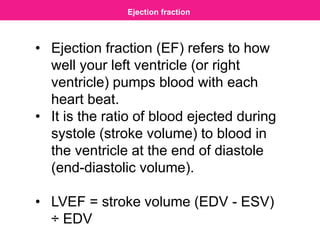
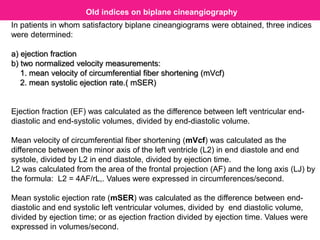
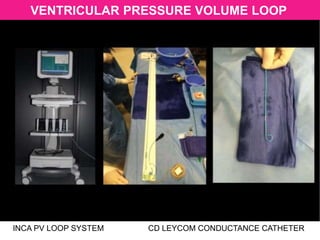
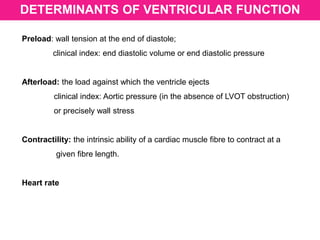
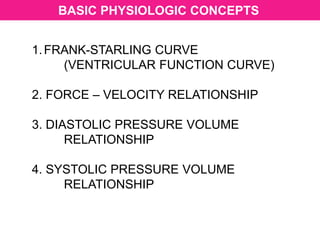
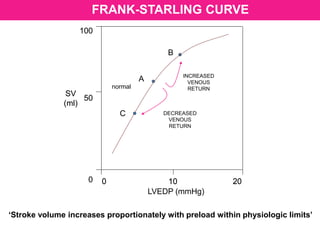
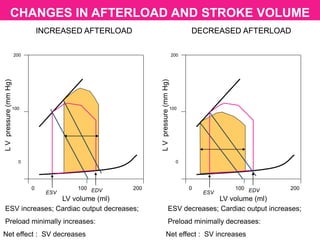
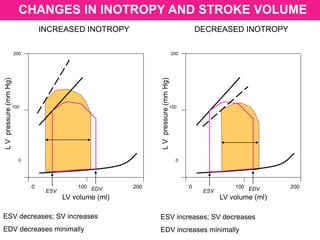
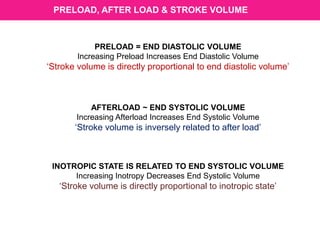
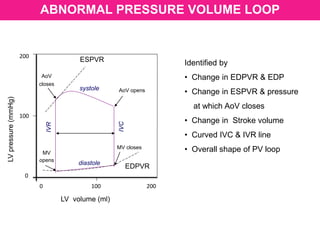
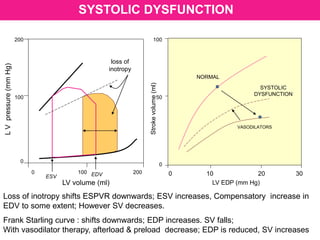
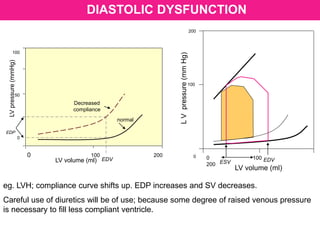
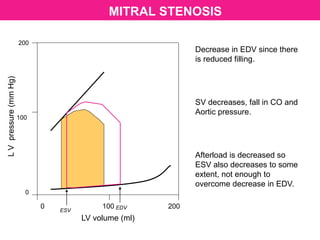
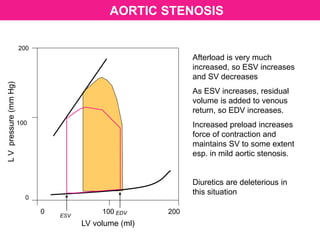
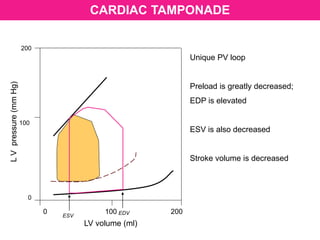
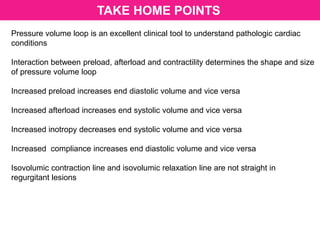
VENTRICULAR
PRESSURE VOLUME LOOP
Dr Dipak Patade
VENTRICULAR PRESSURE VOLUME LOOP
• Introduction
• Basic physiologic concepts
• Generation of pressure volume loop
• Abnormal pressure volume loop
• PV loop in common pathologic states
CARDIAC CYCLE
CARDIAC CYCLE
cardiac cycle describes pressure, volume and flow phenomena in the ventricles as
a function of time.
Similar for both LV and RV except for the timing, levels of pressure.
Mechanical events in Cardiac cycle :
Systole :
• Isovolumic contraction
• Maximal ejection
• Reduced ejection
Diastole :
• Isovolumic relaxation
• Rapid filling phase
• Slow filling phase /diastasis
• Atrial systole
•The pulmonary valve remains open for some time even after the right ventricular
pressure becomes equal to pulmonary artery pressure at end of systole this time
interval is known as hangout interval
Why does pulmonary valve remain open even after pressure equilisation?
•According to Newton’s first law of motion, every body continues to move at
constant speed unless acted upon by an external force .In this case, the blood
continues to flow from the right ventricle even after the the pressure in the right
ventricle and the pulmonary artery becomes equal ,Just like a rolling ball is
stopped by the friction offered by the ground, the ejection of blood is stopped by
the resistance offered by the pulmonary vasculature.Since the pulmonary
vascular resistance is low compared to the systemic vascular resistance, it takes
some time for the blood flow from the right ventricle to stop This corresponds to
the hangout interval.
Significance of hangout interval
•Hangout interval is shortened in cases of increased pulmonary vascular
resistance such as pulmonary vasospasm, obliteration of pulmonary vessels etc
Does the aortic valve have a hangout interval?
•Due to high systemic vascular resistance, the aortic valve closes almost
immediately Hence hangout interval is negligible
hangout interval
LV contraction
Actin myosin contraction triggered by arrival of Calcium ions
at contractile proteins.
ECG – peak of R wave
LV pressure >LA pressure (10-15mm Hg) Followed approx.
50msec by M1.
Delay of M1 – inertia of the blood flow – valve is kept open.
Isovolumic contraction as volume is fixed.
Increased pressure as more fibers enter contractile state.
LV pressure >Aorta – Aortic valve opens – silent event
clinically.
LV RELAXATION
Isovolumic relaxation(e)
Start of relaxation in reduced ejection (d)
Rapid phase(f)
Slow filling (diastasis)(g)
Atrial systole or booster
LV RELAXATION
Rapid filling phase – active diastolic relaxation of LV.
• LA- LV pressures equalize - diastasis.
• LA booster atrial systole – important in exercise and LVH.
• First phase of diastole –isovolumic phase – no ventricular
filling.
Most of ventricular filling 80% –rapid filling phase.
Diastasis -5%
Final atrial booster phase -15%.
The sucking effect of ventricle – myosin is pulled into the
space between the two anchoring segments of titin.
Dominant backward pressure wave –diastolic coronary
filling.
LV filling
• Wall stress at the end of diastole – maximum resting
length of sarcomere.
• Increasing LVEDV increases SV in ejecting
beats,increases LV pressure in isovolumic beats.
• Modulation of ventricular performance by changes
in preload with constant afterload –heterometric
autoregulation,
operates on a beat –to beat basis
Preload
Exact definition – wall stress during LV ejection.
Tension in the LV wall that resists ventricular ejection
or as the arterial input impedance.
In clinical practice the arterial blood pressure is often
taken as synonymous with afterload while ignoring
aortic compliance (increase in stiff aorta).
Afterload
• Frank Starling – venous pressure in RA – heart volume
Within physiological limits – the larger the volume of the heart –greater
the energy of its contraction – the greater the amount of chemical change
at each contraction.
LV volume – Cardiac Output Stroke volume related to LVEDV – modern
version Real time 3D ECHO – global LV volume,endocardial function LV
volume surrogate markers – LVEDP ,PCWP.
Frank – greater the initial LV volume – more rapid rate of rise
greater the peak pressure reached –faster the rate of relaxation.
An important compensatory mechanism that maintains stroke volume
,when there is myocardial dysfunction or excessive afterload. Atria also
exhibit frank starling curve – exercise.(resistance to early diastolic filling).
Frank Starling mechanism
Hemodynamic variables
•stroke volume -the quantity of blood expelled from the
ventricle per beat
•cardiac output -multiply stroke volume by heart represents
the volume of ejected blood per minute
•cardiac index :when you divide cardiac output by body
surface area you obtain the cardiac index.
dP/dt is a parameter of
myocardial contractility.
Dp/dt represents the ratio of pressure
change in the ventricular cavity during
the isovolemic contraction period.
LV dP/dt is estimated by using time
interval between 1 and 3 m/sec on
MR velocity spectrum.(because
velocities represent pressure
gradients -by applying the
Bernoulli equation of 4v2).
The faster the ventricle is able to
build up pressure, the better it
functions. As pressure in the left
atrium during early systole may
be neglected, the MR velocity is
the instantaneous systolic
pressure in the left ventricle
(which resembles systolic blood
pressure).
Contractility - dP/dt
It is the inherent capacity of the myocardium to
contract independently of changes in the preload and
afterload.
An increased contractile function –assosciated with
greater degree of relaxation – LUSITROPIC effect
Important regulator of My02 uptake
Increased contractile function by exercise,adrenergic
stimulation,digitalis,other inotropic agents
Contractility
The term compliance is used to describe how easily a chamber of the heart or the
lumen of a blood vessel expands when it is filled with a volume of blood.
Physically, compliance (C) is defined as the change in volume (ΔV) divided by
the change in pressure (ΔP).
C = ΔV / ΔP
compliance
The slope of the curve at any given pressure and volume (dV/dP) represents the
compliance of the vessel at that pressure and volume.
at higher volumes and pressures there is a larger change in pressure for a given
change in volume.
Another way to think of this is that the "stiffness" of the vessel wall (reciprocal of
compliance) increases at higher volumes and pressures.
This non-linearity in the relationship between volume and pressure is common in
biological tissues.
Compliance is a
fundamental property of
a tissue; however, the
compliance can be
modified by histological
changes in the tissue.
This occurs, for
example, when a heart
structurally remodels in
response to chronic
volume or pressure
overload conditions. In a
blood vessel,
compliance can also be
altered by contraction of
smooth muscle in the
vessel wall, which
decreases the
compliance of the
vessel.
compliance
The compliance of the ventricle is determined by the structural properties of
the cardiac muscle (e.g., muscle fibers and their orientation, and connective
tissue) as well as by the state of ventricular contraction and relaxation.
For example, in ventricular hypertrophy the ventricular compliance is
decreased (i.e., the ventricle is "stiffer") because the thickness of the
ventricular wall increases;
therefore, ventricular end-diastolic pressure (EDP) is higher at any given end-
diastolic volume (EDV)
compliance
The Tei index : myocardial performance index (MPI)
It is a parameter for global ventricular performance.
The Tei index consists of 3 variables which are derived from Doppler spectrum.
The formula is: MPI = (IVCT + IVRT) / ET
When systolic dysfunction is present in patients IVCT will increase and ET decrease.
Normal range is considered at 0,39+/-0,05. An MPI over 0,5 is considered abnormal.
Tei index / Myocardial performance index
Fractional shortning
• percentage of "size reduction" of the left ventricle :is fractional
shortening
•does not express ejection fraction because we are not
computing volumes
formula:
(LVEDD - LVESD / LVEDD) x 100
Fractional shortning
• fractional shortening has limited application, cannot be used
in all patients, and only provides a rough approximation of
left ventricular function.
• Limitations-
• LBBB / Dyssynchrony
• Regional wall motion abnormalities
• Poor image quality
• Abnormal septal motion
• Inadequate MMode orientation
Ejection fraction
• Ejection fraction (EF) refers to how
well your left ventricle (or right
ventricle) pumps blood with each
heart beat.
• It is the ratio of blood ejected during
systole (stroke volume) to blood in
the ventricle at the end of diastole
(end-diastolic volume).
• LVEF = stroke volume (EDV - ESV)
÷ EDV
In patients in whom satisfactory biplane cineangiograms were obtained, three indices
were determined:
a) ejection fraction
b) two normalized velocity measurements:
1. mean velocity of circumferential fiber shortening (mVcf)
2. mean systolic ejection rate.( mSER)
Ejection fraction (EF) was calculated as the difference between left ventricular end-
diastolic and end-systolic volumes, divided by end-diastolic volume.
Mean velocity of circumferential fiber shortening (mVcf) was calculated as the
difference between the minor axis of the left ventricle (L2) in end diastole and end
systole, divided by L2 in end diastole, divided by ejection time.
L2 was calculated from the area of the frontal projection (AF) and the long axis (LJ) by
the formula: L2 = 4AF/rL,. Values were expressed in circumferences/second.
Mean systolic ejection rate (mSER) was calculated as the difference between end-
diastolic and end systolic left ventricular volumes, divided by end diastolic volume,
divided by ejection time; or as ejection fraction divided by ejection time. Values were
expressed in volumes/second.
Old indices on biplane cineangiography
200
100
0
0 100 200
LVpressure(mmHg)
LV volume (ml)
AoV
closes
AoV opens
MV closes
MV
opens
ESPVR
EDPVR
VENTRICULAR PRESSURE VOLUME LOOP
No time representation
PRESSURE &
VOLUME MEASUREMENT
Conductance catheter
Volume by echo
Pressure by high fidelity manometer
APPLICATION
Clinical tool;
• Best of the current approaches to the assessment of the
contractile behaviour of the intact heart. Es,the pressure –
volume relation
Changes in the slope of this line joining the different Es
points are generally good load independent index of the
contractile performance of the heart.
Enhanced inotropic effect, Es shifted upward and to the
left. Lusitropic effect shifted Es downward and to right.
The P-V relationship is linear in smooth muscle,curvilinear
in cardiac muscle(exponential).
Pressure volume loop
LEFT ATRIAL PRESSURE VOLUME LOOP
VENTRICULAR PRESSURE VOLUME LOOP
INCA PV LOOP SYSTEM CD LEYCOM CONDUCTANCE CATHETER
DETERMINANTS OF VENTRICULAR FUNCTION
Preload: wall tension at the end of diastole;
clinical index: end diastolic volume or end diastolic pressure
Afterload: the load against which the ventricle ejects
clinical index: Aortic pressure (in the absence of LVOT obstruction)
or precisely wall stress
Contractility: the intrinsic ability of a cardiac muscle fibre to contract at a
given fibre length.
Heart rate
BASIC PHYSIOLOGIC CONCEPTS
1.FRANK-STARLING CURVE
(VENTRICULAR FUNCTION CURVE)
2. FORCE – VELOCITY RELATIONSHIP
3. DIASTOLIC PRESSURE VOLUME
RELATIONSHIP
4. SYSTOLIC PRESSURE VOLUME
RELATIONSHIP
FRANK-STARLING CURVE
A
B
INCREASED
VENOUS
RETURN
100
50
0 0 10 20
SV
(ml)
LVEDP (mmHg)
100
50
0 0 10 20
SV
(ml)
DECREASED
VENOUS
RETURN
C
normal
‘Stroke volume increases proportionately with preload within physiologic limits’
100
50
0
0 10 20
SV
(ml)
LVEDP (mmHg)
100
50
0
0 10 20
SV
(ml)
FAMILY OF FRANK STARLING CURVES
 Afterload
 Inotropy
 Afterload
 Inotropy
‘Increased afterload and decreased inotropy shifts the curve downward – SV decreases’
‘Decreased afterload and increased inotropy shifts the curve upwards – SV increases’
INOTROPY & FORCE VELOCITY RELATIONSHIP
Afterload (force)
Shorteningvelocity
Normal
Decreased
inotropy
Increased
inotropy
As afterload increases; shortening velocity decreases -- SV decreases;
As afterload decreases, shortening velocity increases – SV increases;
At a given afterload; increasing inotropy increases shortening velocity;
Shorteningvelocity
Afterload (Force)
Increasing preload a c
a
b
c
PRELOAD & FORCE VELOCITY RELATIONSHIP
As afterload increases; shortening velocity decreases -- SV decreases;
As afterload decreases, shortening velocity increases – SV increases;
At a given afterload; increasing preload increases shortening velocity;
EDV
0 100 200
EDP
LVpressure(mmHg)
100
50
0
Decreased
compliance
normal
VENTRICULAR COMPLIANCE CURVE
Increased
compliance
DIASTOLIC PRESSURE VOLUME RELATIONSHIP
‘Slope of the curve is stiffness dP/dV;
Compliance is the inverse of the slope dV/dP’
‘As compliance decreases; filling pressure increases’
200
100
0
0 100 200
LVpressure(mmHg)
LV volume (ml)
ESPVR
EDPVR
END SYSTOLIC PRESSURE VOLUME RELATIONSHIP
normal
 inotropy
 inotropy
200
100
0
0 100 200
LVpressure(mmHg)
LV volume (ml)
AoV
closes
AoV opens
MV closes
MV
opens
4
1
2
3
a
b
c
d
1 = MV closing point
2 = AV opening point
3 = AV closing point
4 = MV opening point
a = Diastole
b = Isovolumic
contraction
c = Systole
d = Isovolumic
relaxation
GENERATION OF PRESSURE VOLUME LOOP
stroke volume
NORMAL PRESSURE VOLUME LOOP
200
100
0
0 100 200
LVpressure(mmHg)
LV volume (ml)
AoV
closes
AoV opens
MV closes
MV
opens
ESPVR
EDPVR
systole
diastole
IVC
IVR
Normal IVR & IVC
Abnormal IVR & IVC
CHANGES IN PRELOAD AND STROKE VOLUME
LV volume (ml)
LVpressure(mmHg)
200
100
0
0 100 200
ESV EDV
LV volume (ml)
LVpressure(mmHg)
200
100
0
0 100 200
ESV EDV
INCREASED PRELOAD DECREASED PRELOADINCREASED PRELOAD DECREASED PRELOAD
EDV increases; Cardiac output increases;
Afterload minimally increases:
Net effect : SV increases
EDV decreases; Cardiac output decreases;
Afterload minimally decreases
Net effect : SV decreases
CHANGES IN AFTERLOAD AND STROKE VOLUME
LV volume (ml)
LVpressure(mmHg)
200
100
0
0 100 200
ESV EDV
LV volume (ml)
LVpressure(mmHg)
200
100
0
0 100 200
ESV EDV
INCREASED AFTERLOAD DECREASED AFTERLOADINCREASED AFTERLOAD DECREASED AFTERLOAD
ESV increases; Cardiac output decreases;
Preload minimally increases:
Net effect : SV decreases
ESV decreases; Cardiac output increases;
Preload minimally decreases:
Net effect : SV increases
CHANGES IN INOTROPY AND STROKE VOLUME
LV volume (ml)
LVpressure(mmHg)
200
100
0
0 100 200
ESV EDV
LV volume (ml)
LVpressure(mmHg)
200
100
0
0 100 200
ESV EDV
INCREASED INOTROPY DECREASED INOTROPY
ESV increases; SV decreases
EDV increases minimally
ESV decreases; SV increases
EDV decreases minimally
PRELOAD, AFTER LOAD & STROKE VOLUME
PRELOAD = END DIASTOLIC VOLUME
Increasing Preload Increases End Diastolic Volume
‘Stroke volume is directly proportional to end diastolic volume’
AFTERLOAD ~ END SYSTOLIC VOLUME
Increasing Afterload Increases End Systolic Volume
‘Stroke volume is inversely related to after load’
INOTROPIC STATE IS RELATED TO END SYSTOLIC VOLUME
Increasing Inotropy Decreases End Systolic Volume
‘Stroke volume is directly proportional to inotropic state’
ABNORMAL PRESSURE VOLUME LOOP
200
100
0
0 100 200
LVpressure(mmHg)
LV volume (ml)
AoV
closes
AoV opens
MV closes
MV
opens
ESPVR
EDPVR
Identified by
• Change in EDPVR & EDP
• Change in ESPVR & pressure
at which AoV closes
• Change in Stroke volume
• Curved IVC & IVR line
• Overall shape of PV loop
systole
diastole
IVC
IVR
SYSTOLIC DYSFUNCTION
LV volume (ml)
LVpressure(mmHg)
200
100
0
0 100 200
ESV EDV
NORMAL
SYSTOLIC
DYSFUNCTION
Strokevolume(ml)
LV EDP (mm Hg)
0 10 20 30
100
50
0
loss of
inotropy
VASODILATORS
Loss of inotropy shifts ESPVR downwards; ESV increases, Compensatory increase in
EDV to some extent; However SV decreases.
Frank Starling curve : shifts downwards; EDP increases. SV falls;
With vasodilator therapy, afterload & preload decrease; EDP is reduced, SV increases
DIASTOLIC DYSFUNCTION
LV volume (ml)
LVpressure(mmHg)
200
100
0 0 100
200 ESV EDVEDV
0 100 200
EDP
LVpressure(mmHg)
100
50
0
Decreased
compliance
normal
LV volume (ml)
eg. LVH; compliance curve shifts up. EDP increases and SV decreases.
Careful use of diuretics will be of use; because some degree of raised venous pressure
is necessary to fill less compliant ventricle.
LV volume (ml)
LVpressure(mmHg)
200
100
0
0 100 200
ESV
EDV
MITRAL STENOSIS
Decrease in EDV since there
is reduced filling.
SV decreases, fall in CO and
Aortic pressure.
Afterload is decreased so
ESV also decreases to some
extent, not enough to
overcome decrease in EDV.
LV volume (ml)
LVpressure(mmHg)
200
100
0
0 100 200
ESV
EDV
AORTIC STENOSIS
Afterload is very much
increased, so ESV increases
and SV decreases
As ESV increases, residual
volume is added to venous
return, so EDV increases.
Increased preload increases
force of contraction and
maintains SV to some extent
esp. in mild aortic stenosis.
Diuretics are deleterious in
this situation
LV volume (ml)
LVpressure(mmHg)
200
100
0
0 100 200
ESV
EDV
CHRONIC AORTIC REGURGITATION
No true Isovolumic contraction
and relaxation
EDV increases greatly.
This increases Stroke volume
and cardiac output.
Afterload increases hence
ESV also increases to some
extent.
Once systolic dysfunction
sets in, ESV increases
progressively and peak
systolic pressure & SV fall
LV volume (ml)
LVpressure(mmHg)
200
100
0
0 100 200
ESV
EDV
CHRONIC MITRAL REGURGITATION
No true isovolumic contraction
and relaxation
EDV increases
Afterload is reduced, so ESV
is reduced
Net effect = SV increases
With systolic dysfunction; ESV
increases, forward stroke
volume decreases
ACUTE AORTIC REGURGITATION
LV volume (ml)
LVpressure(mmHg)
200
100
0
0 100 200
ESV
EDV
Ventricular diastolic volume
increases suddenly
EDV and EDP increases
PV loop appears small
No true isovolumic relaxation
SV falls
LV volume (ml)
LVpressure(mmHg)
200
100
0
0 100 200
ESV
EDV
ACUTE MITRAL REGURGITATION
Ventricular volume increases
abruptly
No true isovolumic
contraction
EDP rapidly increases
PV loop appears small
CARDIAC TAMPONADE
LV volume (ml)
LVpressure(mmHg)
200
100
0
0 100 200
ESV
EDV
Unique PV loop
Preload is greatly decreased;
EDP is elevated
ESV is also decreased
Stroke volume is decreased
TAKE HOME POINTS
Pressure volume loop is an excellent clinical tool to understand pathologic cardiac
conditions
Interaction between preload, afterload and contractility determines the shape and size
of pressure volume loop
Increased preload increases end diastolic volume and vice versa
Increased afterload increases end systolic volume and vice versa
Increased inotropy decreases end systolic volume and vice versa
Increased compliance increases end diastolic volume and vice versa
Isovolumic contraction line and isovolumic relaxation line are not straight in
regurgitant lesions
‘

Ventricular PV loop 2019

  • 1.
  • 2.
    VENTRICULAR PRESSURE VOLUMELOOP • Introduction • Basic physiologic concepts • Generation of pressure volume loop • Abnormal pressure volume loop • PV loop in common pathologic states
  • 3.
  • 4.
  • 5.
    cardiac cycle describespressure, volume and flow phenomena in the ventricles as a function of time. Similar for both LV and RV except for the timing, levels of pressure. Mechanical events in Cardiac cycle : Systole : • Isovolumic contraction • Maximal ejection • Reduced ejection Diastole : • Isovolumic relaxation • Rapid filling phase • Slow filling phase /diastasis • Atrial systole
  • 6.
    •The pulmonary valveremains open for some time even after the right ventricular pressure becomes equal to pulmonary artery pressure at end of systole this time interval is known as hangout interval Why does pulmonary valve remain open even after pressure equilisation? •According to Newton’s first law of motion, every body continues to move at constant speed unless acted upon by an external force .In this case, the blood continues to flow from the right ventricle even after the the pressure in the right ventricle and the pulmonary artery becomes equal ,Just like a rolling ball is stopped by the friction offered by the ground, the ejection of blood is stopped by the resistance offered by the pulmonary vasculature.Since the pulmonary vascular resistance is low compared to the systemic vascular resistance, it takes some time for the blood flow from the right ventricle to stop This corresponds to the hangout interval. Significance of hangout interval •Hangout interval is shortened in cases of increased pulmonary vascular resistance such as pulmonary vasospasm, obliteration of pulmonary vessels etc Does the aortic valve have a hangout interval? •Due to high systemic vascular resistance, the aortic valve closes almost immediately Hence hangout interval is negligible hangout interval
  • 7.
    LV contraction Actin myosincontraction triggered by arrival of Calcium ions at contractile proteins. ECG – peak of R wave LV pressure >LA pressure (10-15mm Hg) Followed approx. 50msec by M1. Delay of M1 – inertia of the blood flow – valve is kept open. Isovolumic contraction as volume is fixed. Increased pressure as more fibers enter contractile state. LV pressure >Aorta – Aortic valve opens – silent event clinically.
  • 8.
    LV RELAXATION Isovolumic relaxation(e) Startof relaxation in reduced ejection (d) Rapid phase(f) Slow filling (diastasis)(g) Atrial systole or booster LV RELAXATION
  • 9.
    Rapid filling phase– active diastolic relaxation of LV. • LA- LV pressures equalize - diastasis. • LA booster atrial systole – important in exercise and LVH. • First phase of diastole –isovolumic phase – no ventricular filling. Most of ventricular filling 80% –rapid filling phase. Diastasis -5% Final atrial booster phase -15%. The sucking effect of ventricle – myosin is pulled into the space between the two anchoring segments of titin. Dominant backward pressure wave –diastolic coronary filling. LV filling
  • 10.
    • Wall stressat the end of diastole – maximum resting length of sarcomere. • Increasing LVEDV increases SV in ejecting beats,increases LV pressure in isovolumic beats. • Modulation of ventricular performance by changes in preload with constant afterload –heterometric autoregulation, operates on a beat –to beat basis Preload
  • 11.
    Exact definition –wall stress during LV ejection. Tension in the LV wall that resists ventricular ejection or as the arterial input impedance. In clinical practice the arterial blood pressure is often taken as synonymous with afterload while ignoring aortic compliance (increase in stiff aorta). Afterload
  • 12.
    • Frank Starling– venous pressure in RA – heart volume Within physiological limits – the larger the volume of the heart –greater the energy of its contraction – the greater the amount of chemical change at each contraction. LV volume – Cardiac Output Stroke volume related to LVEDV – modern version Real time 3D ECHO – global LV volume,endocardial function LV volume surrogate markers – LVEDP ,PCWP. Frank – greater the initial LV volume – more rapid rate of rise greater the peak pressure reached –faster the rate of relaxation. An important compensatory mechanism that maintains stroke volume ,when there is myocardial dysfunction or excessive afterload. Atria also exhibit frank starling curve – exercise.(resistance to early diastolic filling). Frank Starling mechanism
  • 13.
    Hemodynamic variables •stroke volume-the quantity of blood expelled from the ventricle per beat •cardiac output -multiply stroke volume by heart represents the volume of ejected blood per minute •cardiac index :when you divide cardiac output by body surface area you obtain the cardiac index.
  • 14.
    dP/dt is aparameter of myocardial contractility. Dp/dt represents the ratio of pressure change in the ventricular cavity during the isovolemic contraction period. LV dP/dt is estimated by using time interval between 1 and 3 m/sec on MR velocity spectrum.(because velocities represent pressure gradients -by applying the Bernoulli equation of 4v2). The faster the ventricle is able to build up pressure, the better it functions. As pressure in the left atrium during early systole may be neglected, the MR velocity is the instantaneous systolic pressure in the left ventricle (which resembles systolic blood pressure). Contractility - dP/dt
  • 15.
    It is theinherent capacity of the myocardium to contract independently of changes in the preload and afterload. An increased contractile function –assosciated with greater degree of relaxation – LUSITROPIC effect Important regulator of My02 uptake Increased contractile function by exercise,adrenergic stimulation,digitalis,other inotropic agents Contractility
  • 16.
    The term complianceis used to describe how easily a chamber of the heart or the lumen of a blood vessel expands when it is filled with a volume of blood. Physically, compliance (C) is defined as the change in volume (ΔV) divided by the change in pressure (ΔP). C = ΔV / ΔP compliance The slope of the curve at any given pressure and volume (dV/dP) represents the compliance of the vessel at that pressure and volume. at higher volumes and pressures there is a larger change in pressure for a given change in volume. Another way to think of this is that the "stiffness" of the vessel wall (reciprocal of compliance) increases at higher volumes and pressures. This non-linearity in the relationship between volume and pressure is common in biological tissues.
  • 17.
    Compliance is a fundamentalproperty of a tissue; however, the compliance can be modified by histological changes in the tissue. This occurs, for example, when a heart structurally remodels in response to chronic volume or pressure overload conditions. In a blood vessel, compliance can also be altered by contraction of smooth muscle in the vessel wall, which decreases the compliance of the vessel. compliance
  • 19.
    The compliance ofthe ventricle is determined by the structural properties of the cardiac muscle (e.g., muscle fibers and their orientation, and connective tissue) as well as by the state of ventricular contraction and relaxation. For example, in ventricular hypertrophy the ventricular compliance is decreased (i.e., the ventricle is "stiffer") because the thickness of the ventricular wall increases; therefore, ventricular end-diastolic pressure (EDP) is higher at any given end- diastolic volume (EDV) compliance
  • 20.
    The Tei index: myocardial performance index (MPI) It is a parameter for global ventricular performance. The Tei index consists of 3 variables which are derived from Doppler spectrum. The formula is: MPI = (IVCT + IVRT) / ET When systolic dysfunction is present in patients IVCT will increase and ET decrease. Normal range is considered at 0,39+/-0,05. An MPI over 0,5 is considered abnormal. Tei index / Myocardial performance index
  • 21.
    Fractional shortning • percentageof "size reduction" of the left ventricle :is fractional shortening •does not express ejection fraction because we are not computing volumes formula: (LVEDD - LVESD / LVEDD) x 100
  • 22.
    Fractional shortning • fractionalshortening has limited application, cannot be used in all patients, and only provides a rough approximation of left ventricular function. • Limitations- • LBBB / Dyssynchrony • Regional wall motion abnormalities • Poor image quality • Abnormal septal motion • Inadequate MMode orientation
  • 23.
    Ejection fraction • Ejectionfraction (EF) refers to how well your left ventricle (or right ventricle) pumps blood with each heart beat. • It is the ratio of blood ejected during systole (stroke volume) to blood in the ventricle at the end of diastole (end-diastolic volume). • LVEF = stroke volume (EDV - ESV) ÷ EDV
  • 24.
    In patients inwhom satisfactory biplane cineangiograms were obtained, three indices were determined: a) ejection fraction b) two normalized velocity measurements: 1. mean velocity of circumferential fiber shortening (mVcf) 2. mean systolic ejection rate.( mSER) Ejection fraction (EF) was calculated as the difference between left ventricular end- diastolic and end-systolic volumes, divided by end-diastolic volume. Mean velocity of circumferential fiber shortening (mVcf) was calculated as the difference between the minor axis of the left ventricle (L2) in end diastole and end systole, divided by L2 in end diastole, divided by ejection time. L2 was calculated from the area of the frontal projection (AF) and the long axis (LJ) by the formula: L2 = 4AF/rL,. Values were expressed in circumferences/second. Mean systolic ejection rate (mSER) was calculated as the difference between end- diastolic and end systolic left ventricular volumes, divided by end diastolic volume, divided by ejection time; or as ejection fraction divided by ejection time. Values were expressed in volumes/second. Old indices on biplane cineangiography
  • 26.
    200 100 0 0 100 200 LVpressure(mmHg) LVvolume (ml) AoV closes AoV opens MV closes MV opens ESPVR EDPVR VENTRICULAR PRESSURE VOLUME LOOP No time representation PRESSURE & VOLUME MEASUREMENT Conductance catheter Volume by echo Pressure by high fidelity manometer APPLICATION Clinical tool;
  • 27.
    • Best ofthe current approaches to the assessment of the contractile behaviour of the intact heart. Es,the pressure – volume relation Changes in the slope of this line joining the different Es points are generally good load independent index of the contractile performance of the heart. Enhanced inotropic effect, Es shifted upward and to the left. Lusitropic effect shifted Es downward and to right. The P-V relationship is linear in smooth muscle,curvilinear in cardiac muscle(exponential). Pressure volume loop
  • 28.
  • 29.
    VENTRICULAR PRESSURE VOLUMELOOP INCA PV LOOP SYSTEM CD LEYCOM CONDUCTANCE CATHETER
  • 30.
    DETERMINANTS OF VENTRICULARFUNCTION Preload: wall tension at the end of diastole; clinical index: end diastolic volume or end diastolic pressure Afterload: the load against which the ventricle ejects clinical index: Aortic pressure (in the absence of LVOT obstruction) or precisely wall stress Contractility: the intrinsic ability of a cardiac muscle fibre to contract at a given fibre length. Heart rate
  • 31.
    BASIC PHYSIOLOGIC CONCEPTS 1.FRANK-STARLINGCURVE (VENTRICULAR FUNCTION CURVE) 2. FORCE – VELOCITY RELATIONSHIP 3. DIASTOLIC PRESSURE VOLUME RELATIONSHIP 4. SYSTOLIC PRESSURE VOLUME RELATIONSHIP
  • 32.
    FRANK-STARLING CURVE A B INCREASED VENOUS RETURN 100 50 0 010 20 SV (ml) LVEDP (mmHg) 100 50 0 0 10 20 SV (ml) DECREASED VENOUS RETURN C normal ‘Stroke volume increases proportionately with preload within physiologic limits’
  • 33.
    100 50 0 0 10 20 SV (ml) LVEDP(mmHg) 100 50 0 0 10 20 SV (ml) FAMILY OF FRANK STARLING CURVES  Afterload  Inotropy  Afterload  Inotropy ‘Increased afterload and decreased inotropy shifts the curve downward – SV decreases’ ‘Decreased afterload and increased inotropy shifts the curve upwards – SV increases’
  • 34.
    INOTROPY & FORCEVELOCITY RELATIONSHIP Afterload (force) Shorteningvelocity Normal Decreased inotropy Increased inotropy As afterload increases; shortening velocity decreases -- SV decreases; As afterload decreases, shortening velocity increases – SV increases; At a given afterload; increasing inotropy increases shortening velocity;
  • 35.
    Shorteningvelocity Afterload (Force) Increasing preloada c a b c PRELOAD & FORCE VELOCITY RELATIONSHIP As afterload increases; shortening velocity decreases -- SV decreases; As afterload decreases, shortening velocity increases – SV increases; At a given afterload; increasing preload increases shortening velocity;
  • 36.
    EDV 0 100 200 EDP LVpressure(mmHg) 100 50 0 Decreased compliance normal VENTRICULARCOMPLIANCE CURVE Increased compliance DIASTOLIC PRESSURE VOLUME RELATIONSHIP ‘Slope of the curve is stiffness dP/dV; Compliance is the inverse of the slope dV/dP’ ‘As compliance decreases; filling pressure increases’
  • 37.
    200 100 0 0 100 200 LVpressure(mmHg) LVvolume (ml) ESPVR EDPVR END SYSTOLIC PRESSURE VOLUME RELATIONSHIP normal  inotropy  inotropy
  • 38.
    200 100 0 0 100 200 LVpressure(mmHg) LVvolume (ml) AoV closes AoV opens MV closes MV opens 4 1 2 3 a b c d 1 = MV closing point 2 = AV opening point 3 = AV closing point 4 = MV opening point a = Diastole b = Isovolumic contraction c = Systole d = Isovolumic relaxation GENERATION OF PRESSURE VOLUME LOOP stroke volume
  • 39.
    NORMAL PRESSURE VOLUMELOOP 200 100 0 0 100 200 LVpressure(mmHg) LV volume (ml) AoV closes AoV opens MV closes MV opens ESPVR EDPVR systole diastole IVC IVR Normal IVR & IVC Abnormal IVR & IVC
  • 40.
    CHANGES IN PRELOADAND STROKE VOLUME LV volume (ml) LVpressure(mmHg) 200 100 0 0 100 200 ESV EDV LV volume (ml) LVpressure(mmHg) 200 100 0 0 100 200 ESV EDV INCREASED PRELOAD DECREASED PRELOADINCREASED PRELOAD DECREASED PRELOAD EDV increases; Cardiac output increases; Afterload minimally increases: Net effect : SV increases EDV decreases; Cardiac output decreases; Afterload minimally decreases Net effect : SV decreases
  • 41.
    CHANGES IN AFTERLOADAND STROKE VOLUME LV volume (ml) LVpressure(mmHg) 200 100 0 0 100 200 ESV EDV LV volume (ml) LVpressure(mmHg) 200 100 0 0 100 200 ESV EDV INCREASED AFTERLOAD DECREASED AFTERLOADINCREASED AFTERLOAD DECREASED AFTERLOAD ESV increases; Cardiac output decreases; Preload minimally increases: Net effect : SV decreases ESV decreases; Cardiac output increases; Preload minimally decreases: Net effect : SV increases
  • 42.
    CHANGES IN INOTROPYAND STROKE VOLUME LV volume (ml) LVpressure(mmHg) 200 100 0 0 100 200 ESV EDV LV volume (ml) LVpressure(mmHg) 200 100 0 0 100 200 ESV EDV INCREASED INOTROPY DECREASED INOTROPY ESV increases; SV decreases EDV increases minimally ESV decreases; SV increases EDV decreases minimally
  • 43.
    PRELOAD, AFTER LOAD& STROKE VOLUME PRELOAD = END DIASTOLIC VOLUME Increasing Preload Increases End Diastolic Volume ‘Stroke volume is directly proportional to end diastolic volume’ AFTERLOAD ~ END SYSTOLIC VOLUME Increasing Afterload Increases End Systolic Volume ‘Stroke volume is inversely related to after load’ INOTROPIC STATE IS RELATED TO END SYSTOLIC VOLUME Increasing Inotropy Decreases End Systolic Volume ‘Stroke volume is directly proportional to inotropic state’
  • 44.
    ABNORMAL PRESSURE VOLUMELOOP 200 100 0 0 100 200 LVpressure(mmHg) LV volume (ml) AoV closes AoV opens MV closes MV opens ESPVR EDPVR Identified by • Change in EDPVR & EDP • Change in ESPVR & pressure at which AoV closes • Change in Stroke volume • Curved IVC & IVR line • Overall shape of PV loop systole diastole IVC IVR
  • 45.
    SYSTOLIC DYSFUNCTION LV volume(ml) LVpressure(mmHg) 200 100 0 0 100 200 ESV EDV NORMAL SYSTOLIC DYSFUNCTION Strokevolume(ml) LV EDP (mm Hg) 0 10 20 30 100 50 0 loss of inotropy VASODILATORS Loss of inotropy shifts ESPVR downwards; ESV increases, Compensatory increase in EDV to some extent; However SV decreases. Frank Starling curve : shifts downwards; EDP increases. SV falls; With vasodilator therapy, afterload & preload decrease; EDP is reduced, SV increases
  • 46.
    DIASTOLIC DYSFUNCTION LV volume(ml) LVpressure(mmHg) 200 100 0 0 100 200 ESV EDVEDV 0 100 200 EDP LVpressure(mmHg) 100 50 0 Decreased compliance normal LV volume (ml) eg. LVH; compliance curve shifts up. EDP increases and SV decreases. Careful use of diuretics will be of use; because some degree of raised venous pressure is necessary to fill less compliant ventricle.
  • 47.
    LV volume (ml) LVpressure(mmHg) 200 100 0 0100 200 ESV EDV MITRAL STENOSIS Decrease in EDV since there is reduced filling. SV decreases, fall in CO and Aortic pressure. Afterload is decreased so ESV also decreases to some extent, not enough to overcome decrease in EDV.
  • 48.
    LV volume (ml) LVpressure(mmHg) 200 100 0 0100 200 ESV EDV AORTIC STENOSIS Afterload is very much increased, so ESV increases and SV decreases As ESV increases, residual volume is added to venous return, so EDV increases. Increased preload increases force of contraction and maintains SV to some extent esp. in mild aortic stenosis. Diuretics are deleterious in this situation
  • 49.
    LV volume (ml) LVpressure(mmHg) 200 100 0 0100 200 ESV EDV CHRONIC AORTIC REGURGITATION No true Isovolumic contraction and relaxation EDV increases greatly. This increases Stroke volume and cardiac output. Afterload increases hence ESV also increases to some extent. Once systolic dysfunction sets in, ESV increases progressively and peak systolic pressure & SV fall
  • 50.
    LV volume (ml) LVpressure(mmHg) 200 100 0 0100 200 ESV EDV CHRONIC MITRAL REGURGITATION No true isovolumic contraction and relaxation EDV increases Afterload is reduced, so ESV is reduced Net effect = SV increases With systolic dysfunction; ESV increases, forward stroke volume decreases
  • 51.
    ACUTE AORTIC REGURGITATION LVvolume (ml) LVpressure(mmHg) 200 100 0 0 100 200 ESV EDV Ventricular diastolic volume increases suddenly EDV and EDP increases PV loop appears small No true isovolumic relaxation SV falls
  • 52.
    LV volume (ml) LVpressure(mmHg) 200 100 0 0100 200 ESV EDV ACUTE MITRAL REGURGITATION Ventricular volume increases abruptly No true isovolumic contraction EDP rapidly increases PV loop appears small
  • 53.
    CARDIAC TAMPONADE LV volume(ml) LVpressure(mmHg) 200 100 0 0 100 200 ESV EDV Unique PV loop Preload is greatly decreased; EDP is elevated ESV is also decreased Stroke volume is decreased
  • 54.
    TAKE HOME POINTS Pressurevolume loop is an excellent clinical tool to understand pathologic cardiac conditions Interaction between preload, afterload and contractility determines the shape and size of pressure volume loop Increased preload increases end diastolic volume and vice versa Increased afterload increases end systolic volume and vice versa Increased inotropy decreases end systolic volume and vice versa Increased compliance increases end diastolic volume and vice versa Isovolumic contraction line and isovolumic relaxation line are not straight in regurgitant lesions
  • 55.

Editor's Notes