This document discusses various hemodynamic parameters and waveforms seen in different cardiac conditions:
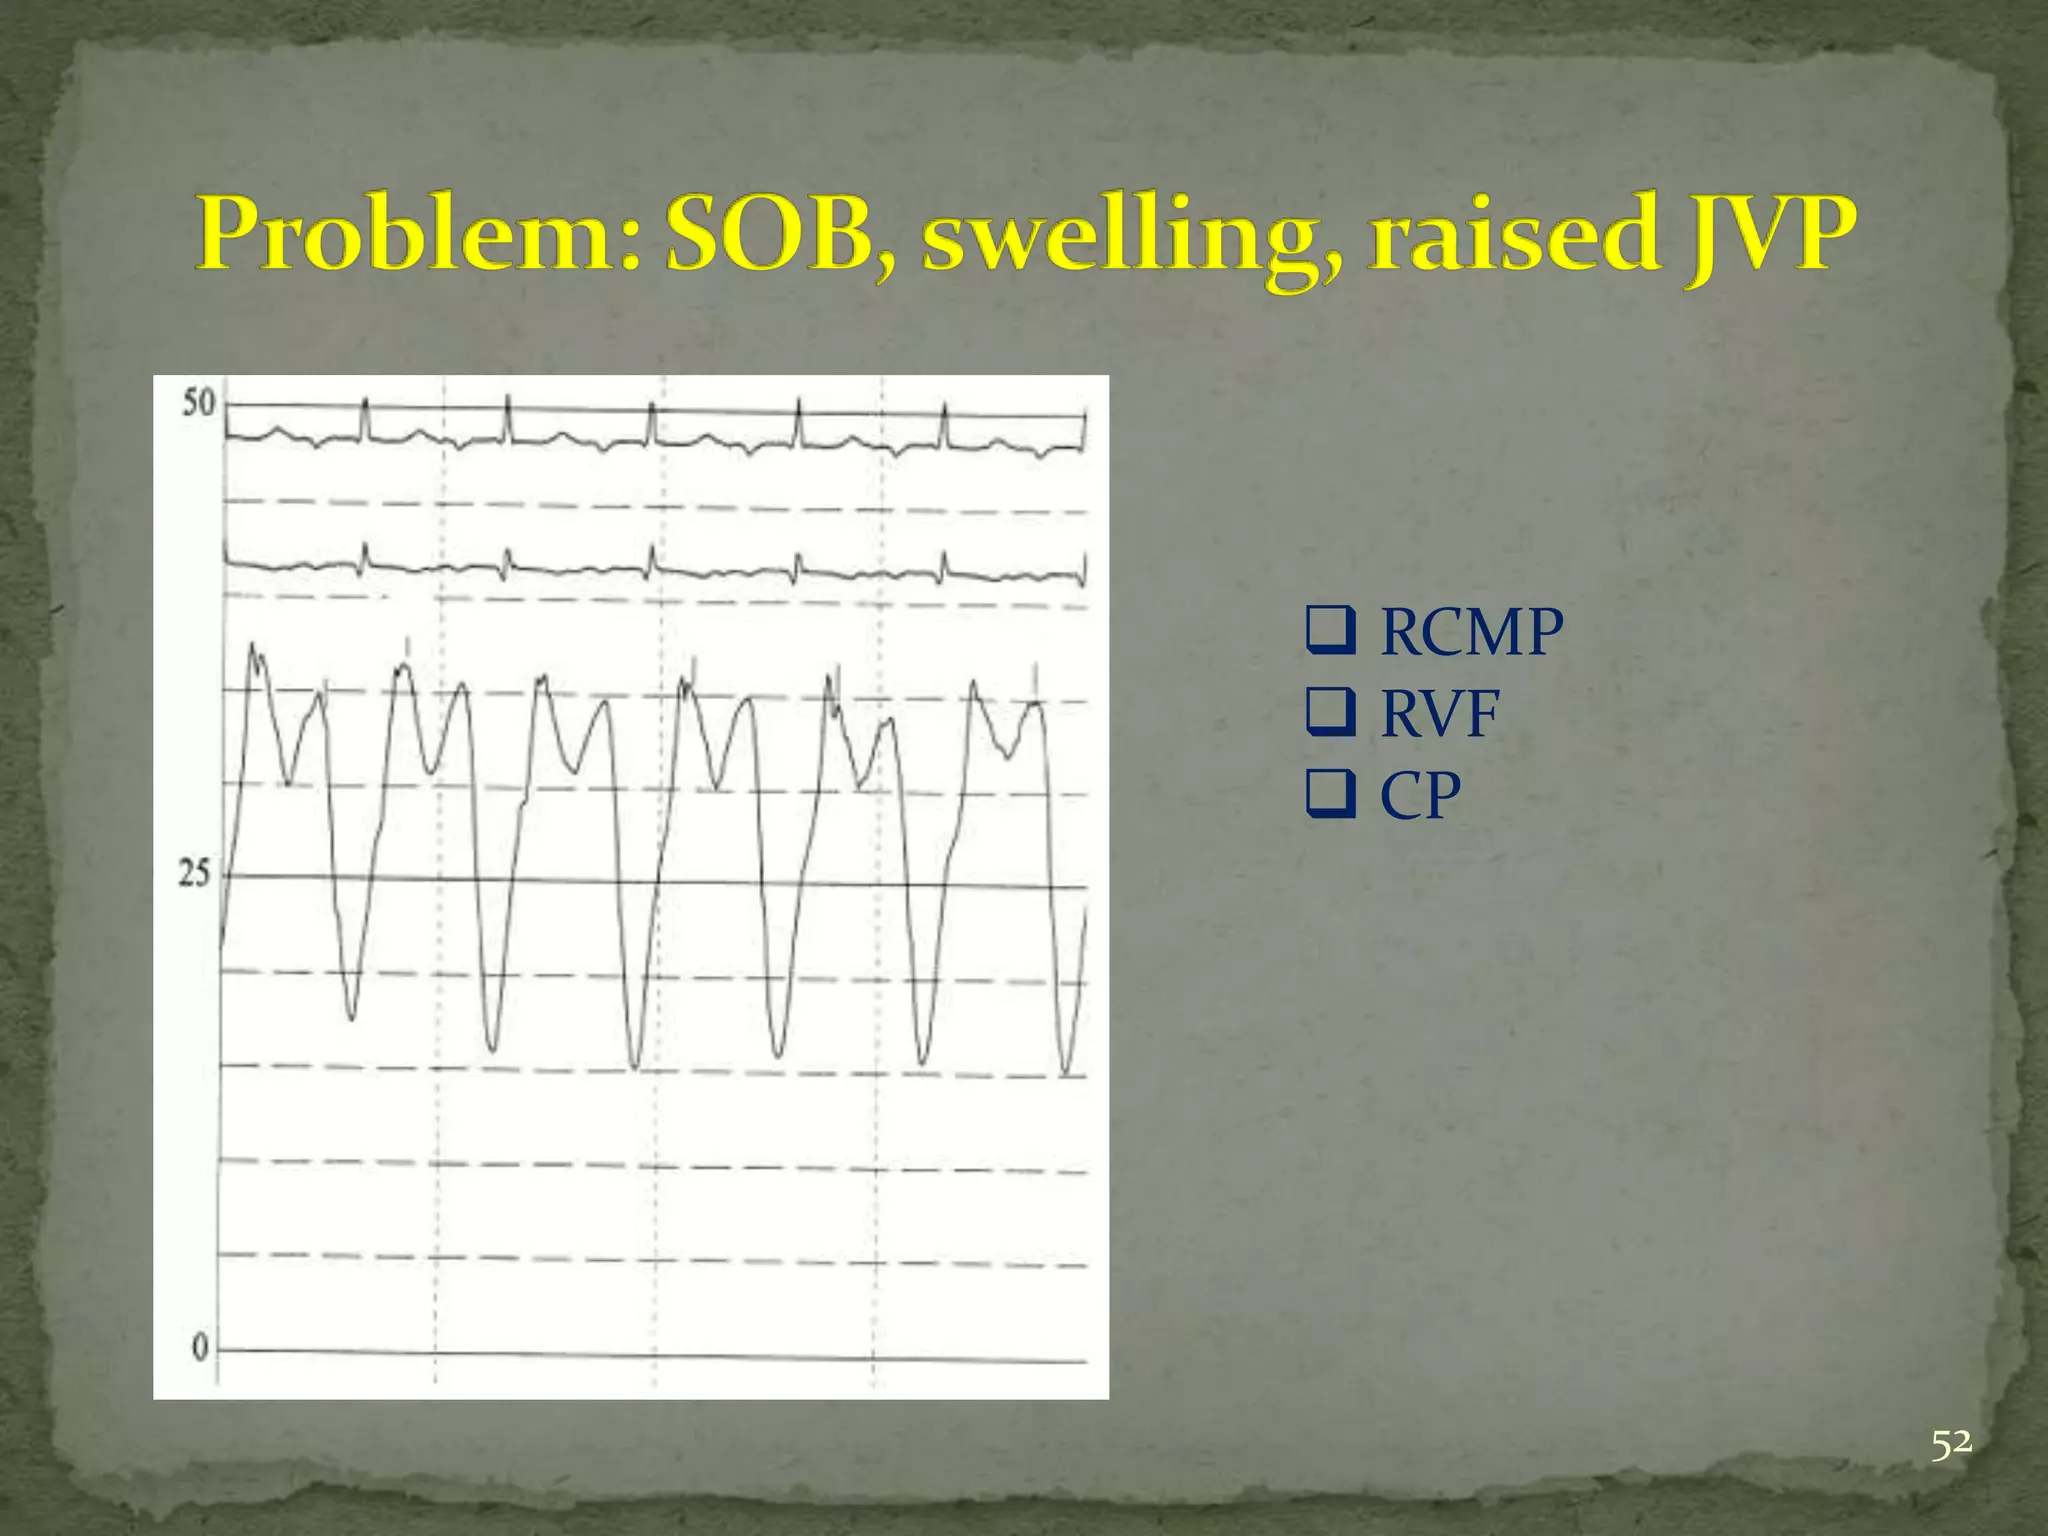
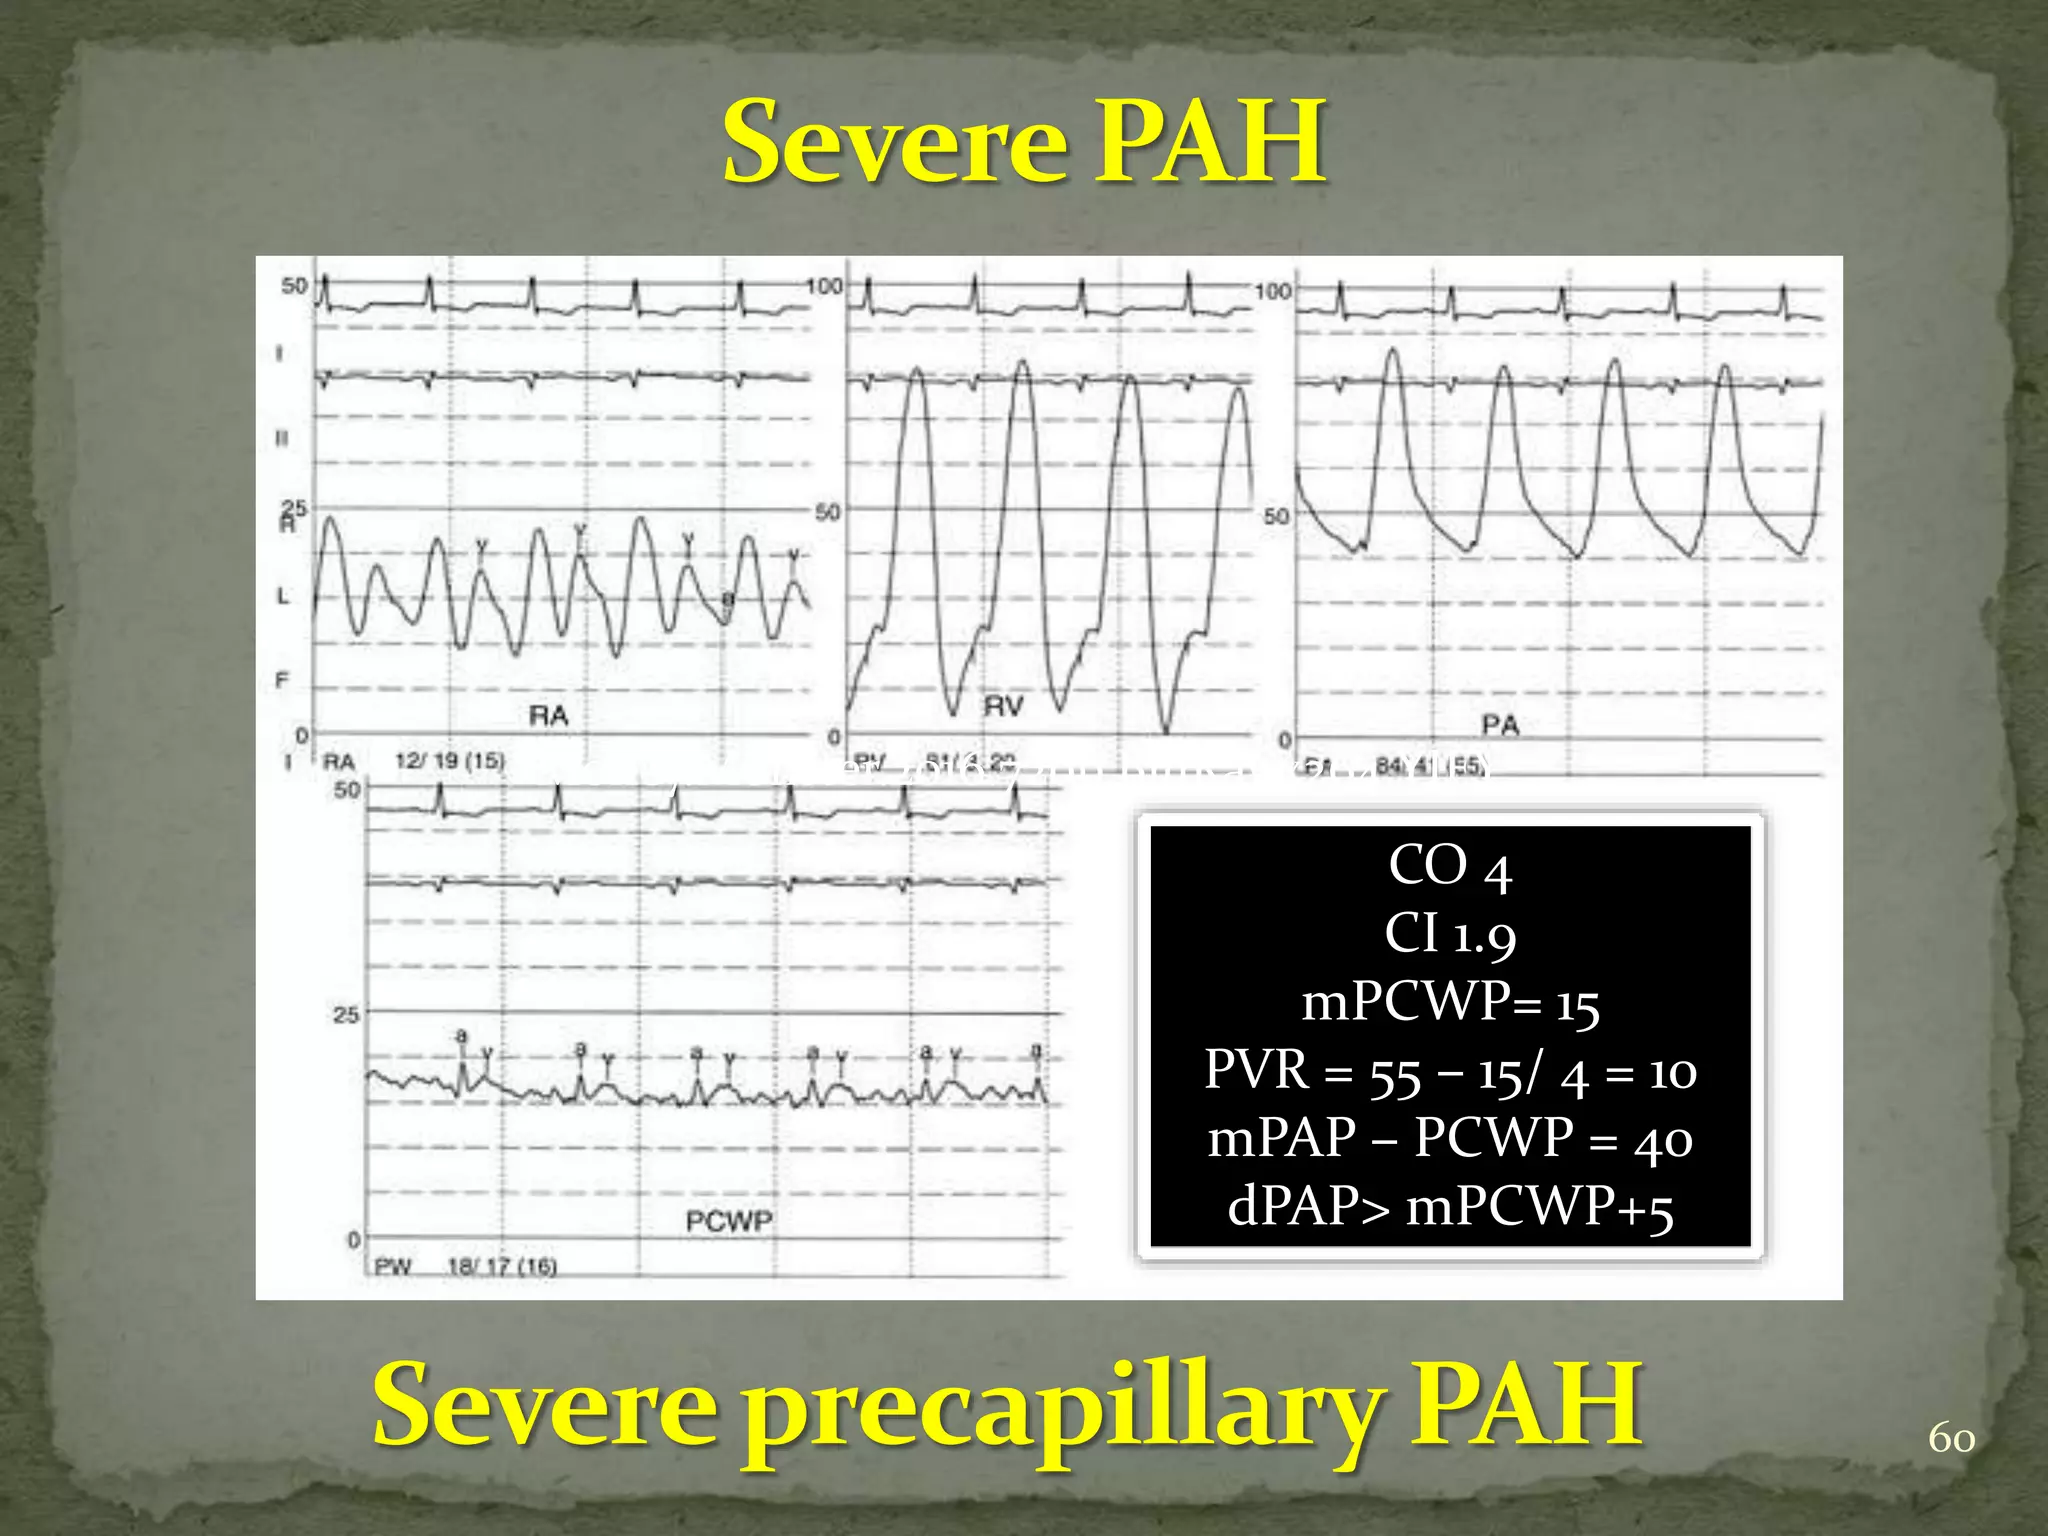
- It compares pressures, waveforms and compliance in conditions like constrictive pericarditis, right ventricular failure, cardiac tamponade and pulmonary hypertension.
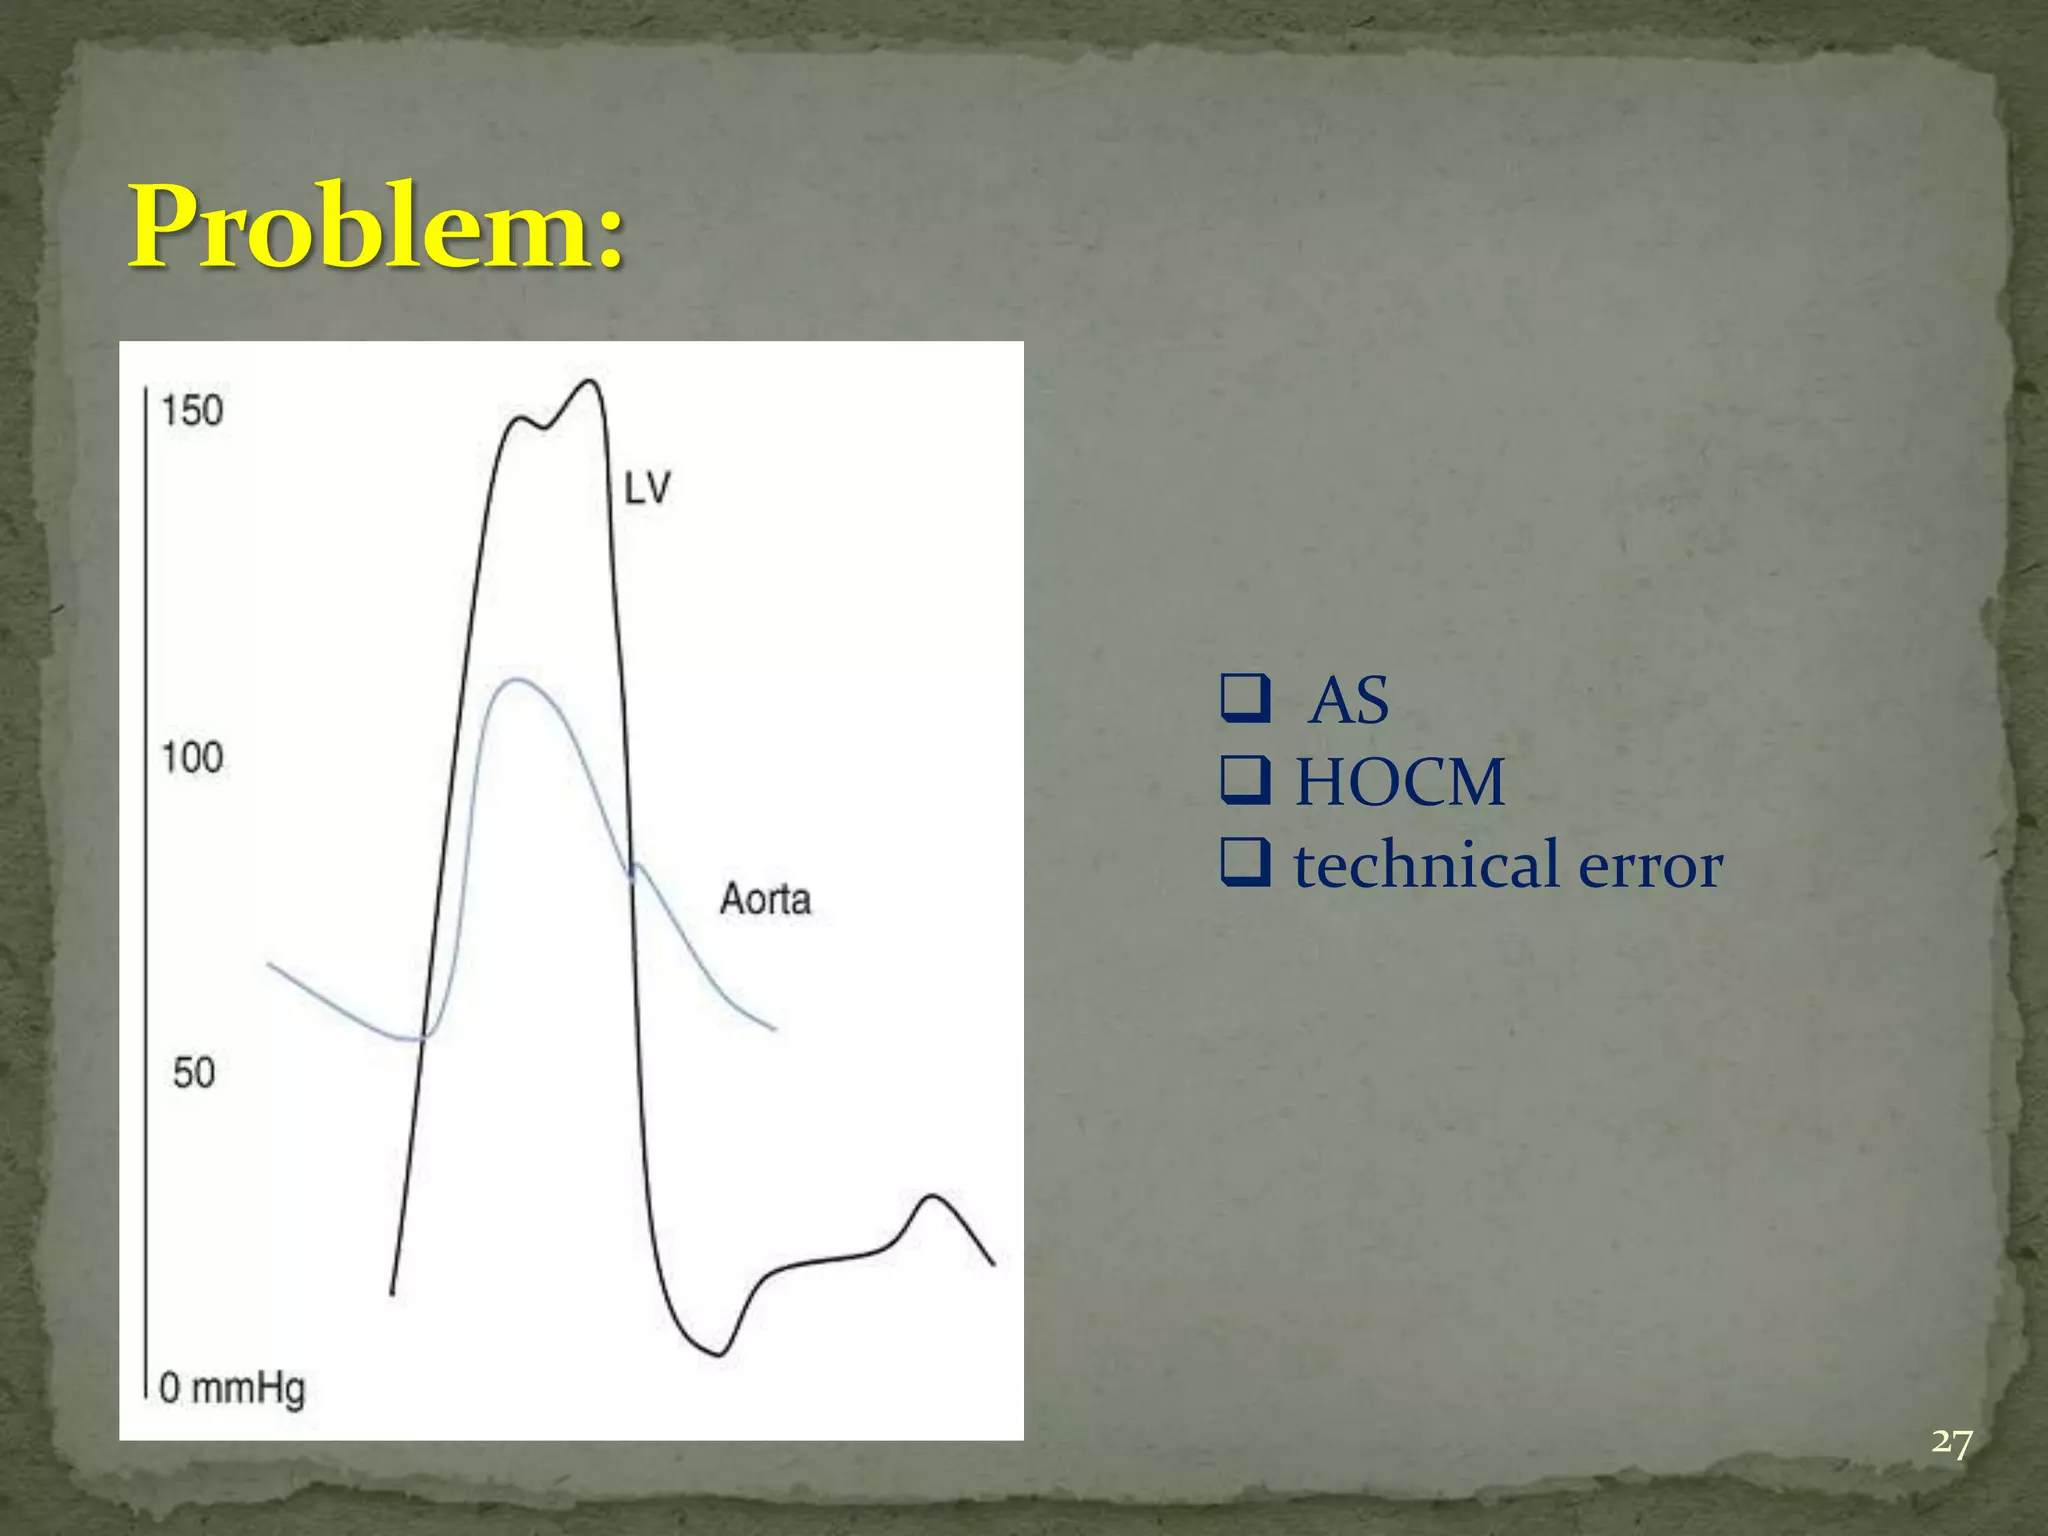
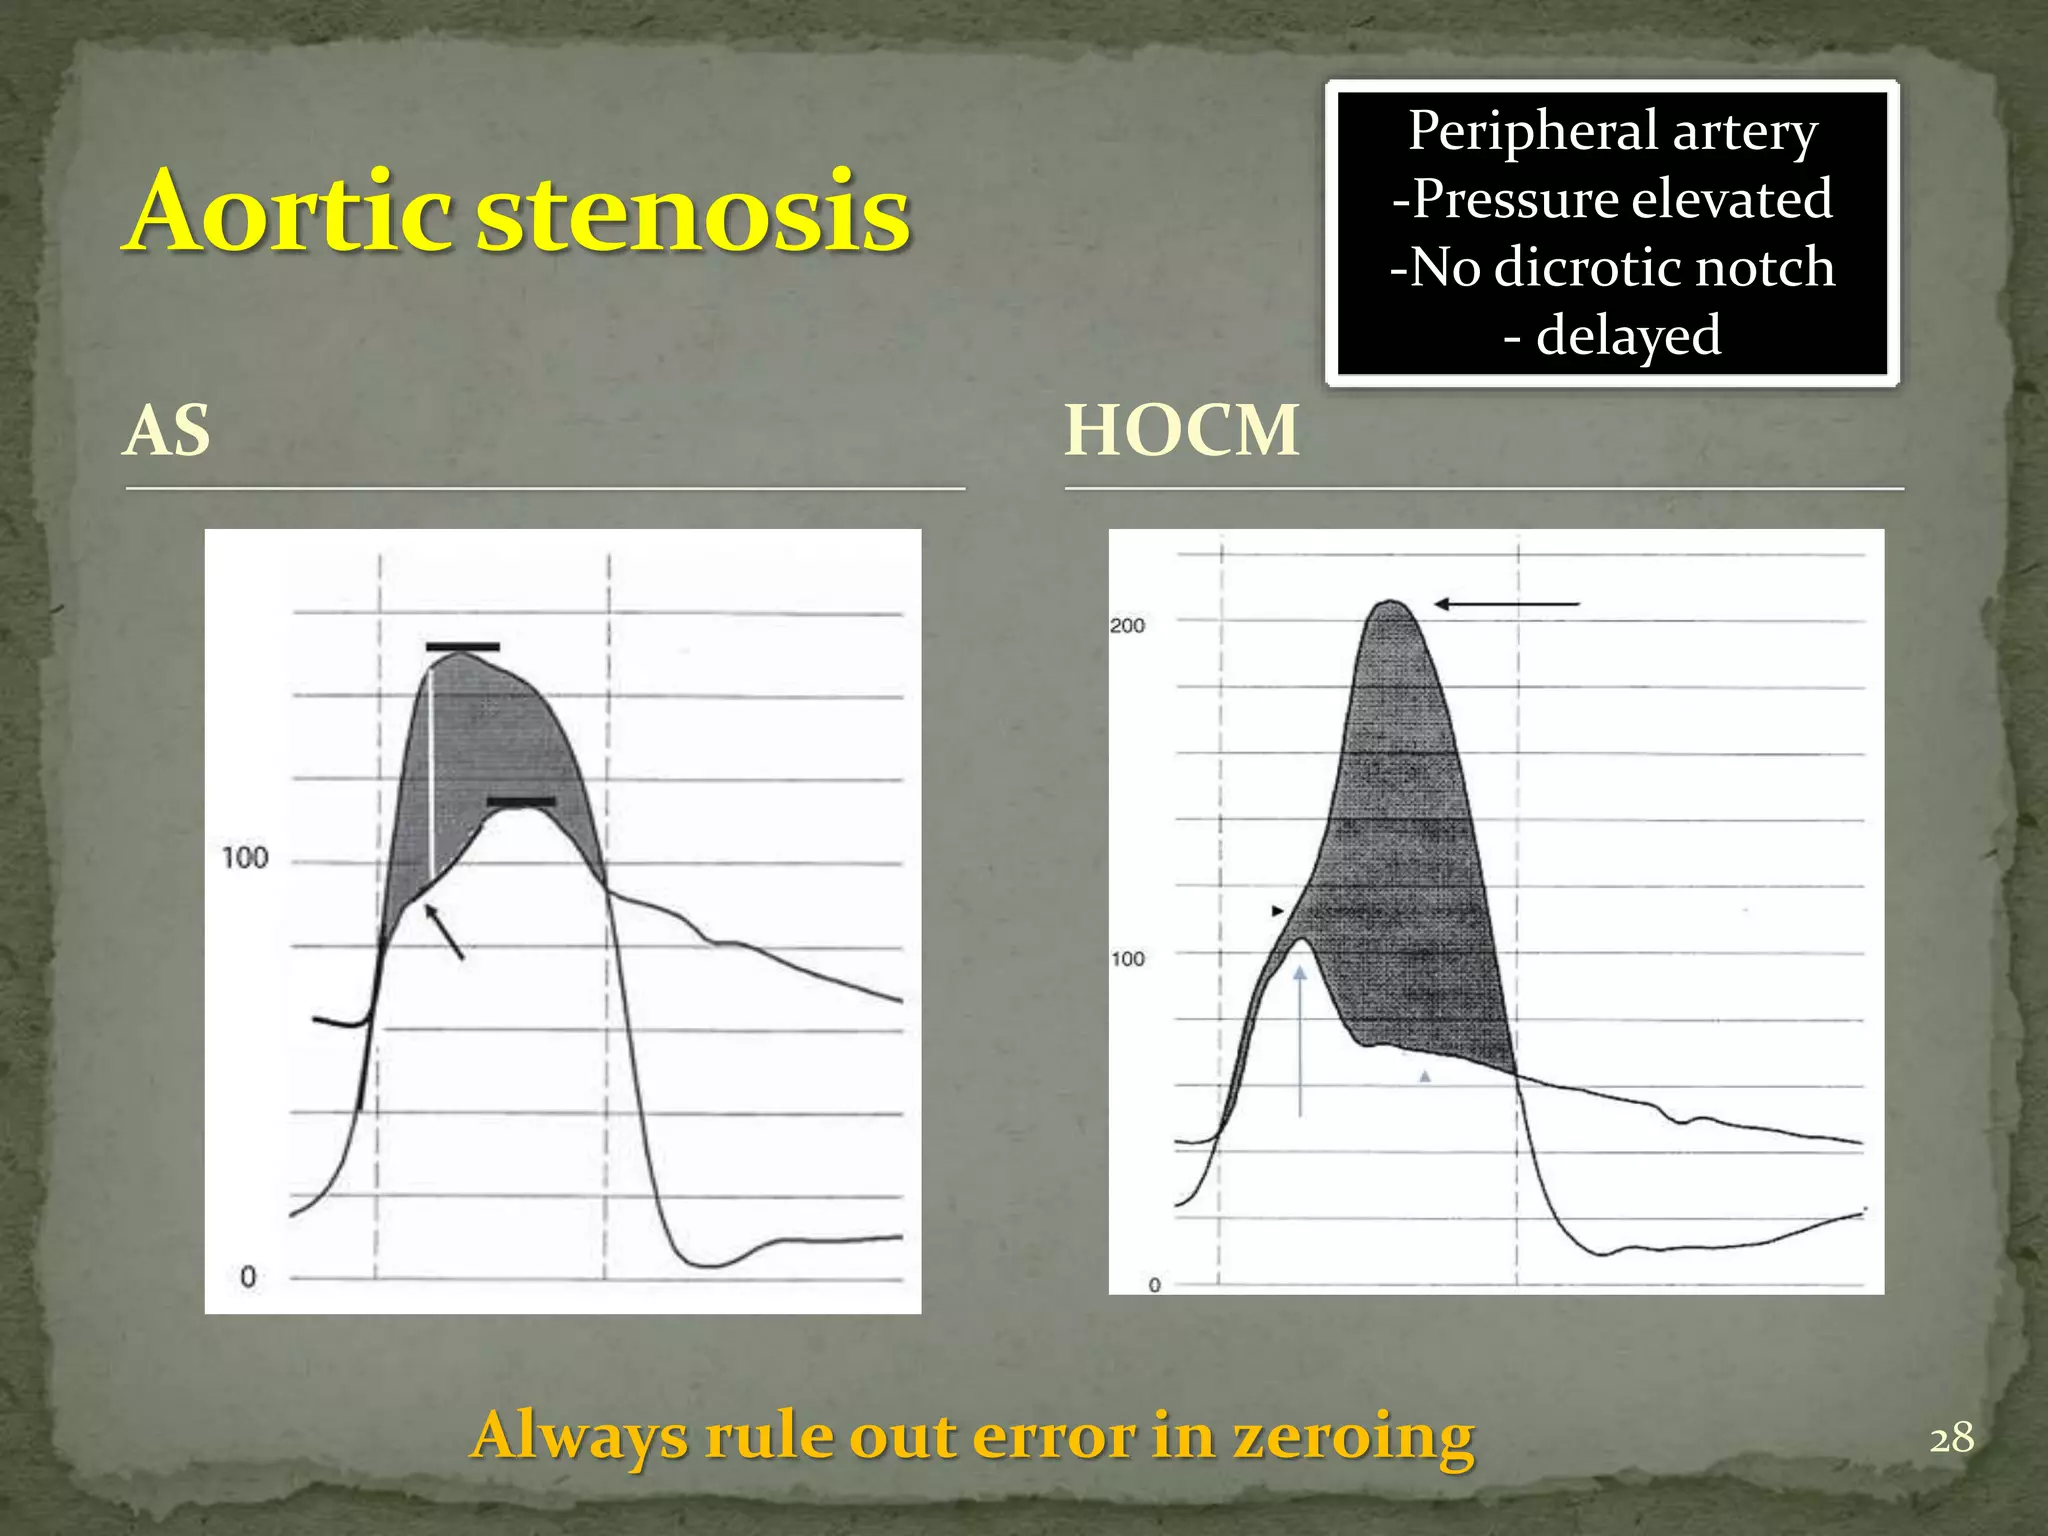
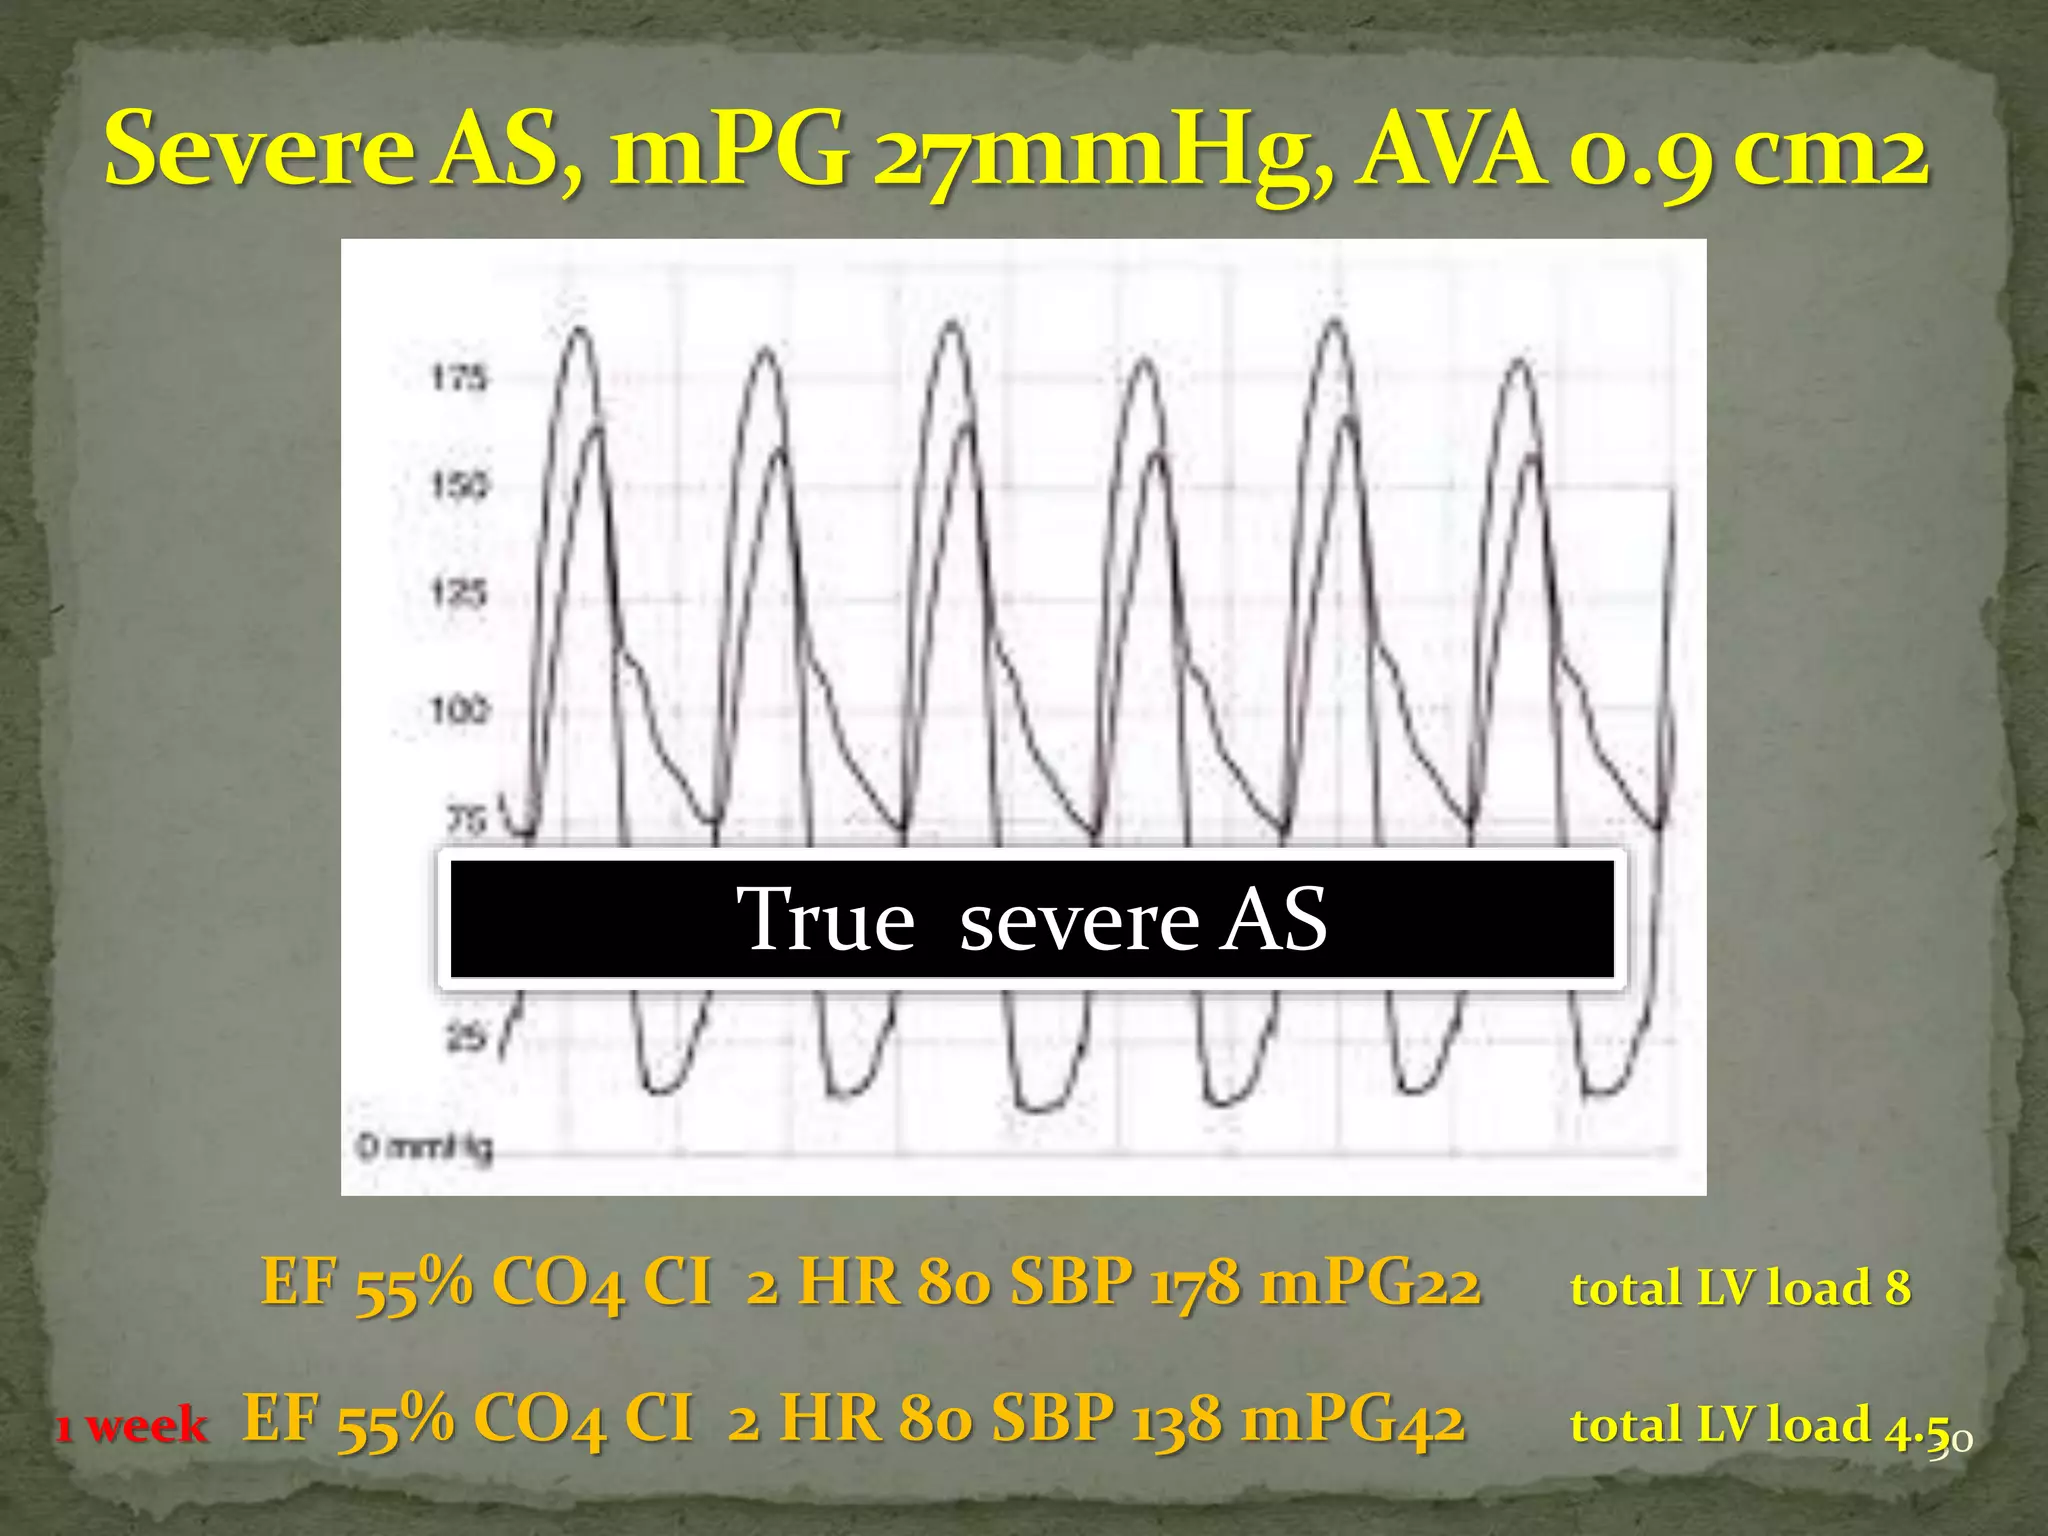
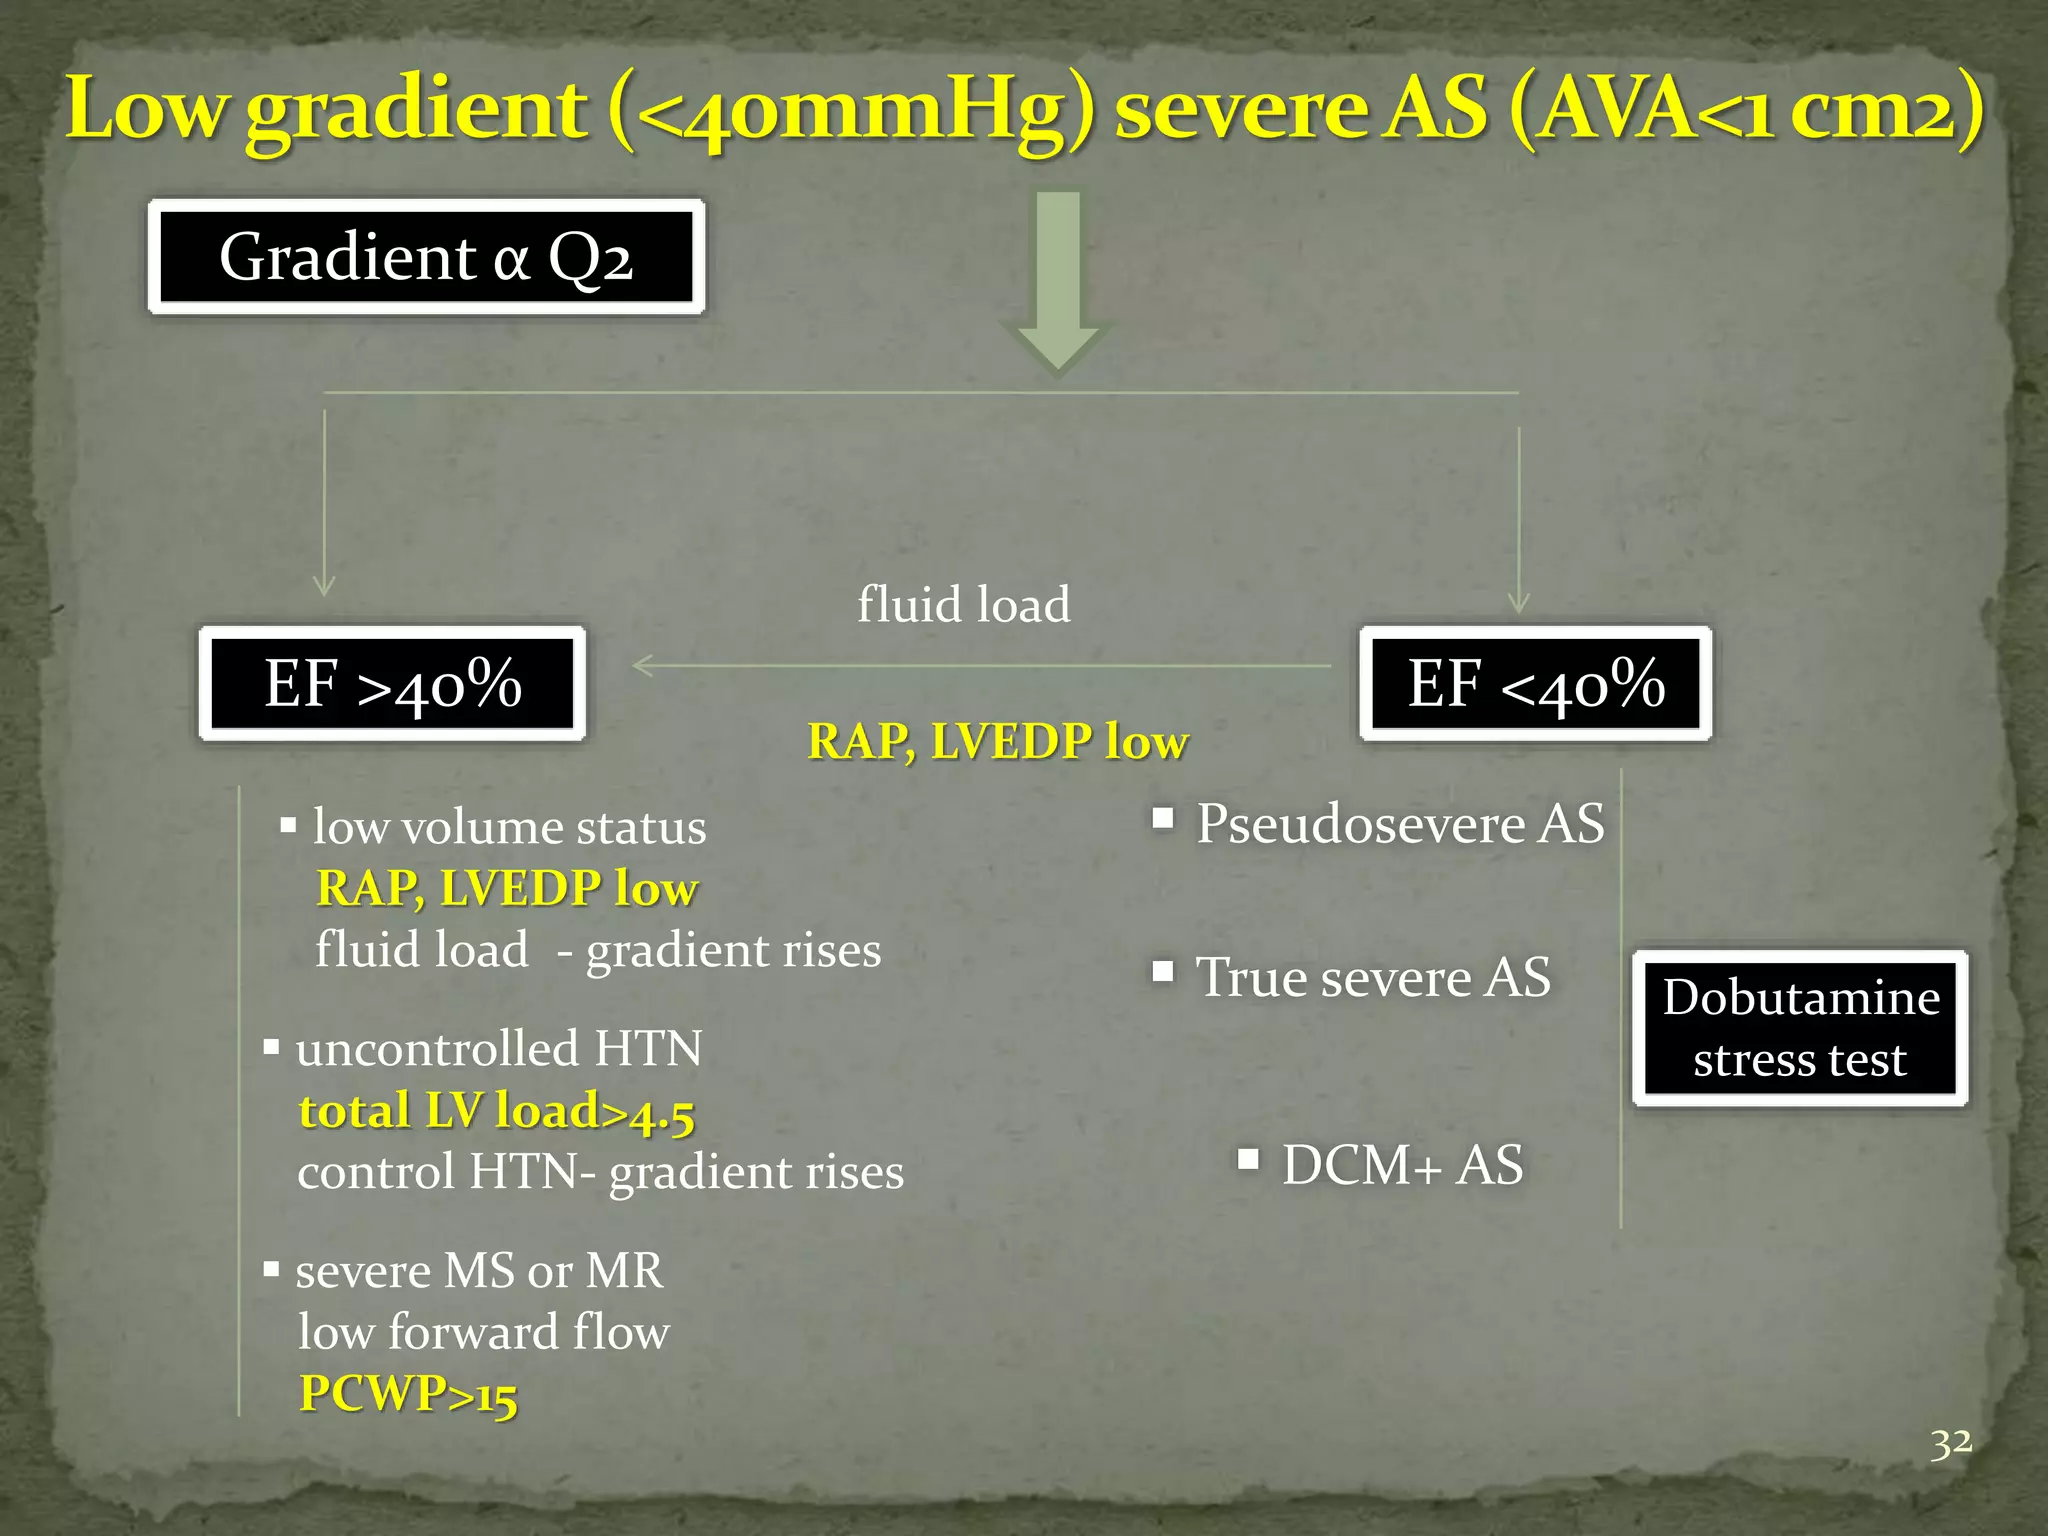
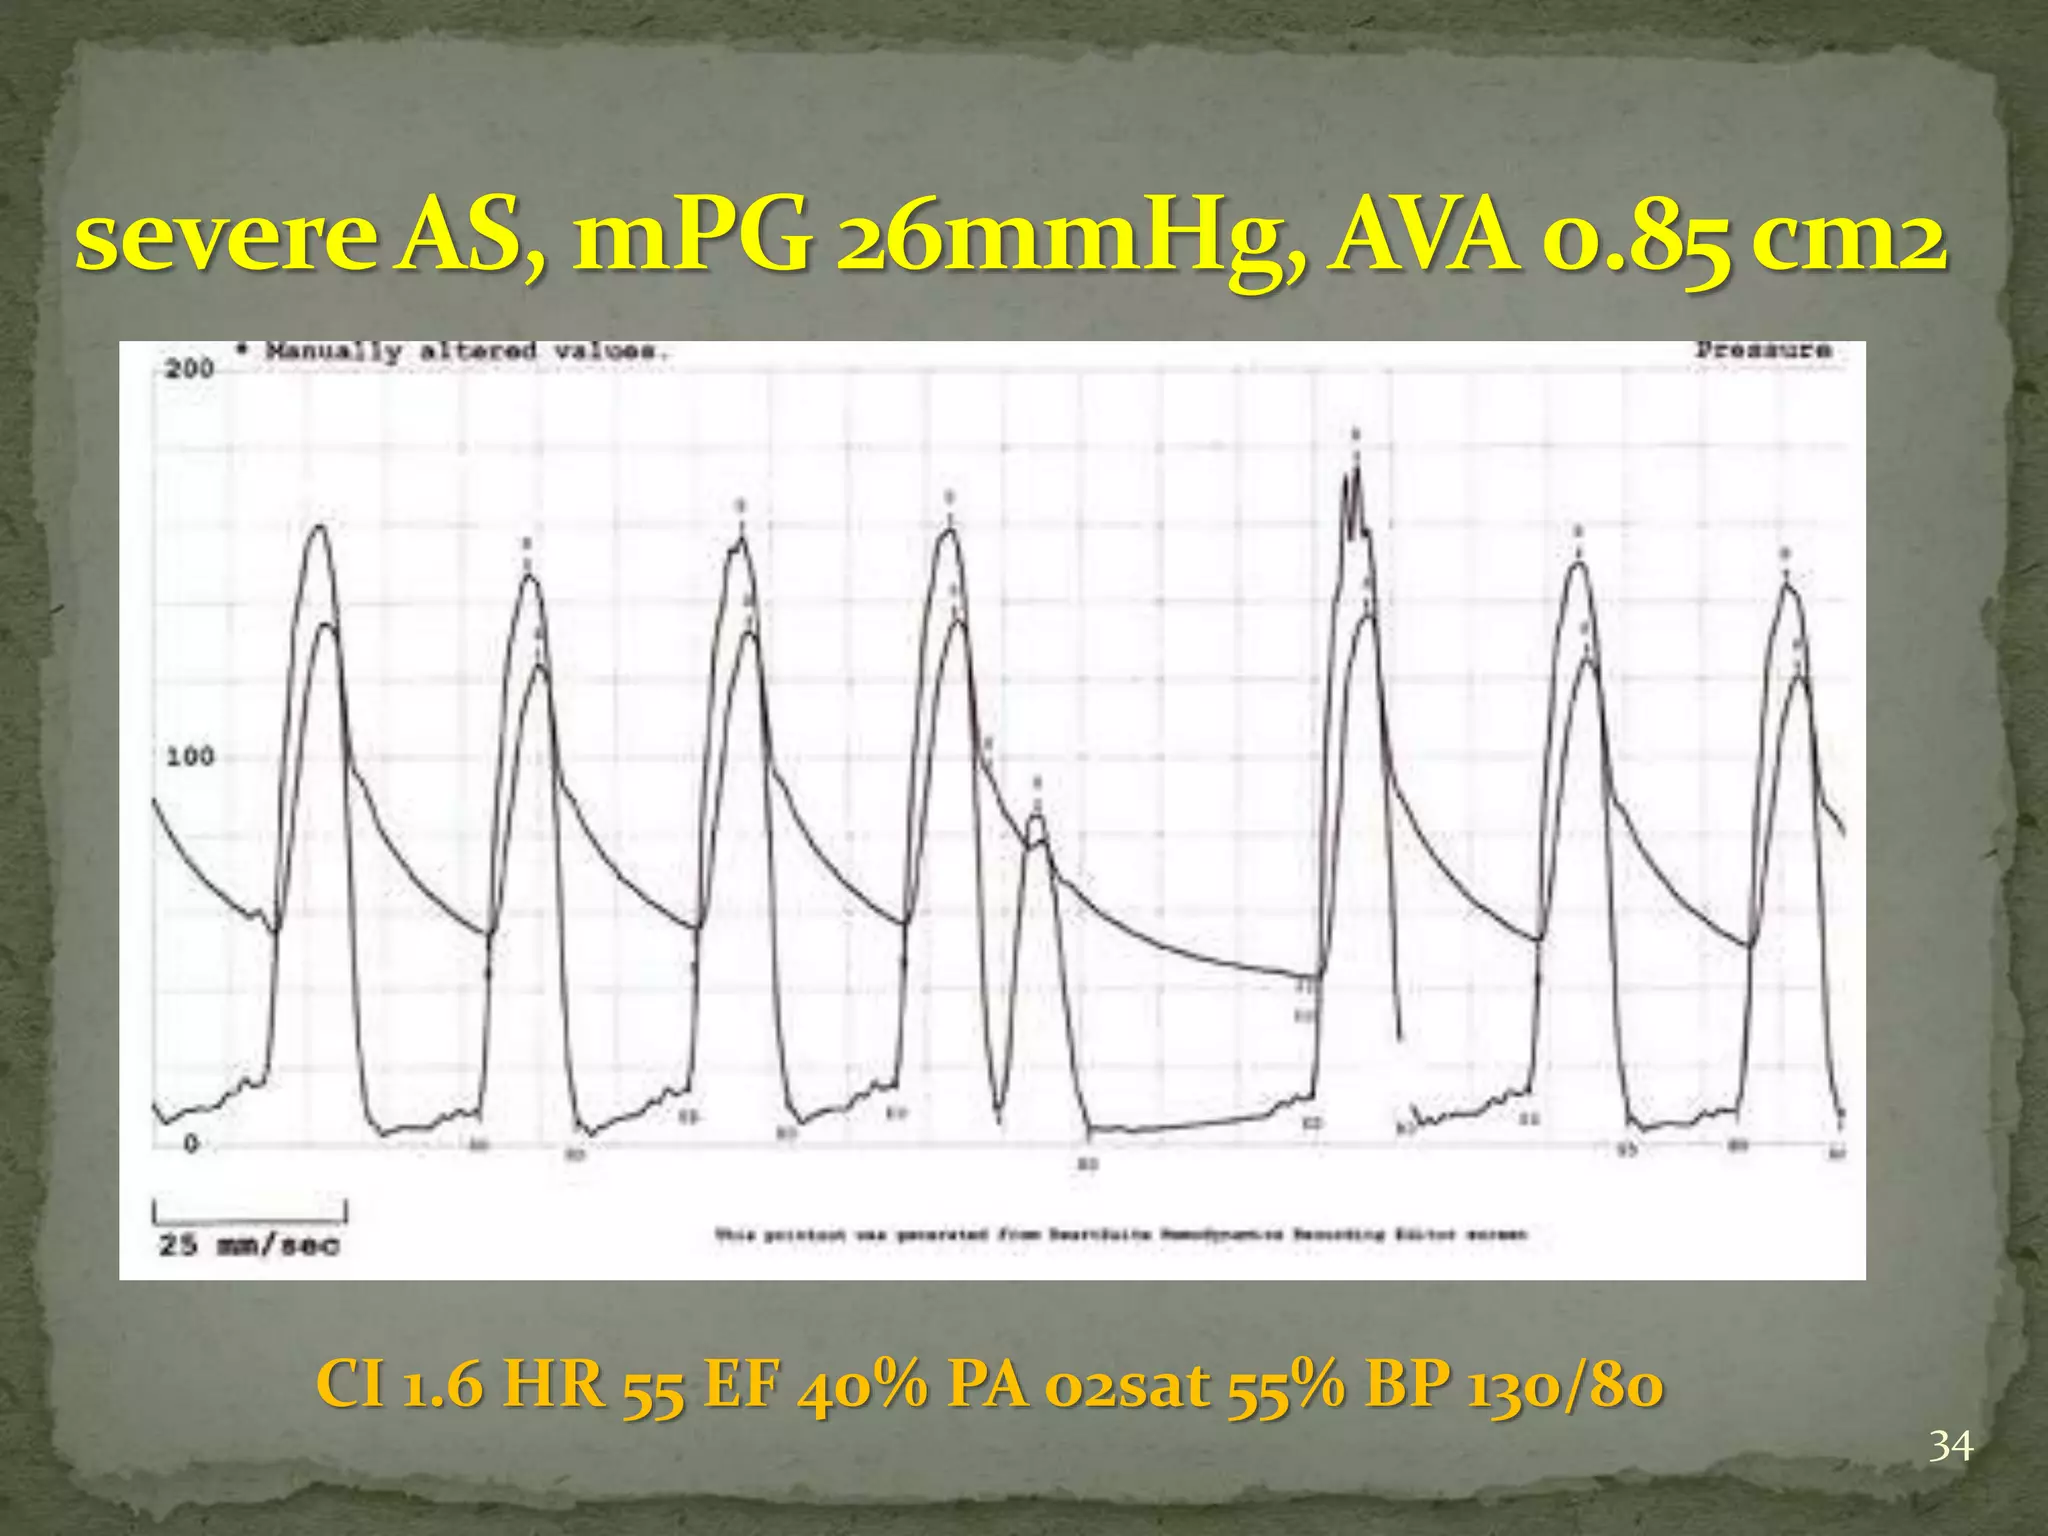
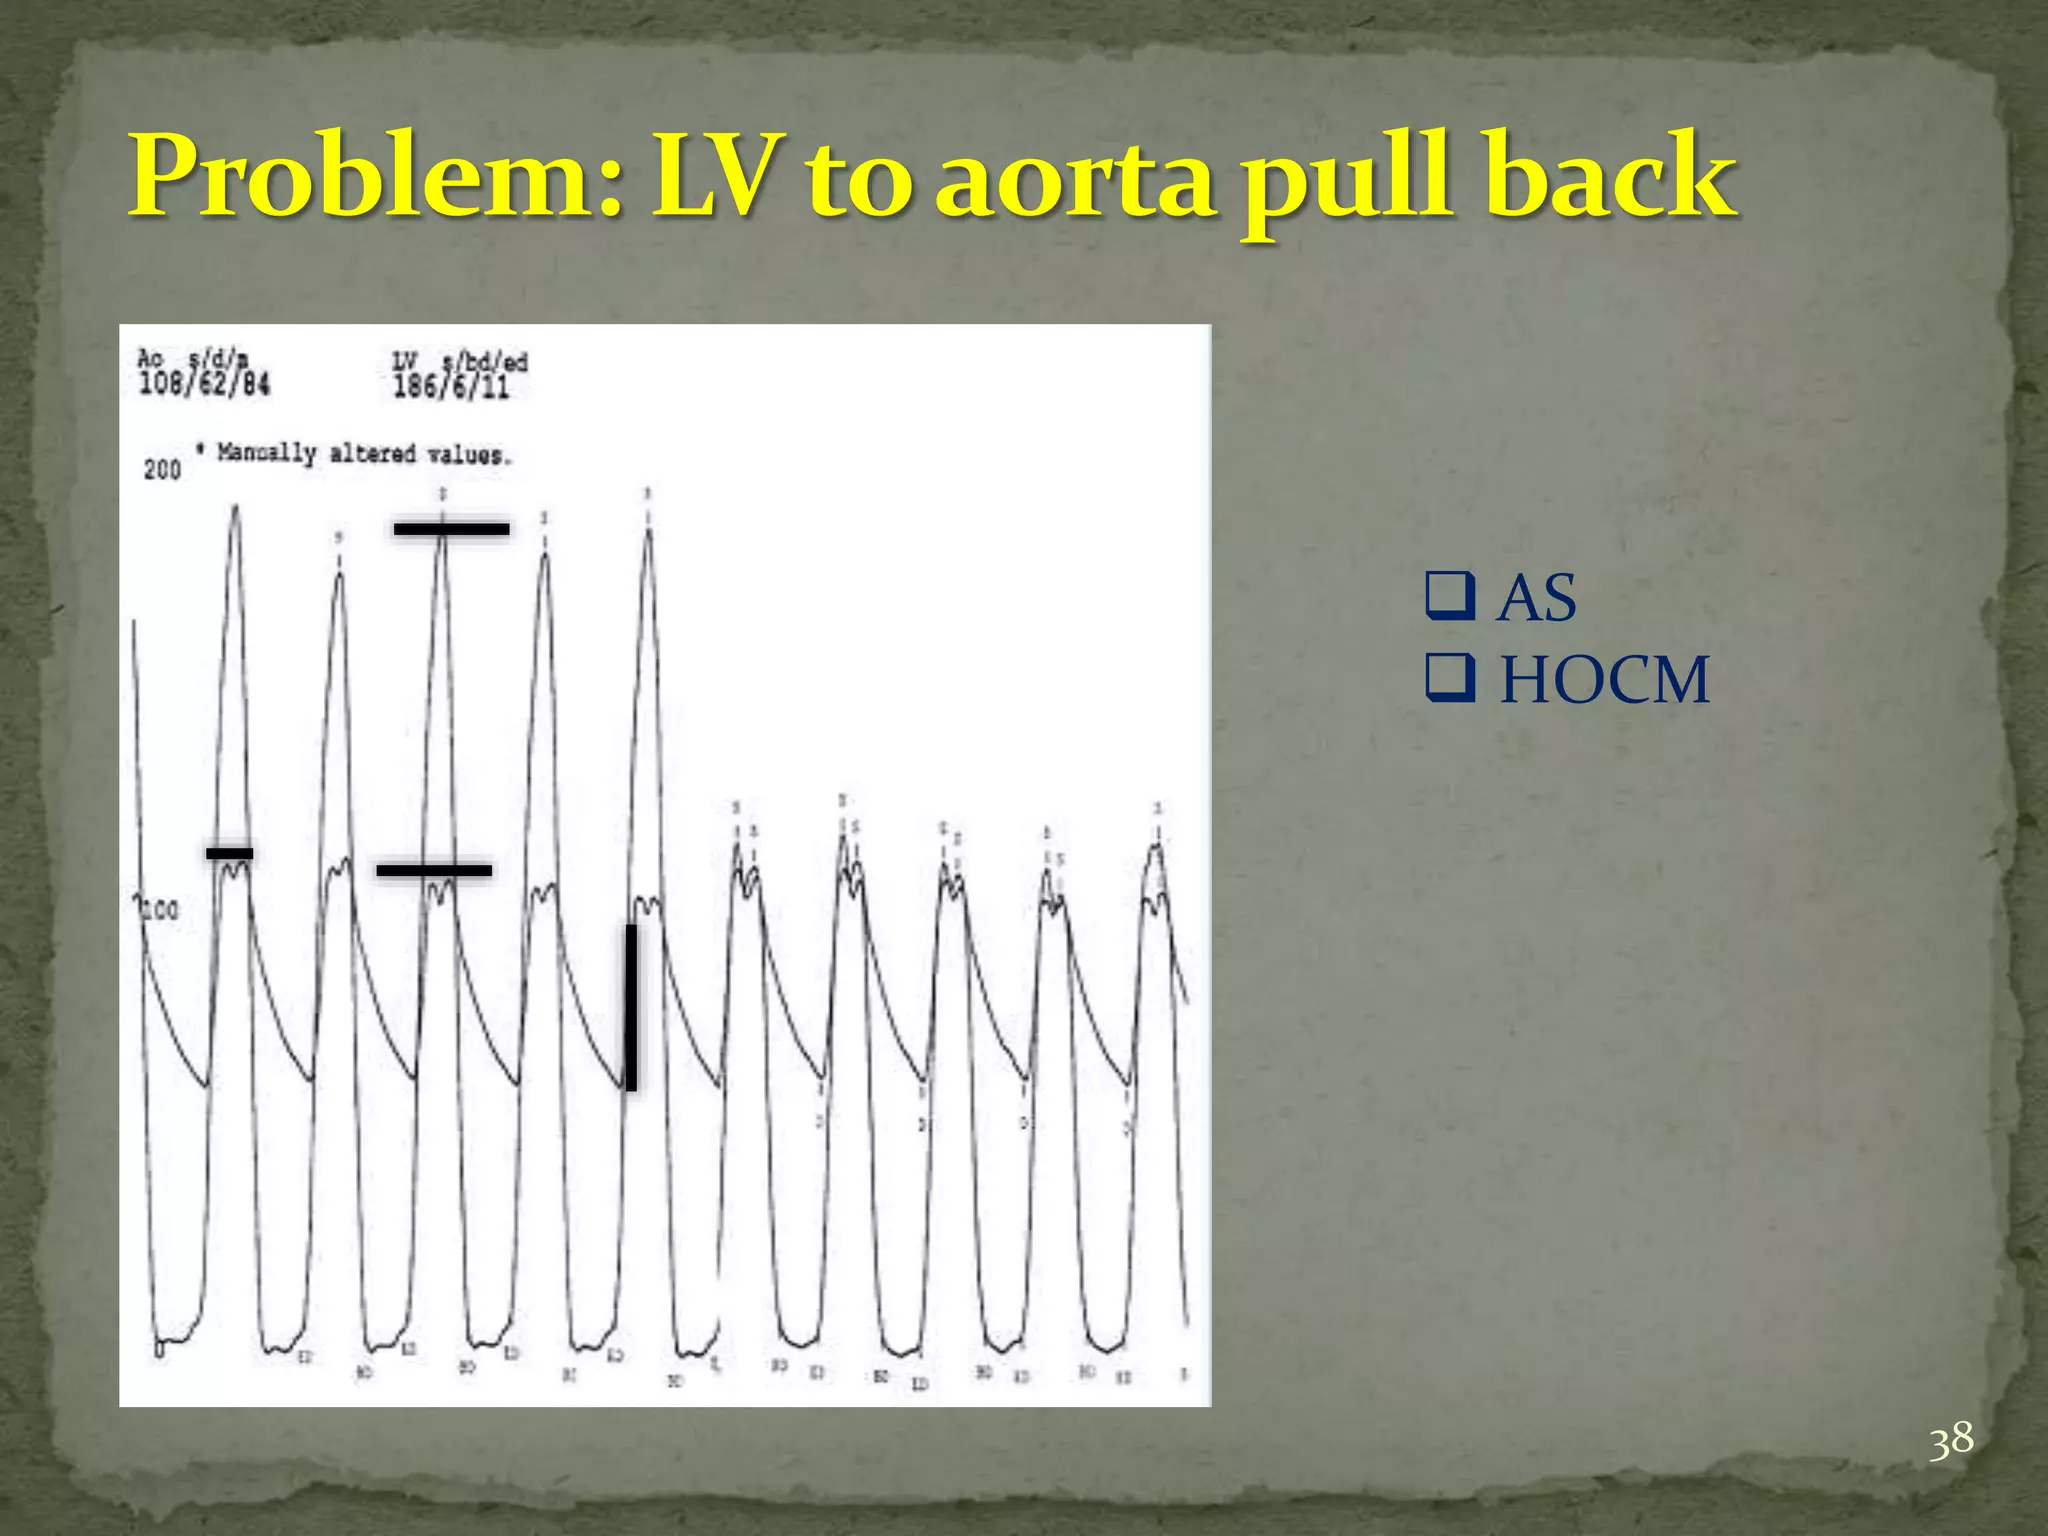
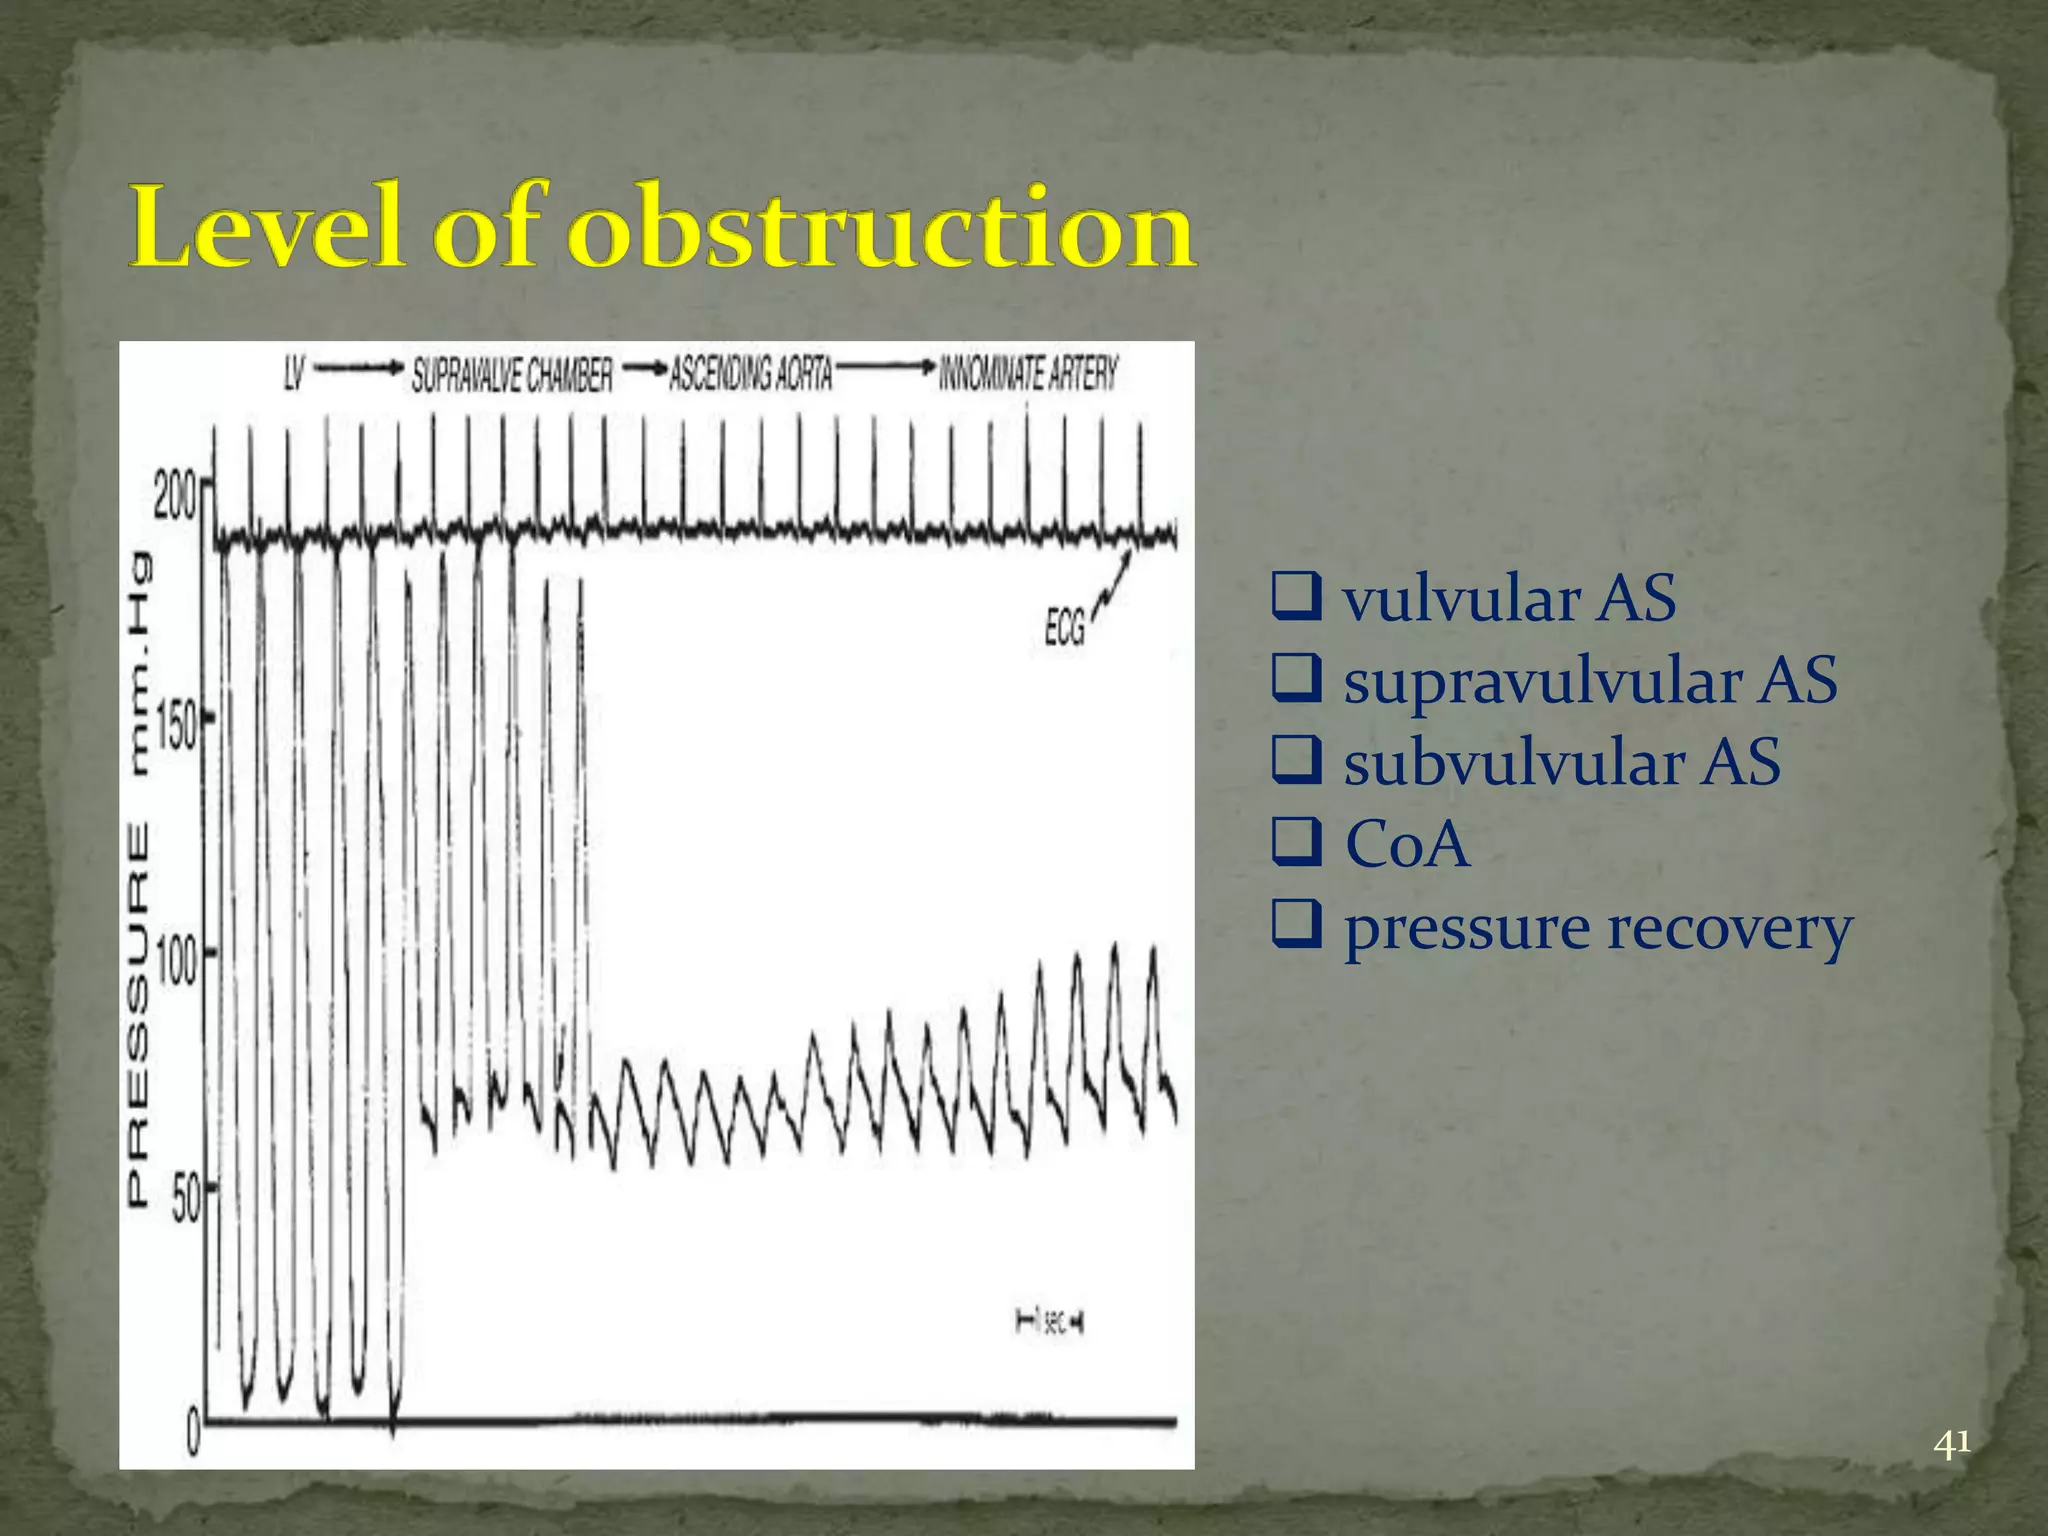
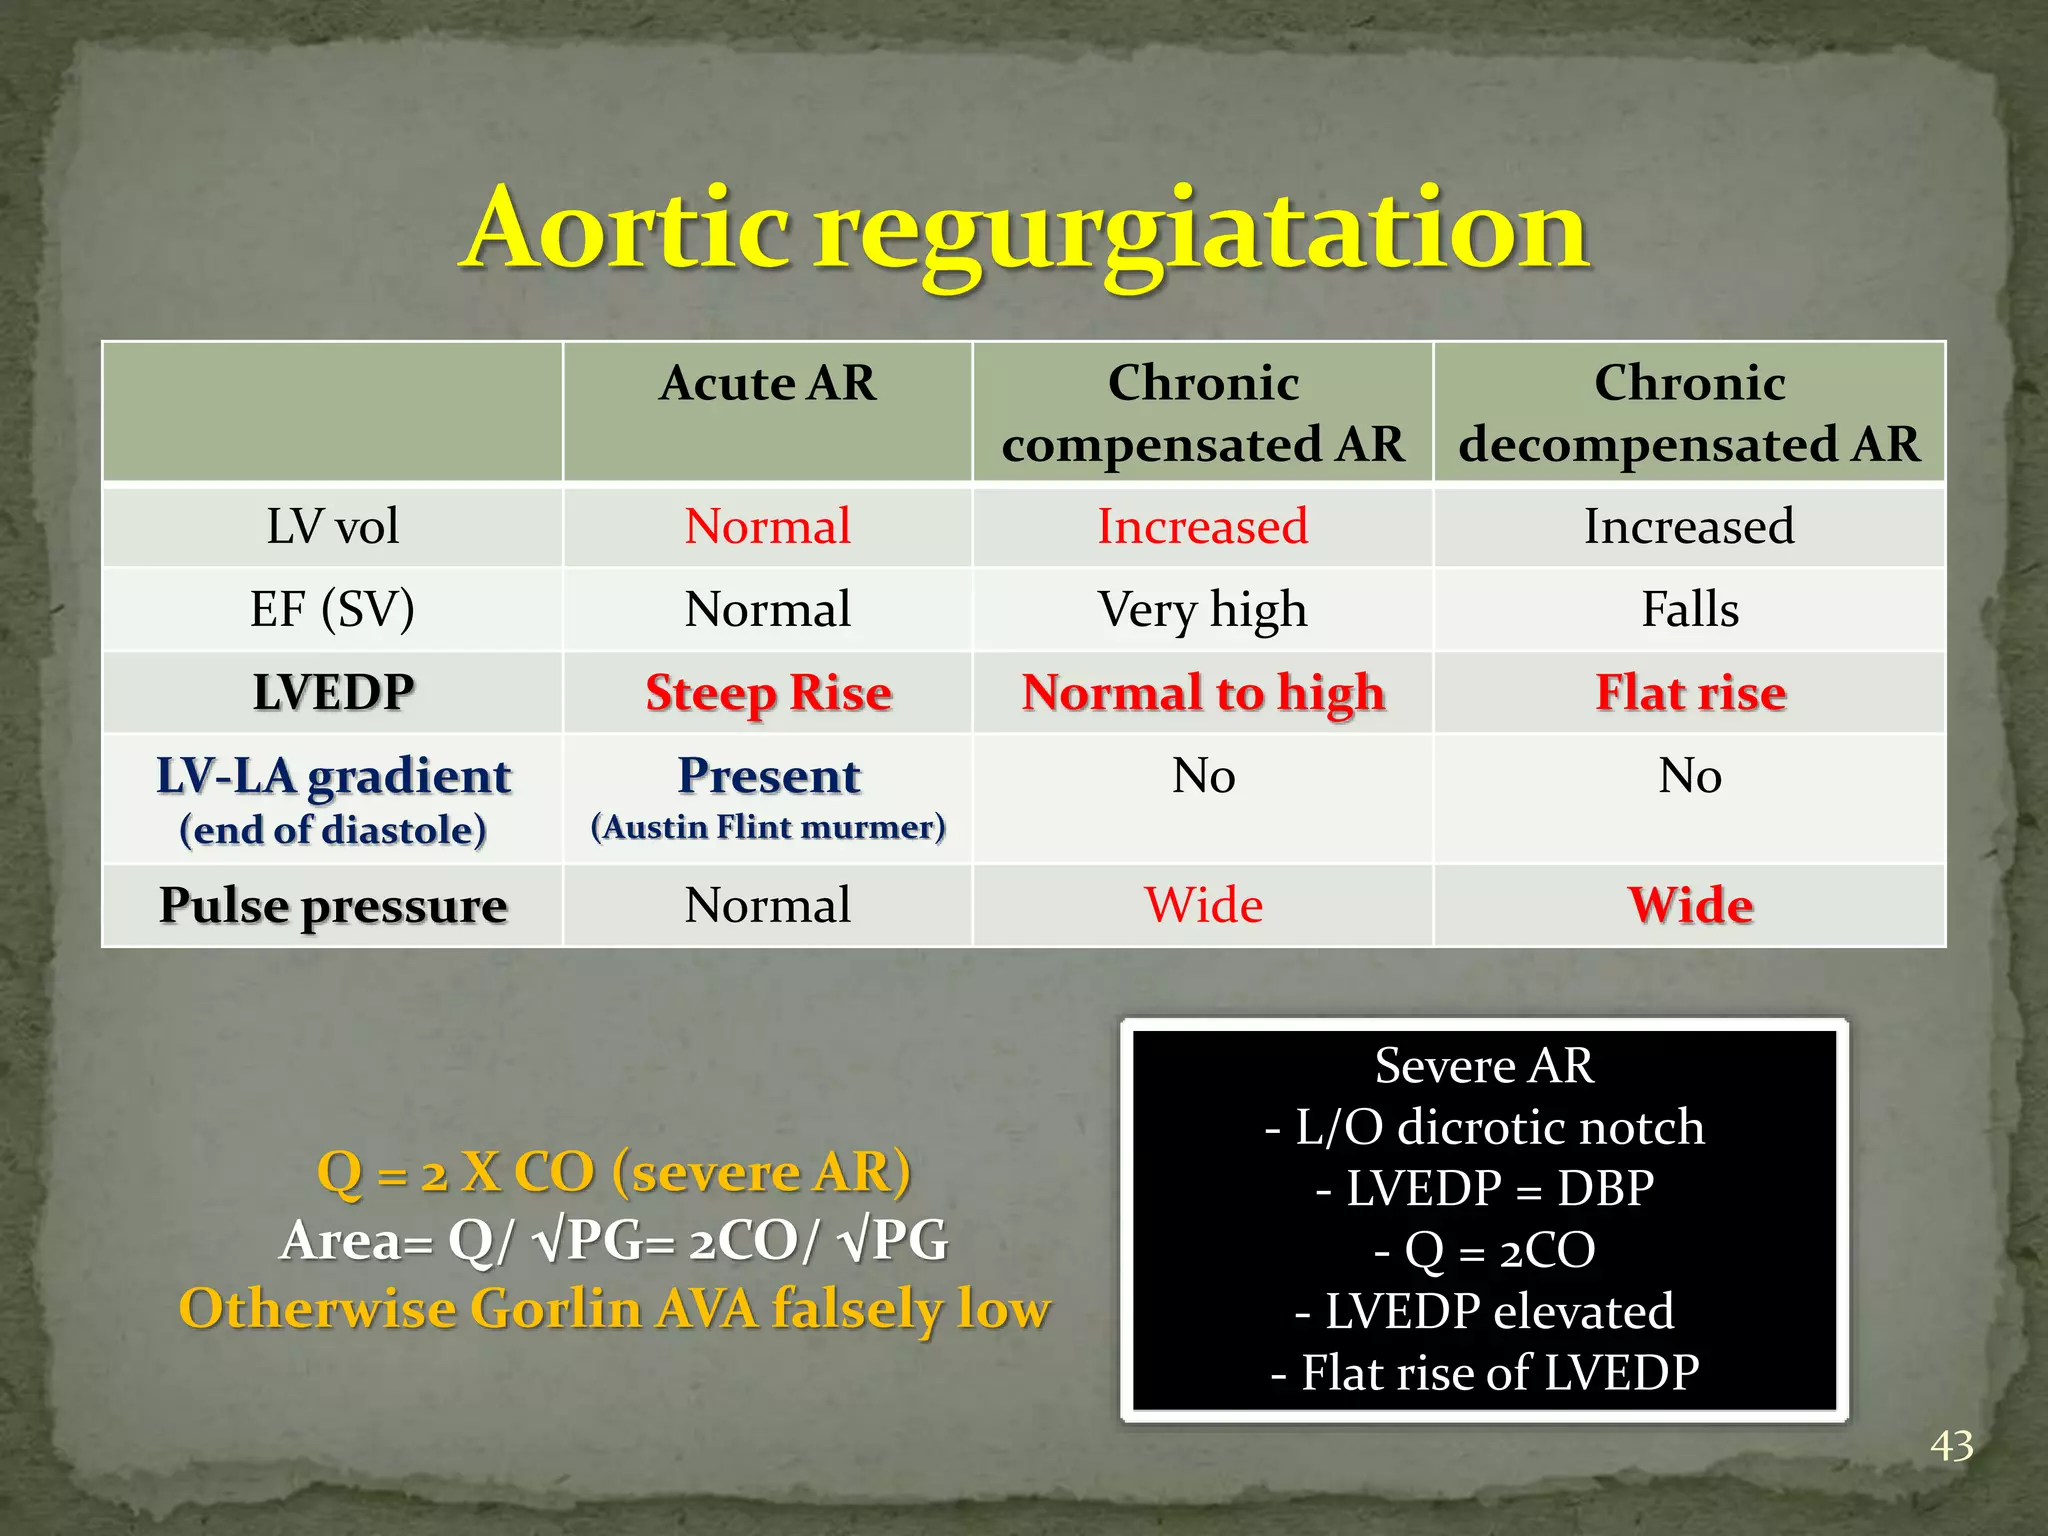
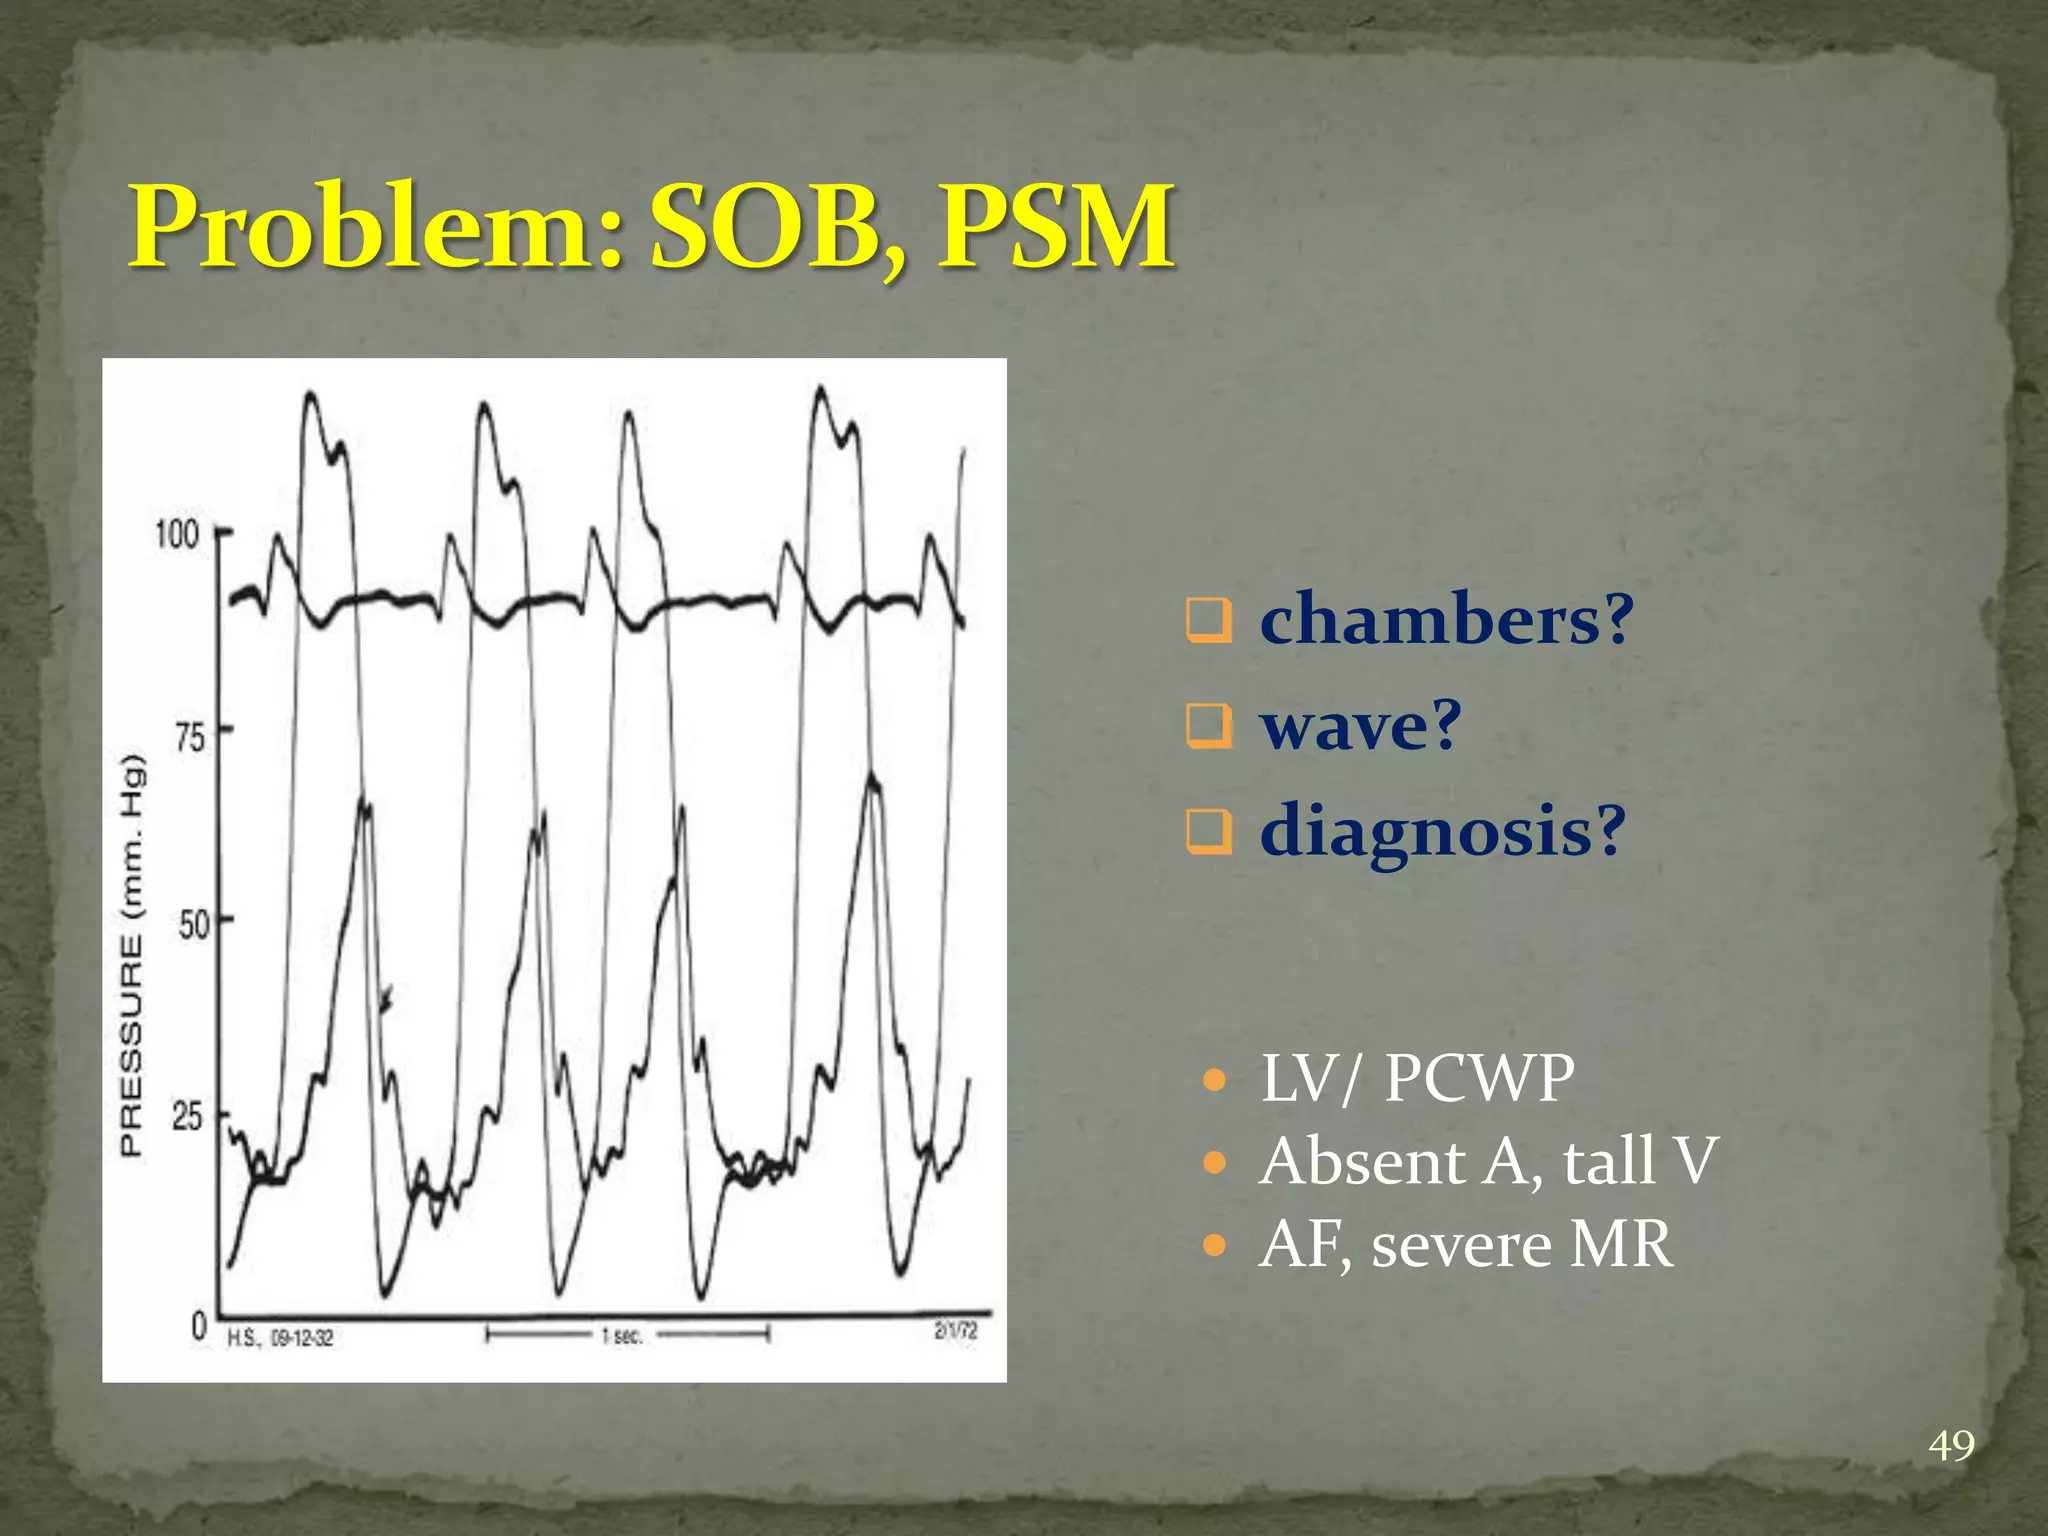
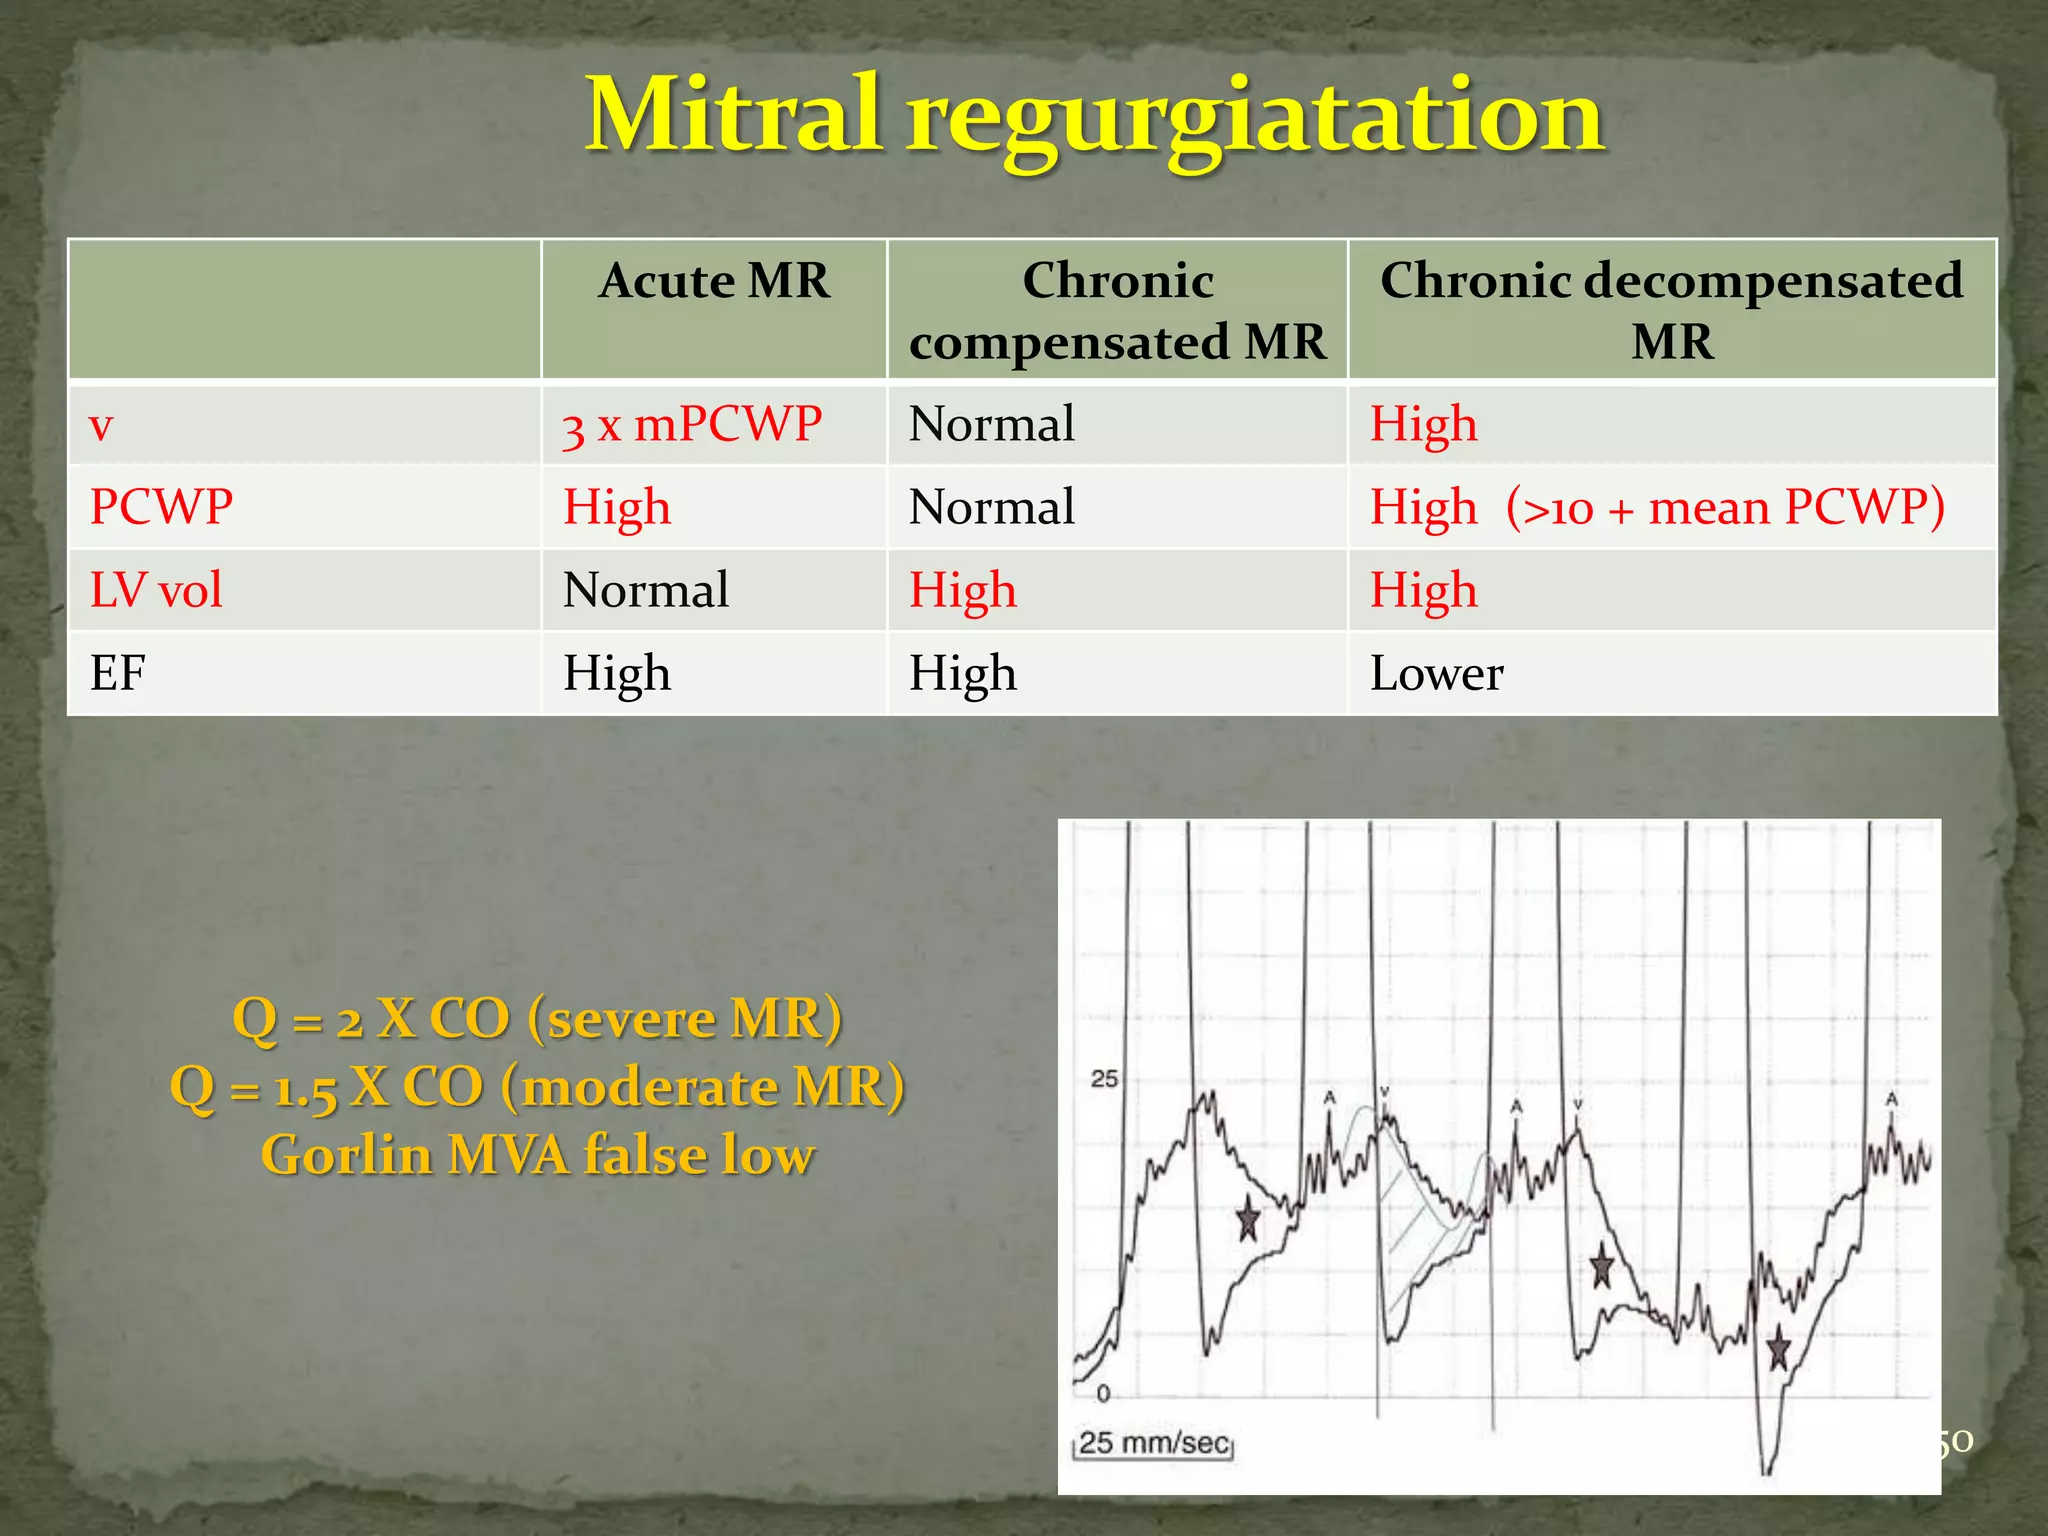
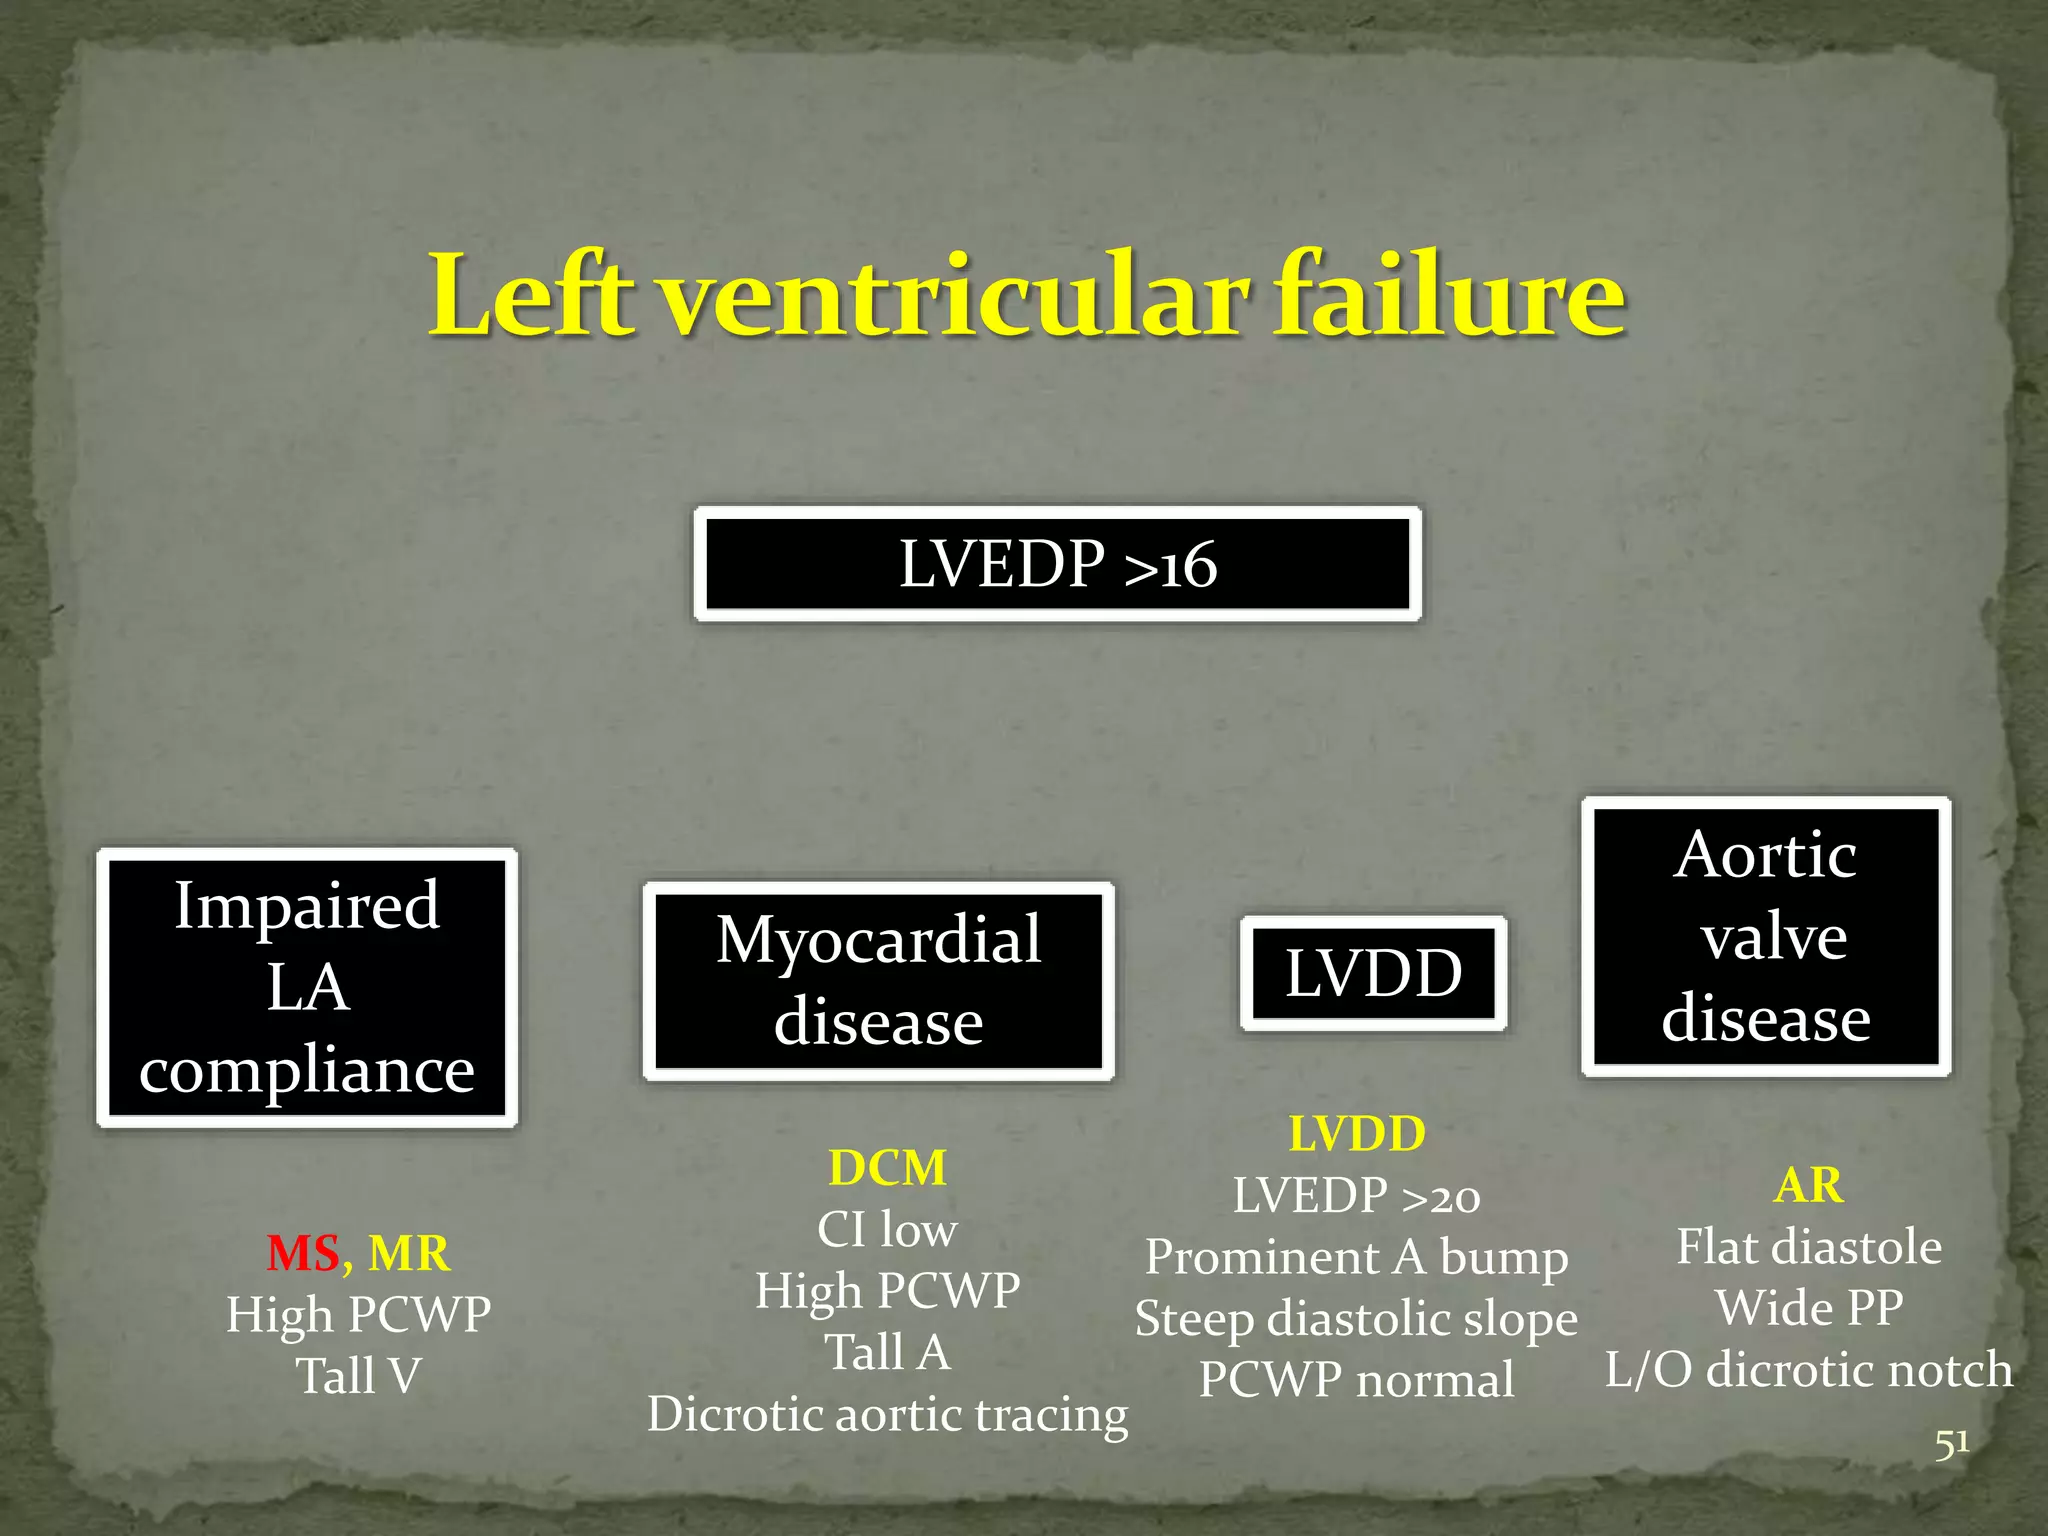
- Key waveforms and pressures are described for valvular lesions like mitral stenosis, aortic stenosis, mitral regurgitation and aortic regurgitation.
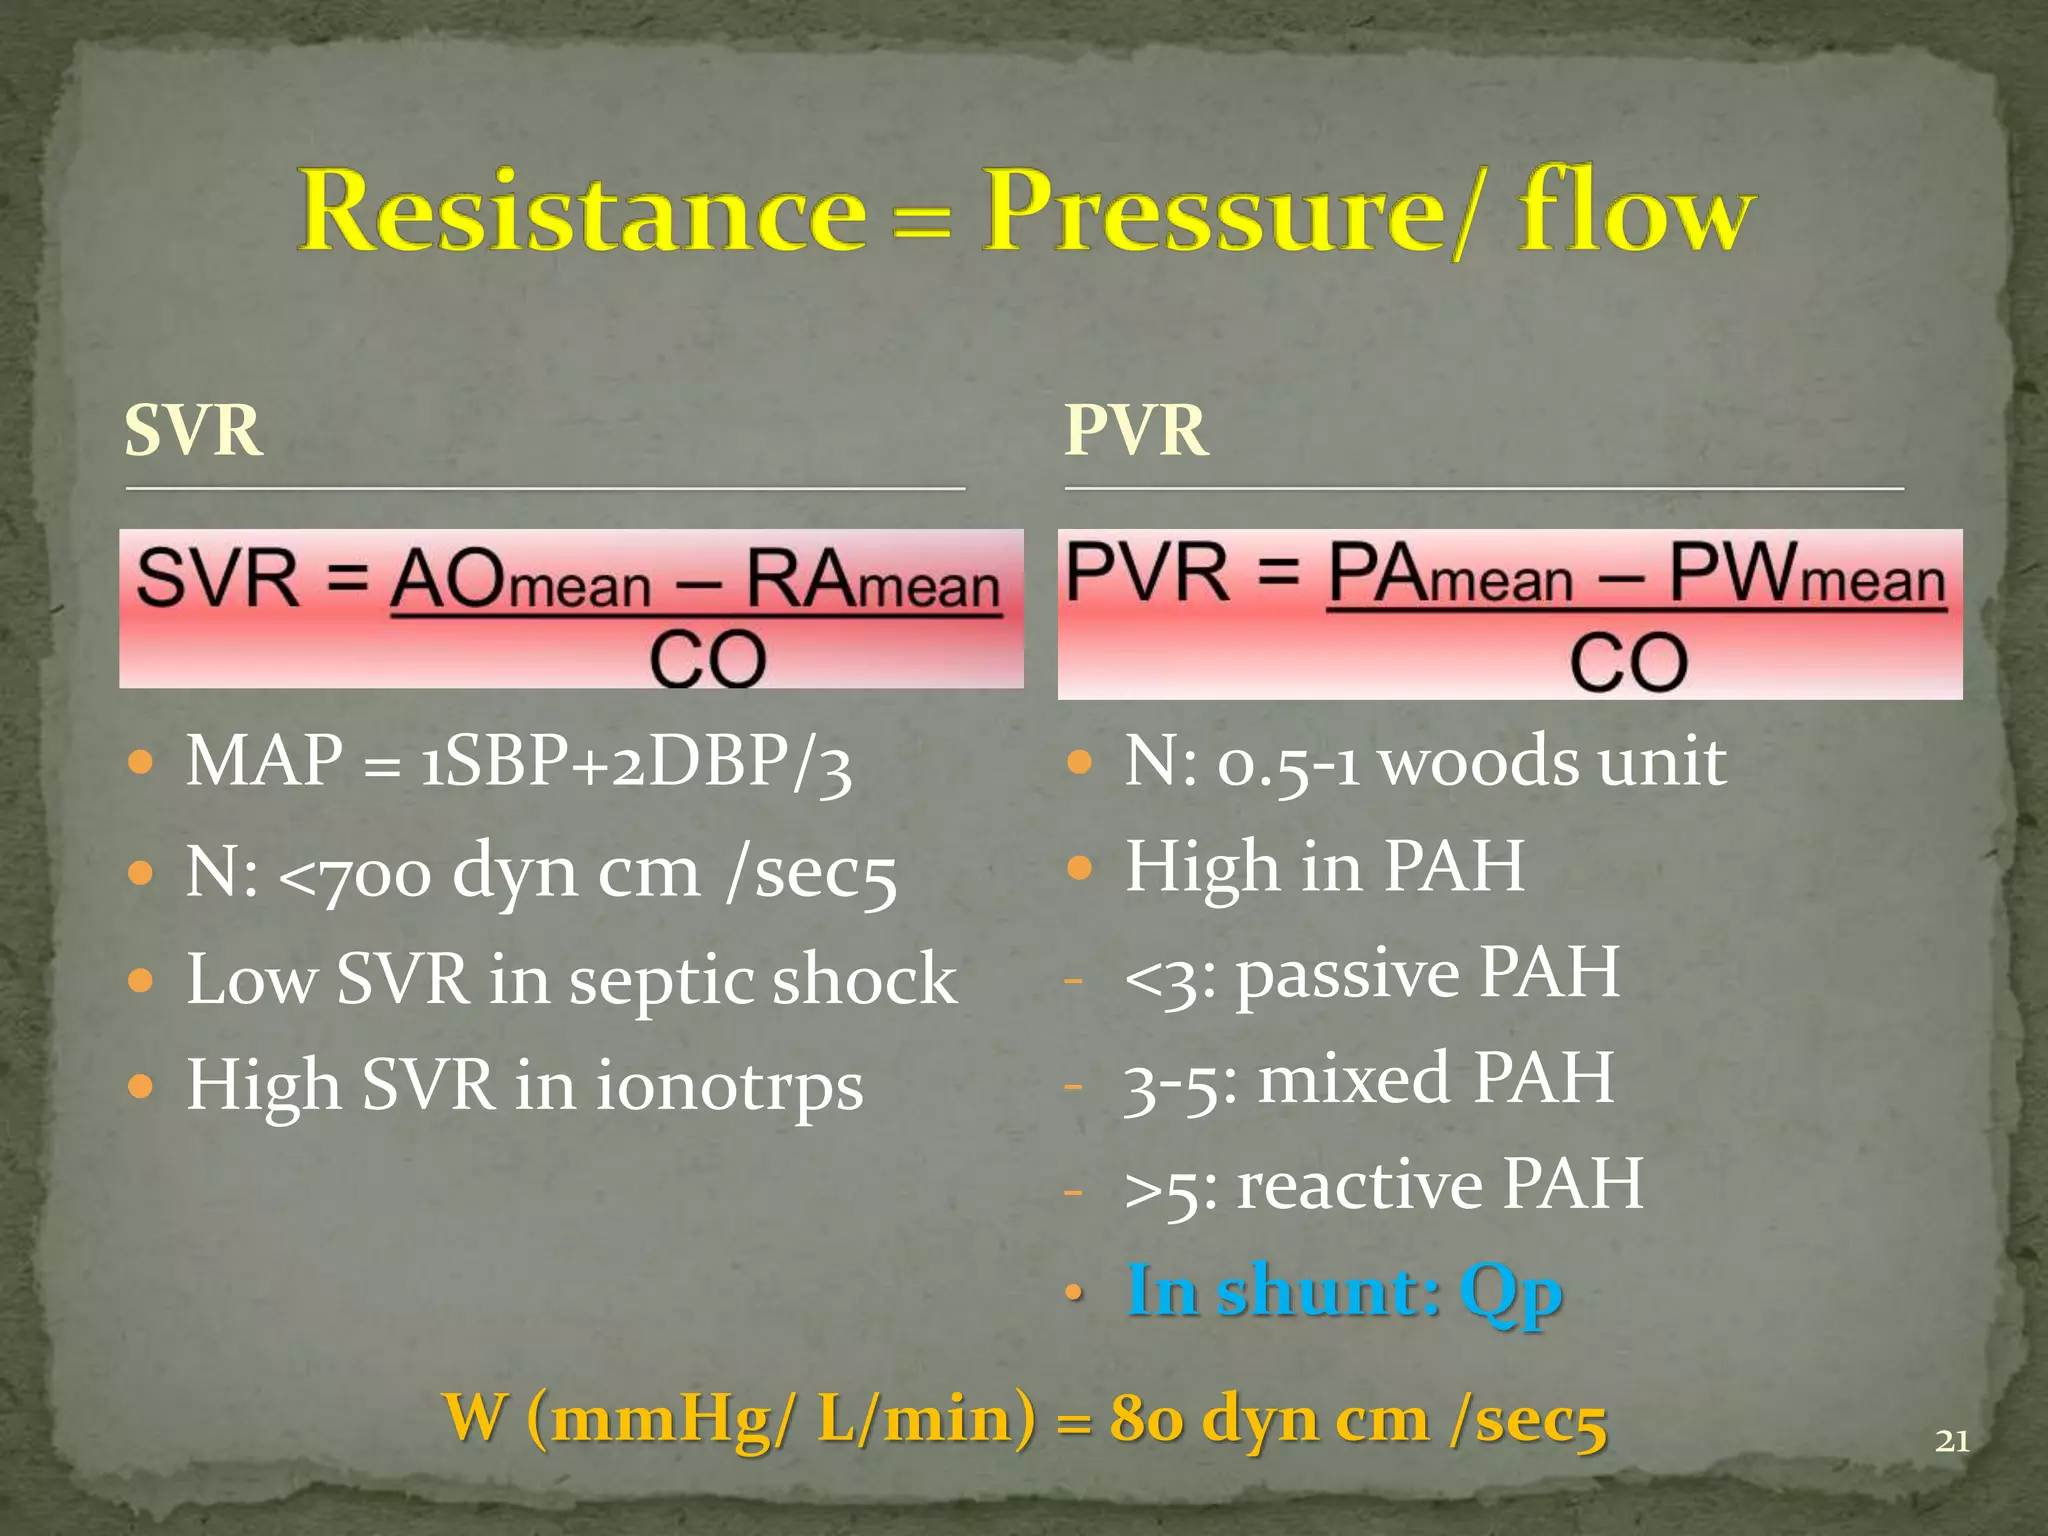
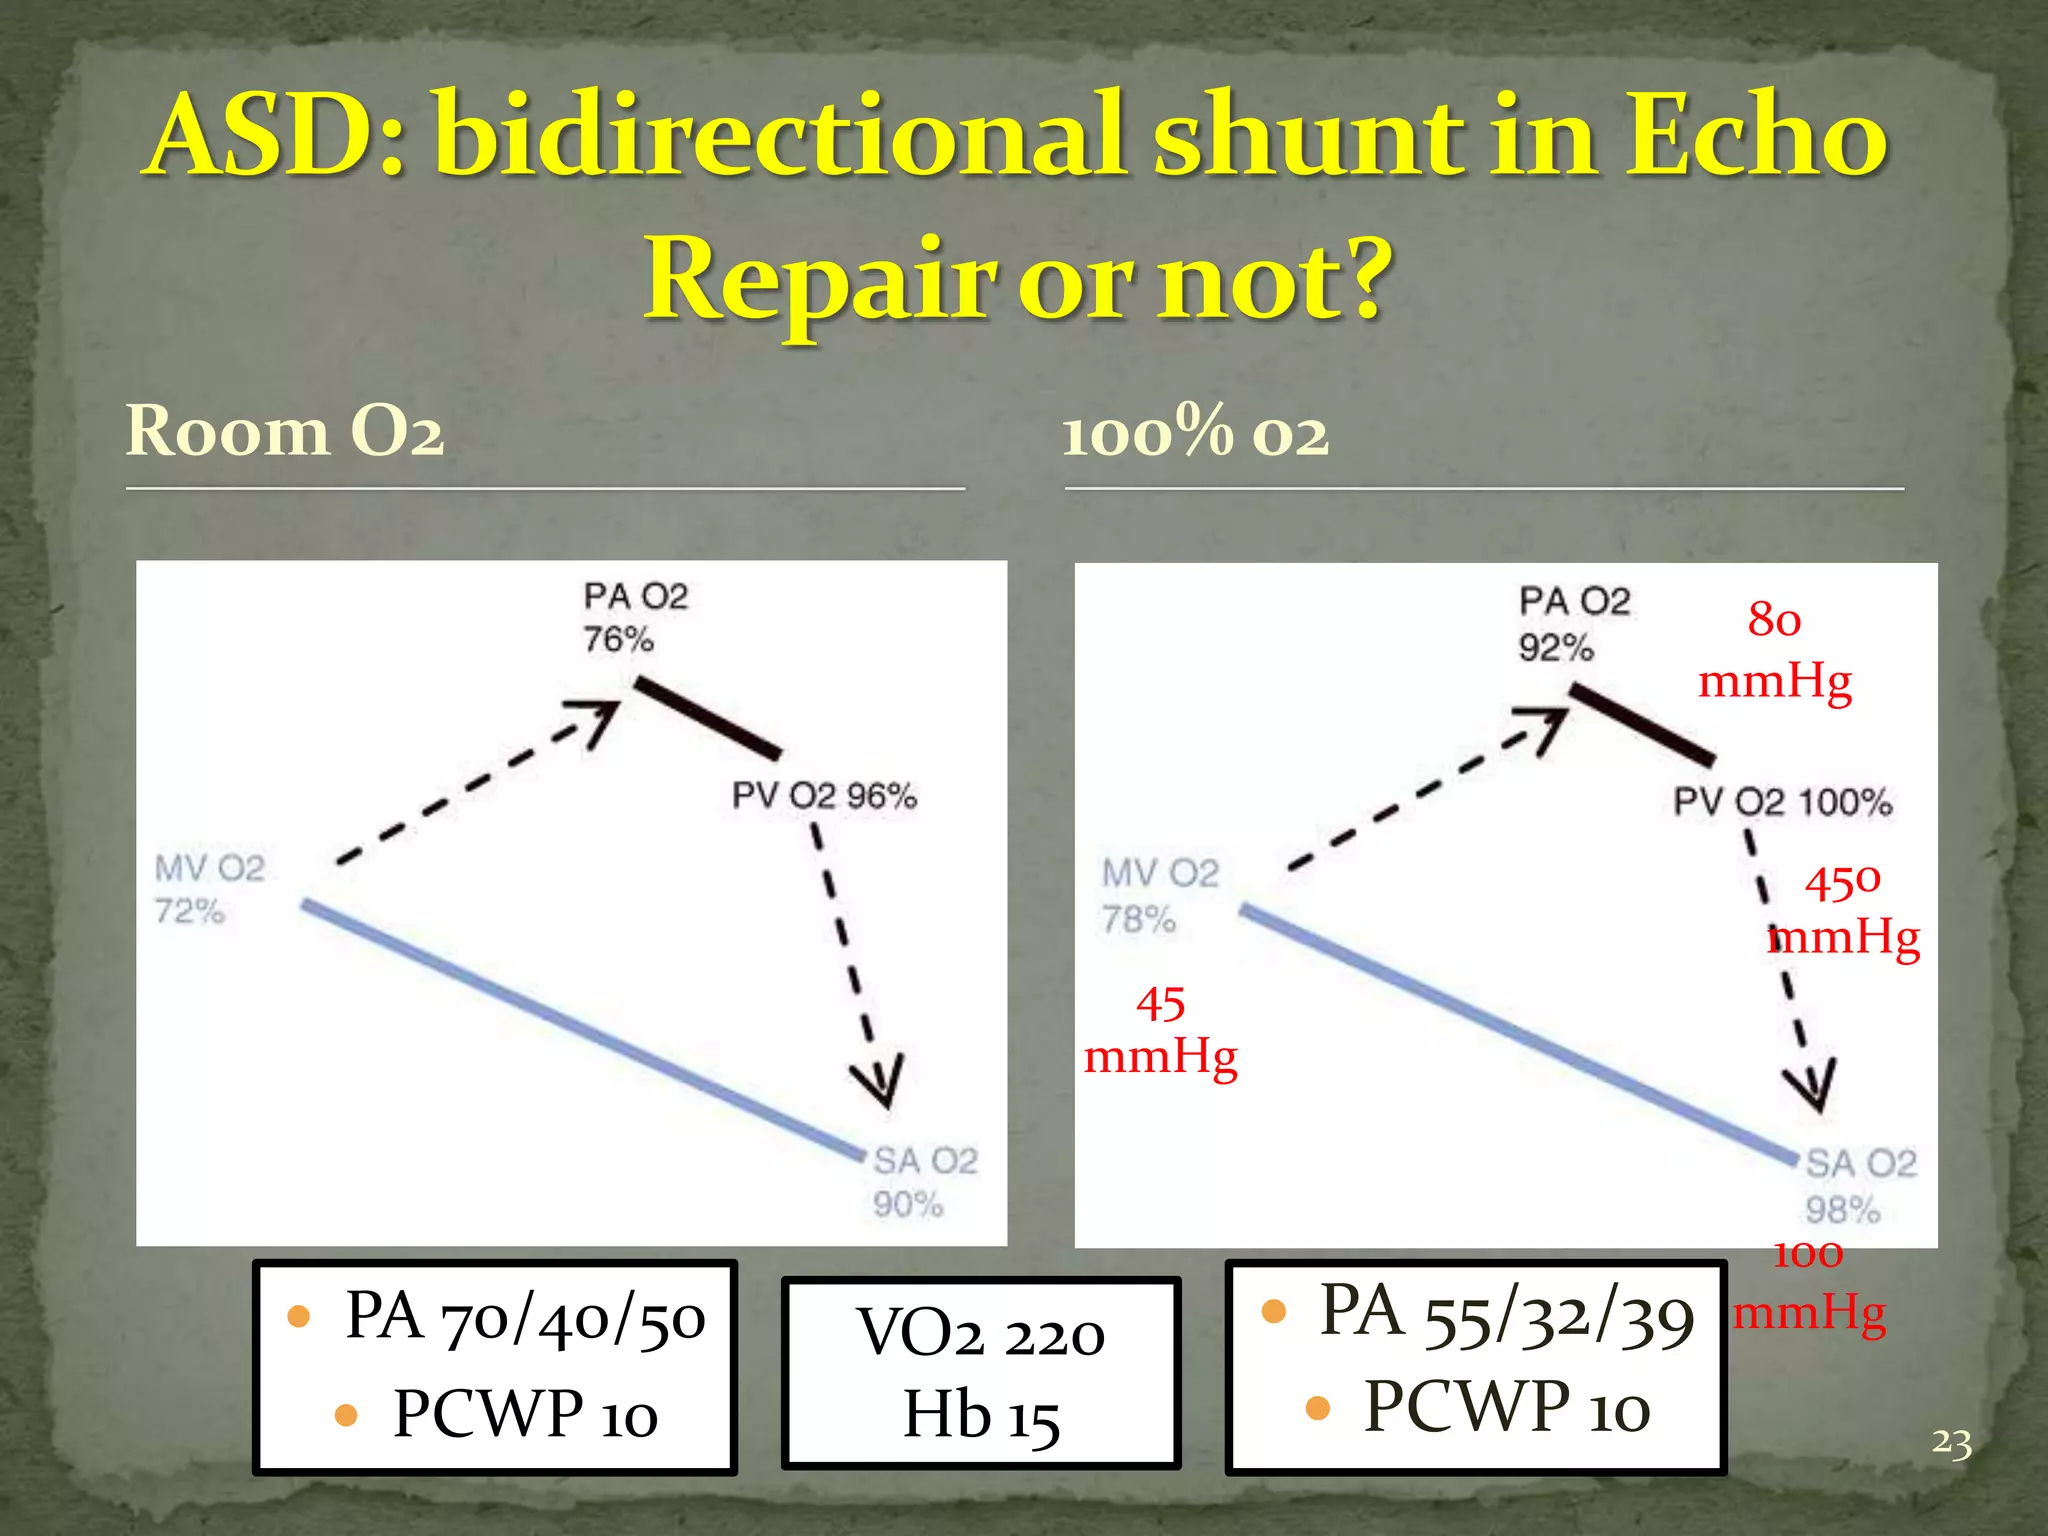
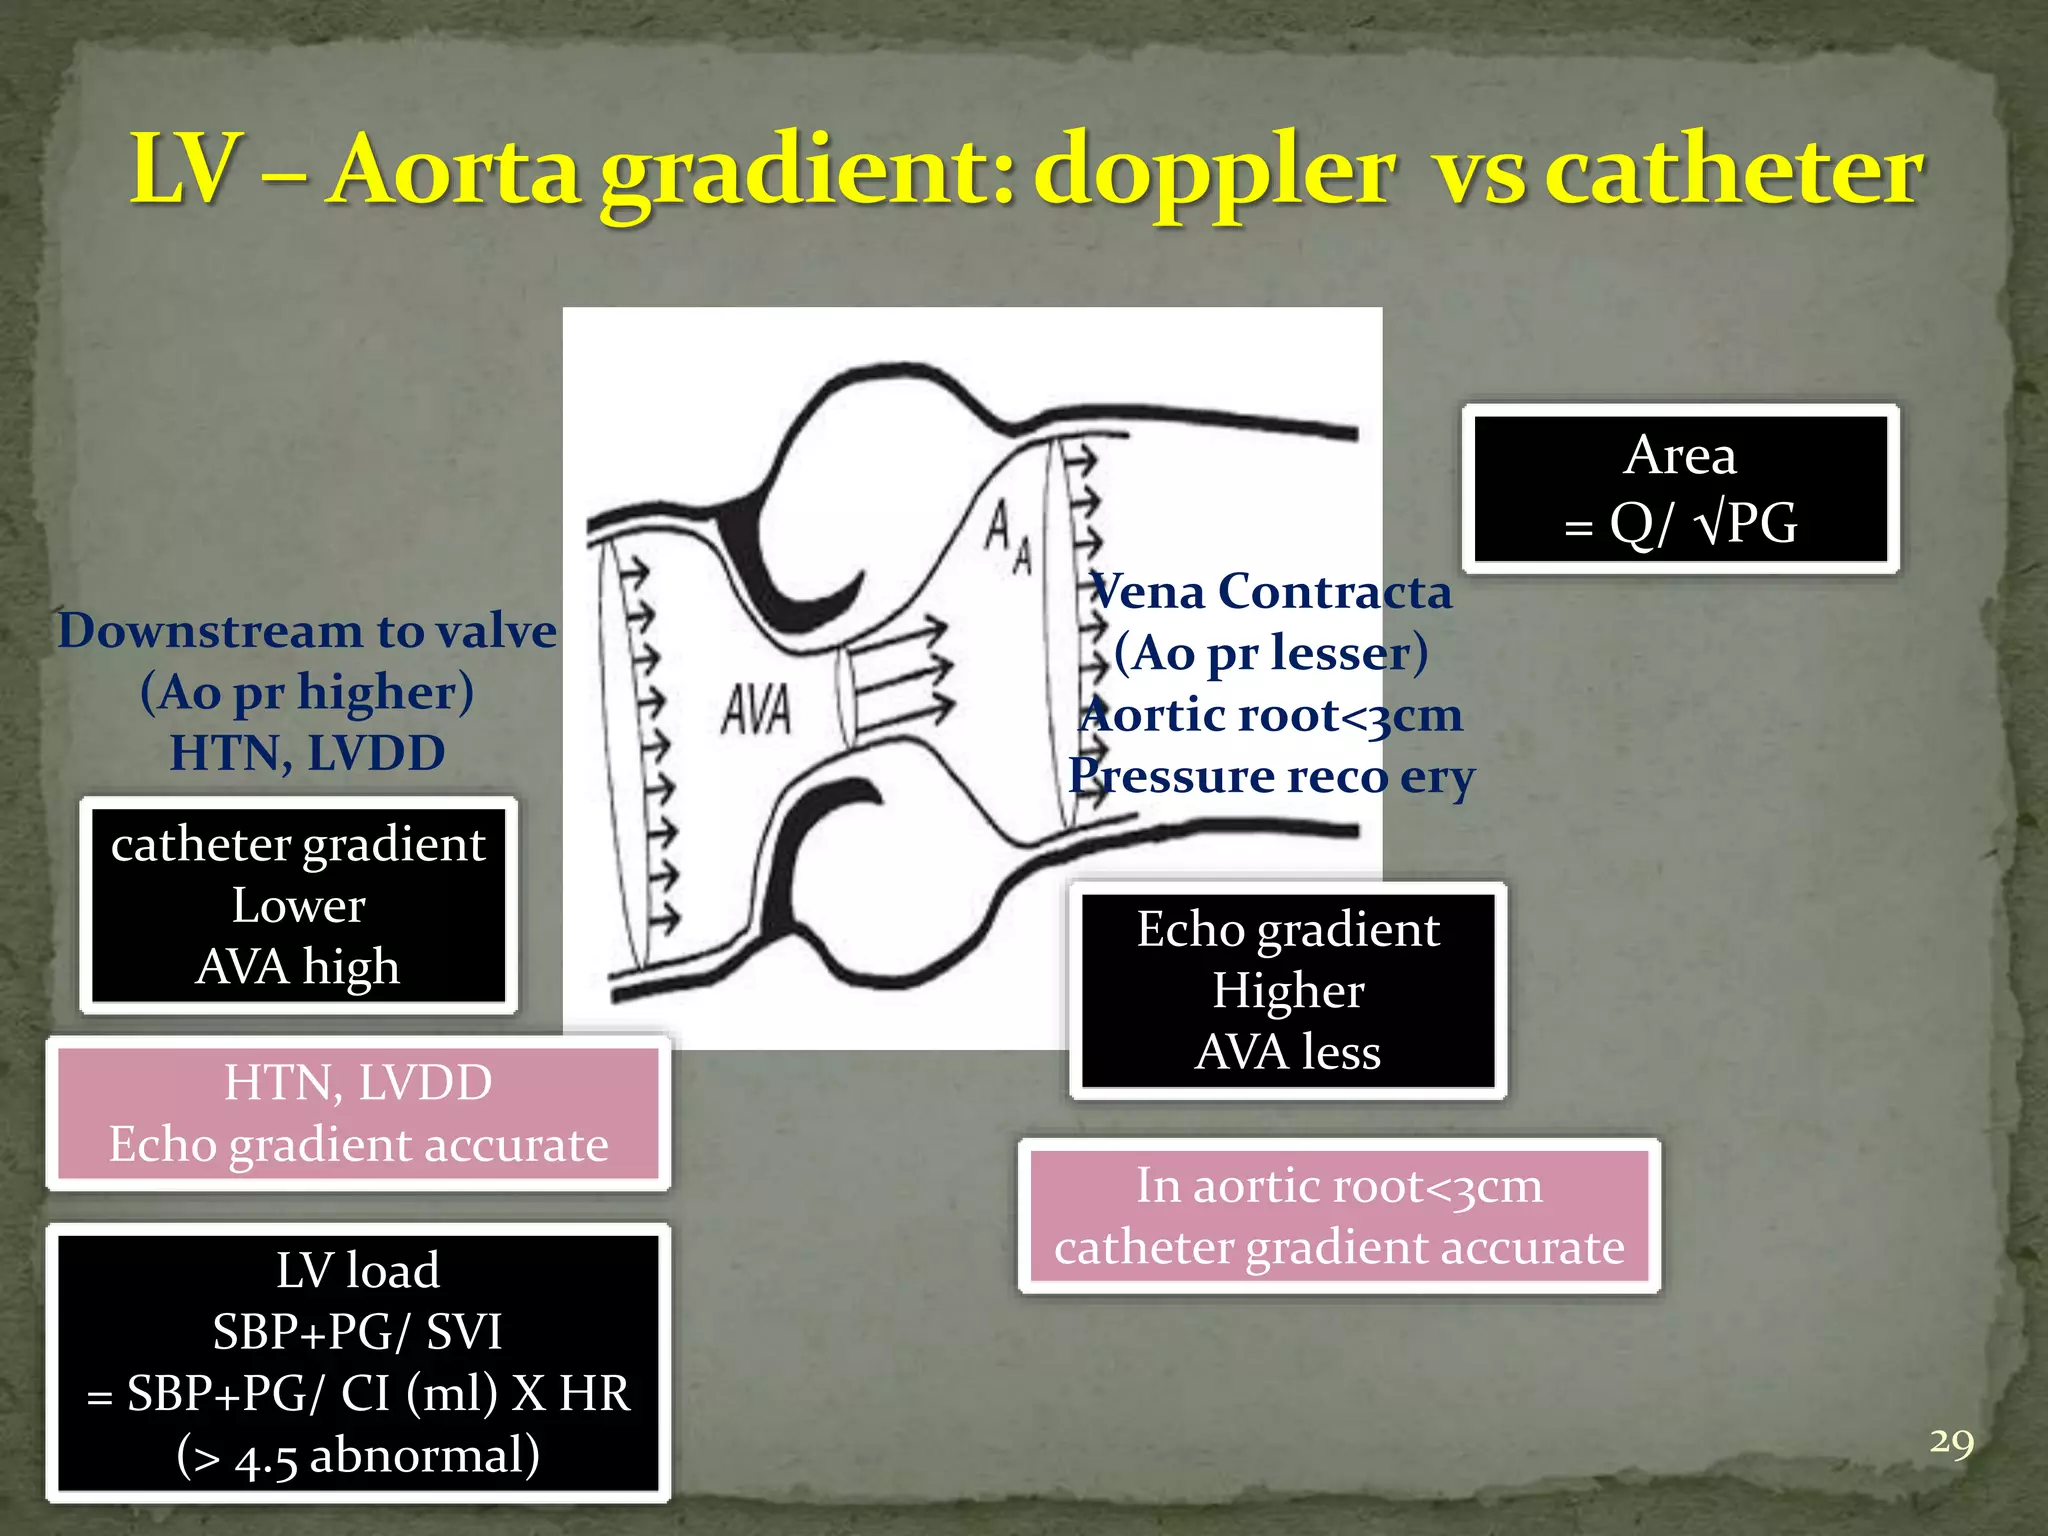
- Equations for calculating cardiac output, shunt fractions and valvular areas are provided.
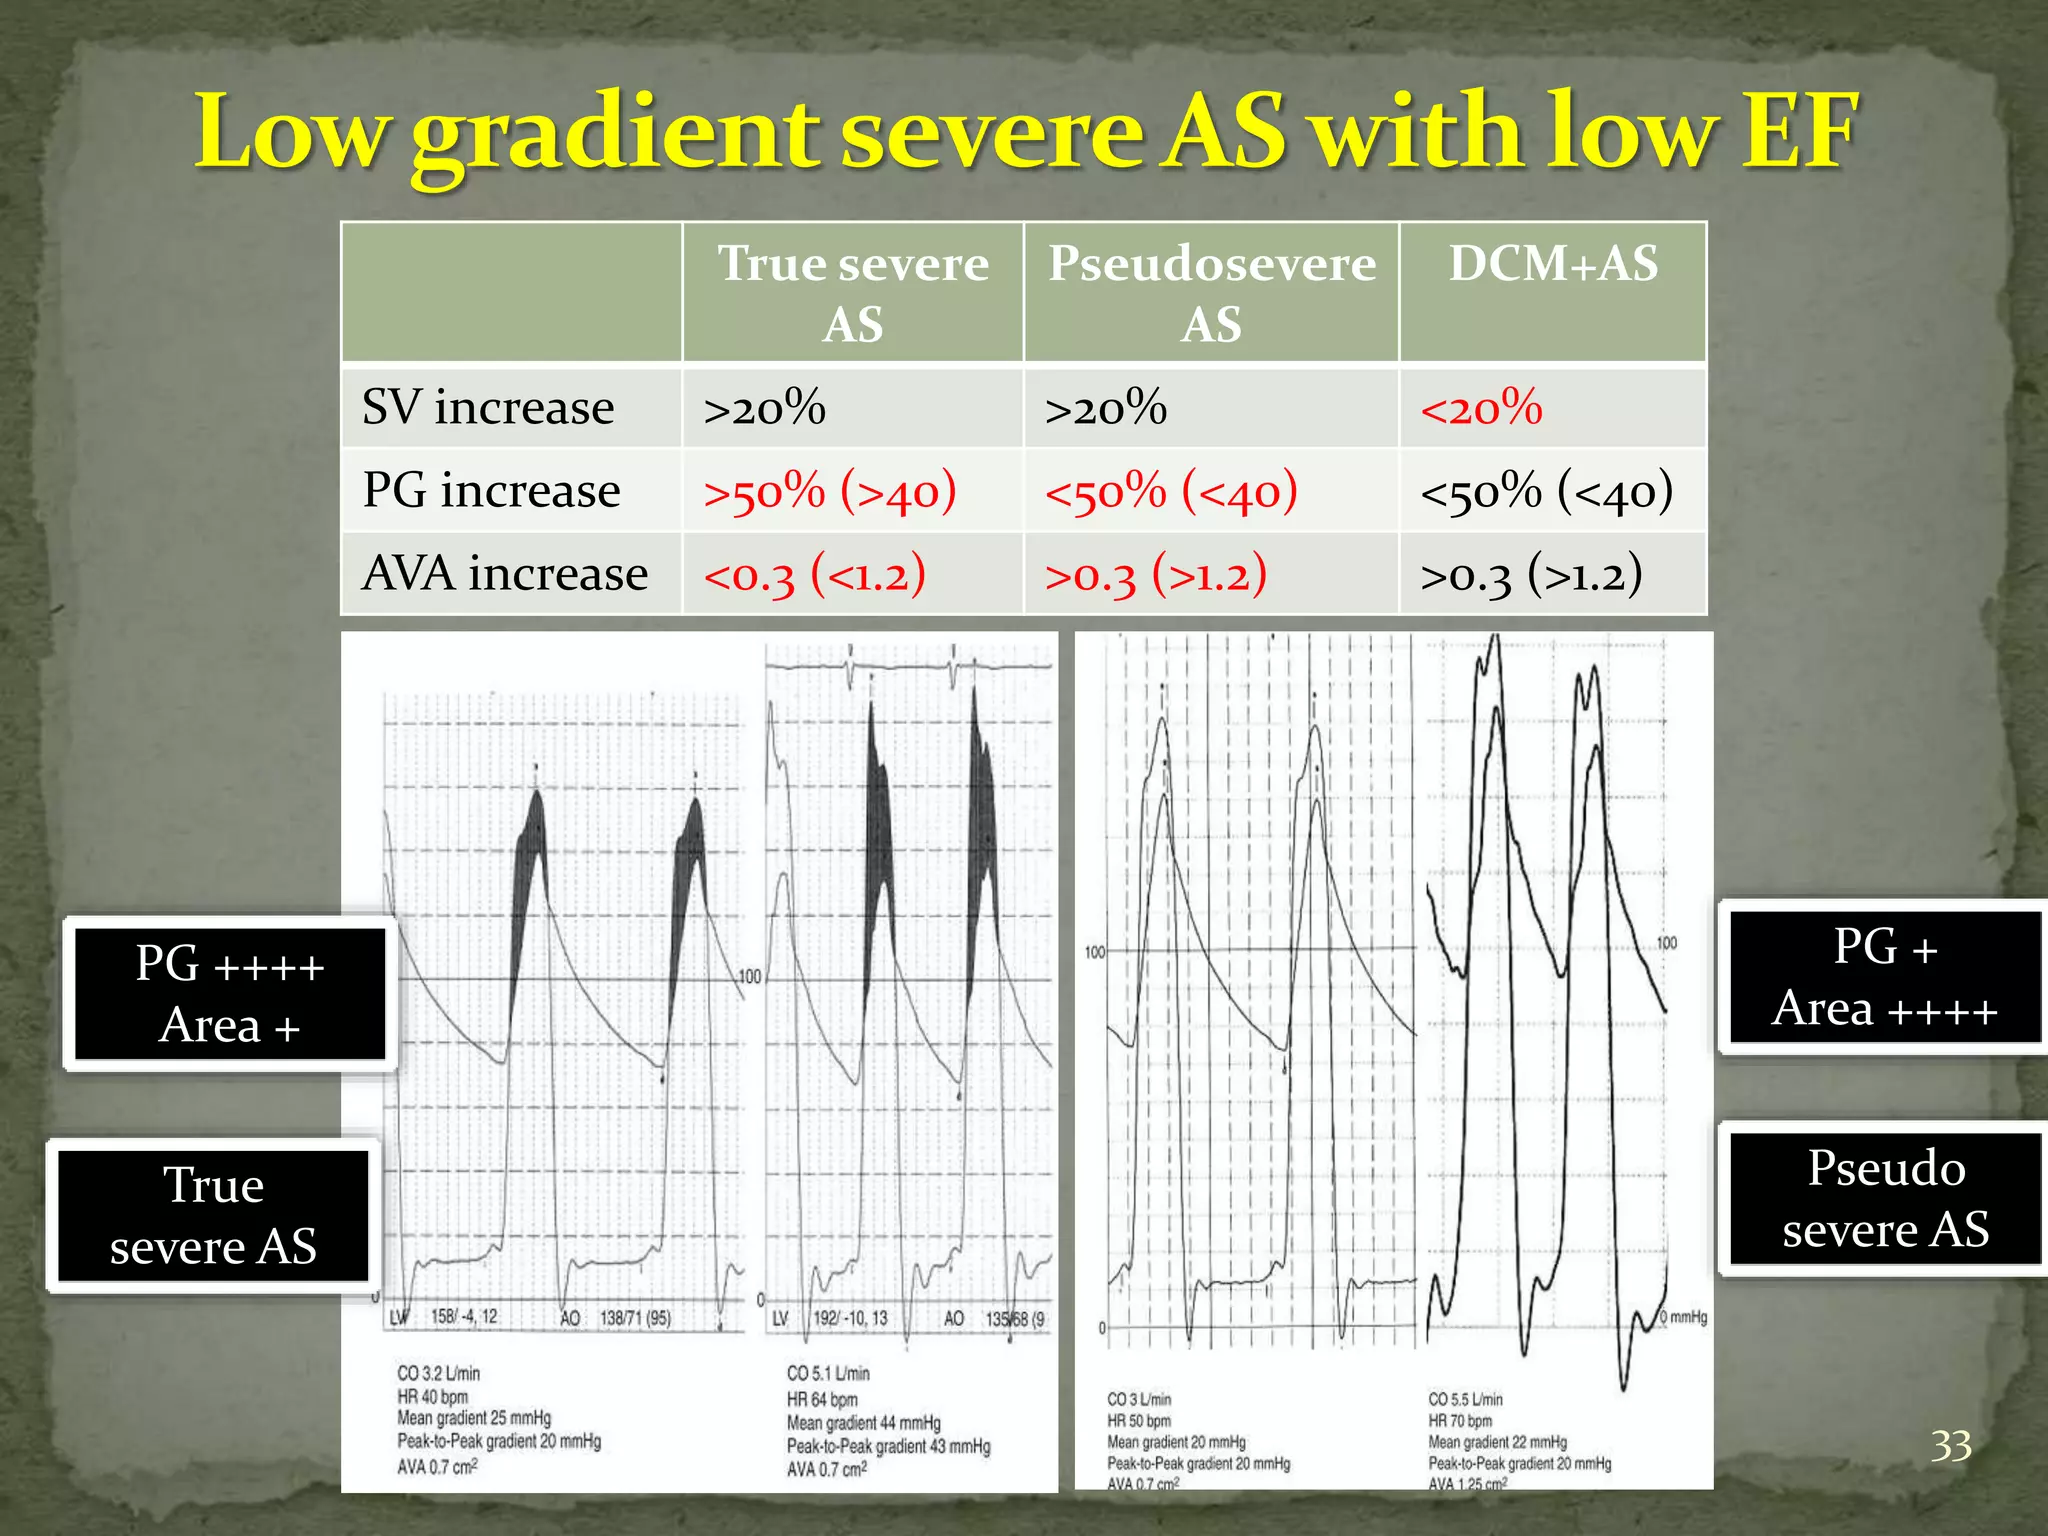
- Diagnostic criteria for pseudosevere versus true severe aortic stenosis on stress echocardiography are outlined.
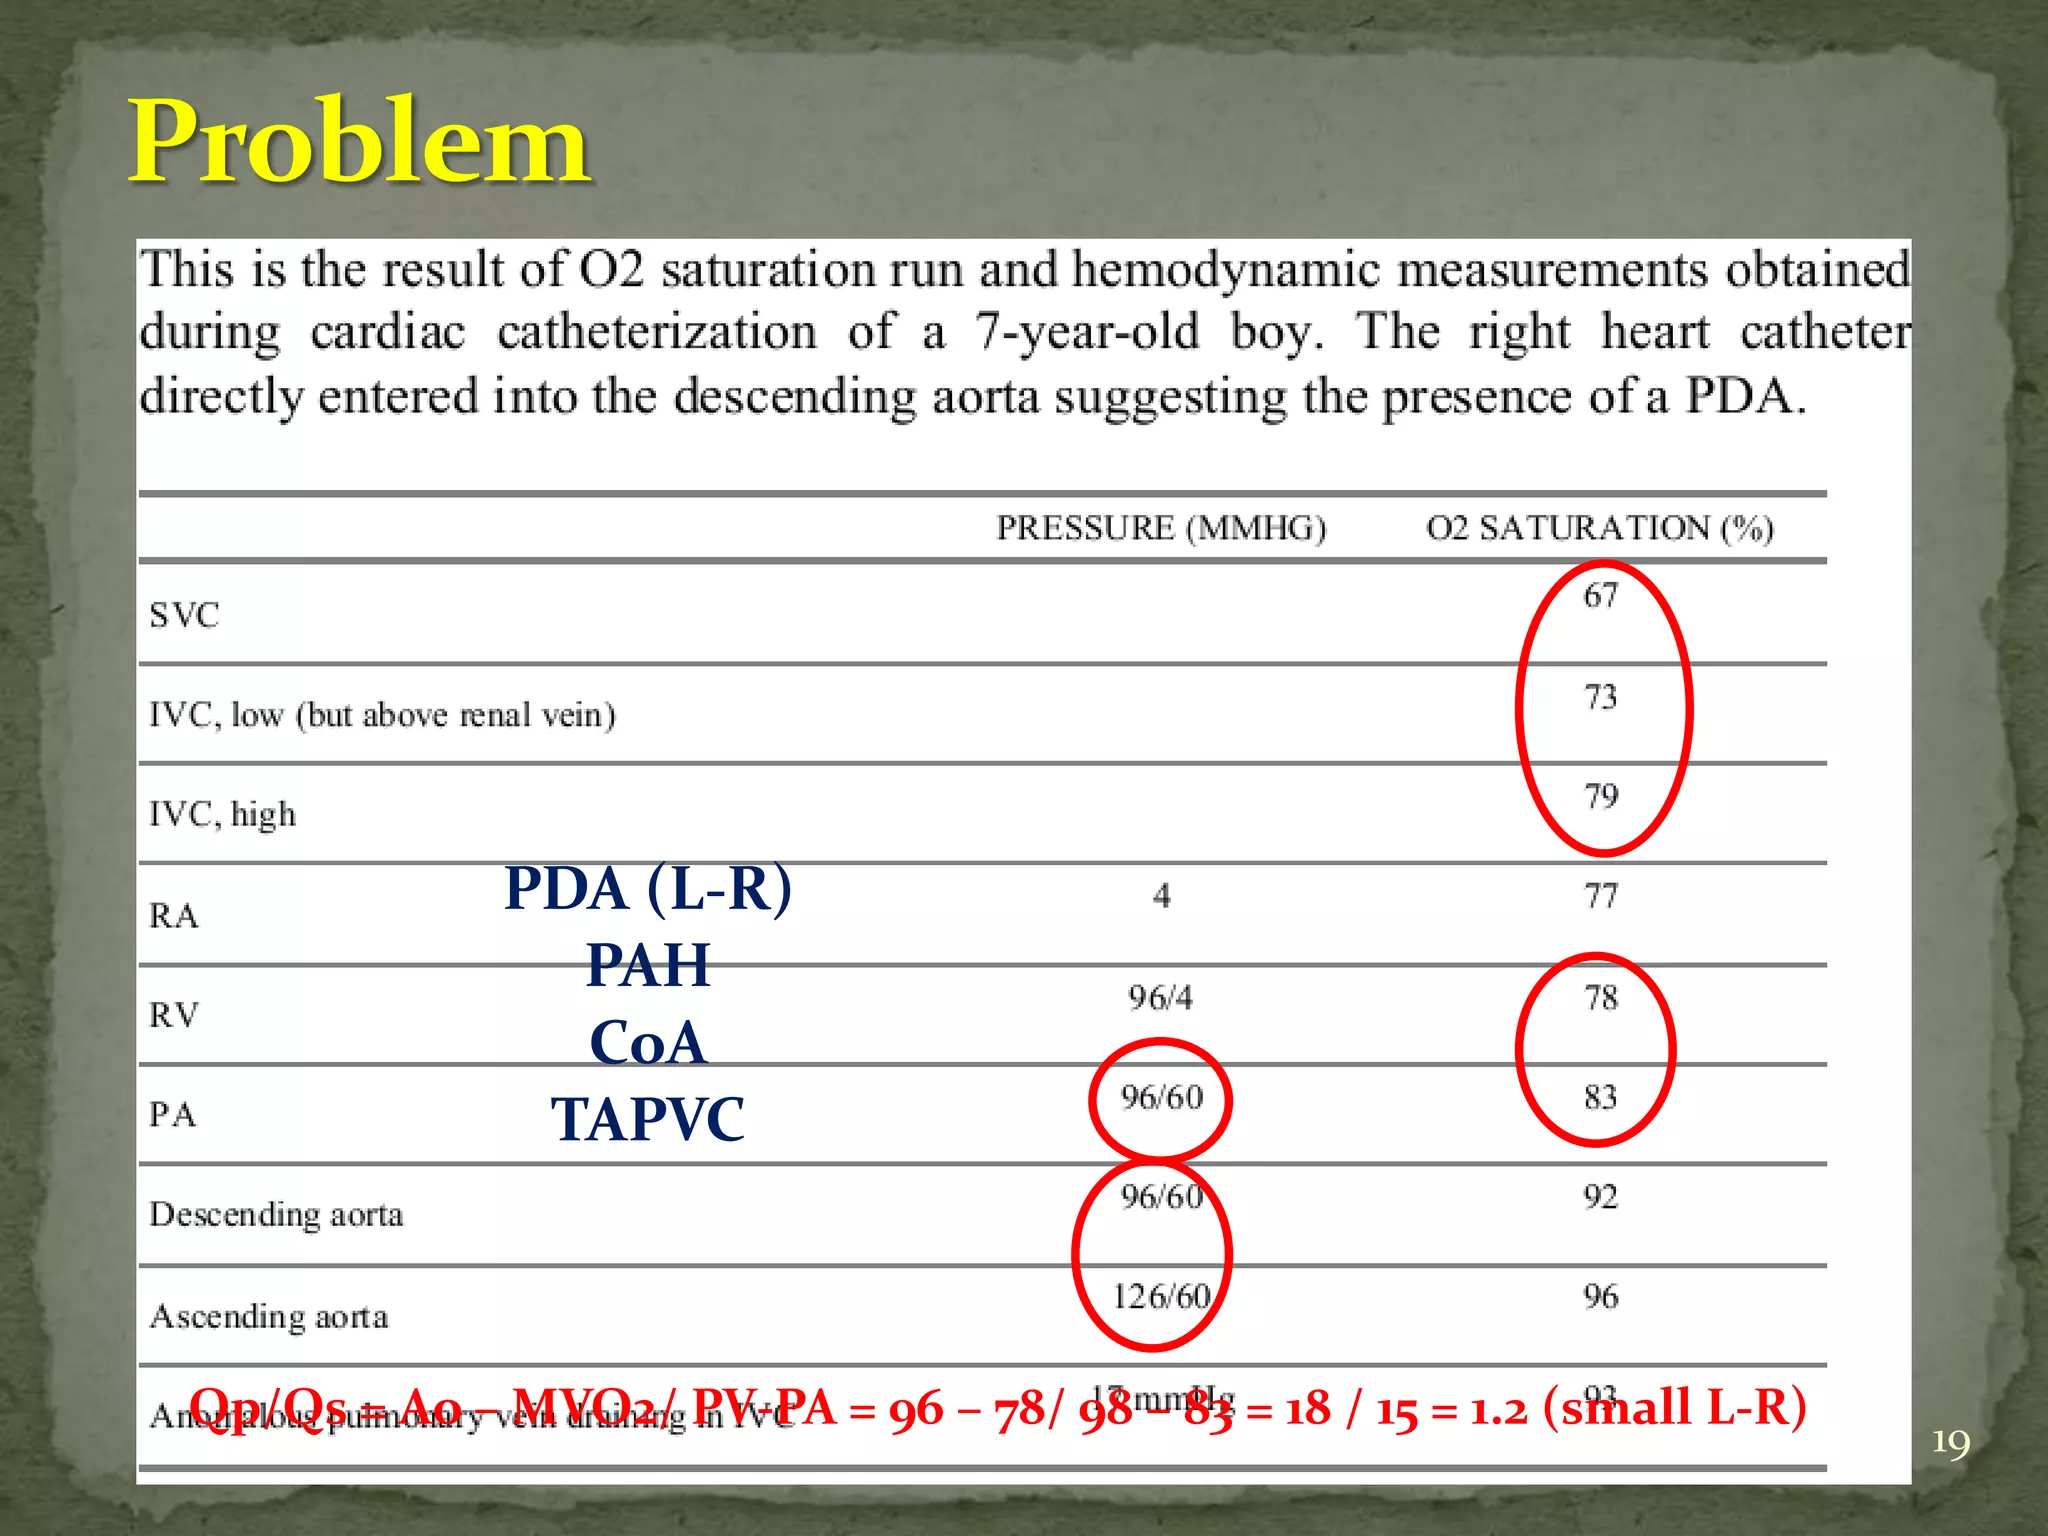
- A case example is presented of a patient evaluated for pulmonary