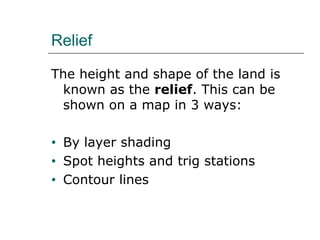
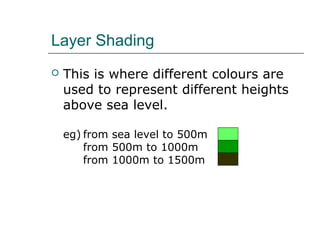
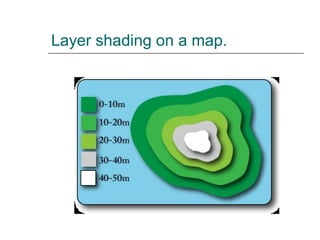
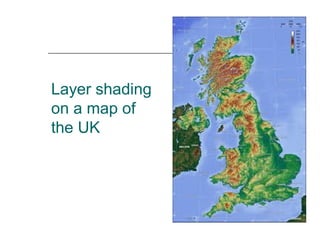
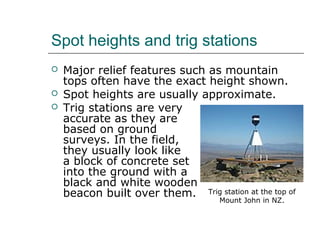
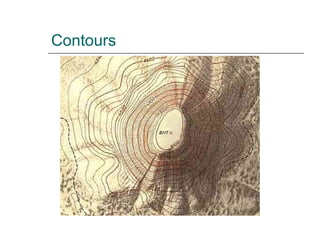
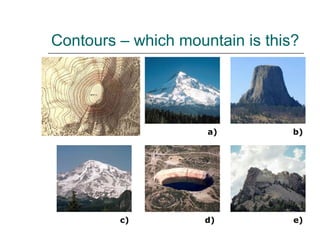
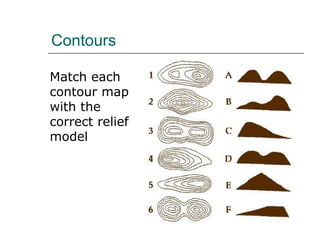
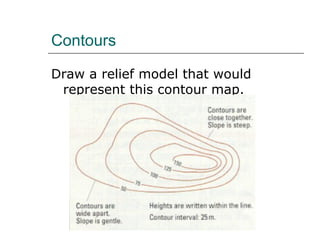
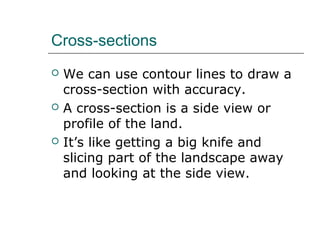
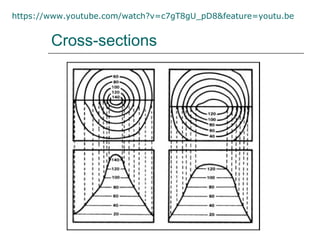
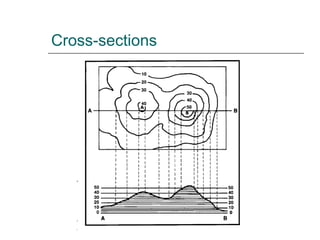
Height on Maps 
Contour lines 
Cross sections
Relief 
The height and shape of the land is 
known as the relief. This can be 
shown on a map in 3 ways: 
• By layer shading 
• Spot heights and trig stations 
• Contour lines
Layer Shading 
 This is where different colours are 
used to represent different heights 
above sea level. 
eg) from sea level to 500m 
from 500m to 1000m 
from 1000m to 1500m
Layer shading on a map.
Layer shading 
on a map of 
the UK
Spot heights and trig stations 
 Major relief features such as mountain 
tops often have the exact height shown. 
 Spot heights are usually approximate. 
 Trig stations are very 
accurate as they are 
based on ground 
surveys. In the field, 
they usually look like 
a block of concrete set 
into the ground with a 
black and white wooden 
beacon built over them. Trig station at the top of 
Mount John in NZ.
Contours 
 These are brown lines on a map that join 
places with the same height. 
 Every point along a contour line is the 
same height as is stated. 
 Lines are drawn at common intervals. 
 The closer the contours are together, the 
steeper the slope. 
 The contour interval is always constant 
(the same).
Contours
Contours – which mountain is this? 
a) b) 
c) d) e)
Contours 
Match each 
contour map 
with the 
correct relief 
model
Contours 
Draw a relief model that would 
represent this contour map.
Cross-sections 
 We can use contour lines to draw a 
cross-section with accuracy. 
 A cross-section is a side view or 
profile of the land. 
 It’s like getting a big knife and 
slicing part of the landscape away 
and looking at the side view.
https://www.youtube.com/watch?v=c7gT8gU_pD8&feature=youtu.be 
Cross-sections
Cross-sections

height on maps contours

  • 1.
    Height on Maps Contour lines Cross sections
  • 2.
    Relief The heightand shape of the land is known as the relief. This can be shown on a map in 3 ways: • By layer shading • Spot heights and trig stations • Contour lines
  • 3.
    Layer Shading This is where different colours are used to represent different heights above sea level. eg) from sea level to 500m from 500m to 1000m from 1000m to 1500m
  • 4.
  • 5.
    Layer shading ona map of the UK
  • 6.
    Spot heights andtrig stations  Major relief features such as mountain tops often have the exact height shown.  Spot heights are usually approximate.  Trig stations are very accurate as they are based on ground surveys. In the field, they usually look like a block of concrete set into the ground with a black and white wooden beacon built over them. Trig station at the top of Mount John in NZ.
  • 7.
    Contours  Theseare brown lines on a map that join places with the same height.  Every point along a contour line is the same height as is stated.  Lines are drawn at common intervals.  The closer the contours are together, the steeper the slope.  The contour interval is always constant (the same).
  • 8.
  • 9.
    Contours – whichmountain is this? a) b) c) d) e)
  • 10.
    Contours Match each contour map with the correct relief model
  • 11.
    Contours Draw arelief model that would represent this contour map.
  • 12.
    Cross-sections  Wecan use contour lines to draw a cross-section with accuracy.  A cross-section is a side view or profile of the land.  It’s like getting a big knife and slicing part of the landscape away and looking at the side view.
  • 13.
  • 14.

Editor's Notes

  • #12 Ex 5, pg 30, “Geography 1.4” Evans & Osborne Ex 6, pg 31, “Geography 1.4” Evans & Osborne
  • #14 Photocopy pg 32 “Geography 1.4” Evans & Osborne for students to glue into books – instructions for drawing a cross-section.
  • #15 Ex 7-8, pg 33-34, “Geography 1.4” Evans & Osborne