Downloaded 173 times

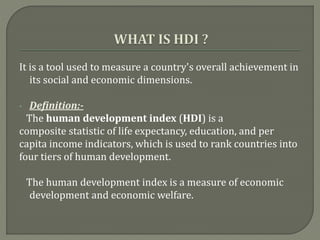


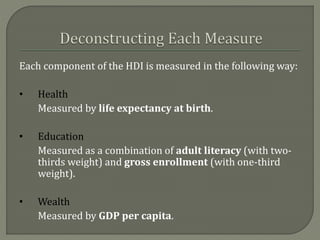


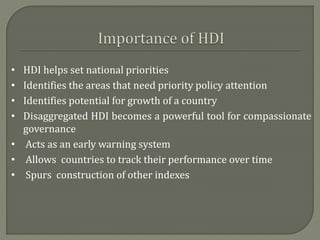


The document discusses India's ranking in the Human Development Index (HDI). It provides details on: 1) India's HDI ranking of 130th out of 188 countries in 2015, up from 135th in 2014, due to rises in life expectancy and income. 2) Key components and methodology used to calculate HDI scores. 3) India's improvements and challenges in areas measured by HDI like education, health, income, and gender inequality.