Human
Development
Index
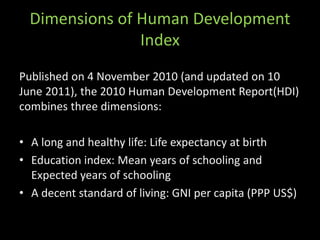
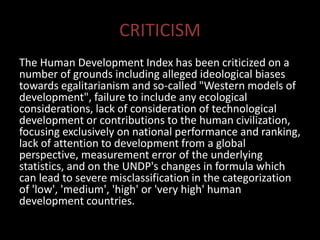
The Human Development Index (HDI) is a
composite statistic of life expectancy, education,
and income per capita indicators, which are
used to rank countries into four tiers of human
development. A country scores higher HDI when
the life expectancy at birth is longer, the
education period is longer, and the income per
capita is higher.
HISTORY
The origins of the HDI are found in the annual
Development Reports of the United Nations
Development Programme (UNDP). These were
devised and launched by Pakistani economist
Mahbub ul Haq in 1990 and had the explicit
purpose "to shift the focus of development
economics from national income accounting to
people-centered policies". To produce the
Human Development Reports, Mahbub ul Haq
formed a group of development economists
including Paul Streeten, Frances Stewart,
Gustav Ranis, Keith Griffin, Sudhir Anand, and
Meghnad Desai. Working alongside Nobel
laureate Amartya Sen, they worked on
capabilities and functions that provided the
underlying conceptual framework.
Haq was sure that a simple composite measure of human
development was needed in order to convince the public,
academics, and politicians that they can and should evaluate
development not only by economic advances but also
improvements in human well-being. Sen initially opposed this
idea, but he soon went on to help Haq develop the Index. Sen
was worried that it was going to be difficult to capture the full
complexity of human capabilities in a single index, but Haq
persuaded him that only a single number would shift the
immediate attention of politicians from economic to human
well-being.
Dimensions of Human Development
Index
Published on 4 November 2010 (and updated on 10
June 2011), the 2010 Human Development Report(HDI)
combines three dimensions:
• A long and healthy life: Life expectancy at birth
• Education index: Mean years of schooling and
Expected years of schooling
• A decent standard of living: GNI per capita (PPP US$)
Calculation of Human Development
Index
Life Expectancy Index (LEI) = LE-20/85-20
LEI is 1 when Life expectancy at birth is 85 and 0
when Life expectancy at birth is 20.
LE: Life Expectancy at Birth
Education Index(EI)= MYSI+EYSI/2
1.Mean Years of Schooling Index (MYSI)= MYS/15
(Fifteen is the projected maximum of this indicator for
2025.)
2.Expected Years of Schooling Index (EYSI)= EYS/ 18
(Eighteen is equivalent to achieving a master’s degree
in most countries.)
MYS: Mean years of schooling (Years that a person 25 years-of-age or older
has spent in schools)
EYS: Expected years of schooling (Years that a 5-year-old child will spend in
schools throughout his life)
Income Index (II)=
In(GNIpc)-In(100)/In(75,000)-In(100)
II is 1 when GNI per capita is $75,000 and 0
when GNI per capita is $100.
GNIpc : Gross national income at purchasing
power parity per capita.
Finally, the HDI is the geometric mean of
the previous three normalized indices:
Geographical coverage of HDI
The HDI has extended its geographical coverage:
David Hastings, of the United Nations Economic
and Social Commission for Asia and the Pacific,
published a report geographically extending the
HDI to 230+ economies, whereas the UNDP HDI
for 2009 enumerates 182 economies and
coverage for the 2010 HDI dropped to 169
countries
Past Top Countries
The list below displays the top-ranked country from each
year of the Human Development Index. Norway has been
ranked the highest twelve times, Canada eight times,
followed by Japan which has been ranked highest three
times. Iceland has been ranked highest twice.
1990-1991- Japan
1992- Canada
1993- Japan
1994-2000- Canada
2001-2006- Norway
2007-2008- Iceland
2009-2015- Norway
CRITICISM
The Human Development Index has been criticized on a
number of grounds including alleged ideological biases
towards egalitarianism and so-called "Western models of
development", failure to include any ecological
considerations, lack of consideration of technological
development or contributions to the human civilization,
focusing exclusively on national performance and ranking,
lack of attention to development from a global
perspective, measurement error of the underlying
statistics, and on the UNDP's changes in formula which
can lead to severe misclassification in the categorization
of 'low', 'medium', 'high' or 'very high' human
development countries.
Economists Hendrik Wolff, Howard Chong and Maximilian
Auffhammer discuss the HDI from the perspective of data
error in the underlying health, education and income statistics
used to construct the HDI.They identified three sources of
data error which are due to (i) data updating, (ii) formula
revisions and (iii) thresholds to classify a country’s
development status and conclude that 11%, 21% and 34% of
all countries can be interpreted as currently misclassified in
the development bins due to the three sources of data error,
respectively. The authors suggest that the United Nations
should discontinue the practice of classifying countries into
development bins because - they claim - the cut-off values
seem arbitrary, can provide incentives for strategic behavior in
reporting official statistics, and have the potential to misguide
politicians, investors, charity donors and the public who use
the HDI at large.
In 2010 the UNDP reacted to the criticism and updated
the thresholds to classify nations as low, medium, and
high human development countries. In a comment to The
Economist in early January 2011, the Human
Development Report Office responded to a January 6,
2011 article in the magazine which discusses the Wolff et
al. paper. The Human Development Report Office states
that they undertook a systematic revision of the methods
used for the calculation of the HDI and that the new
methodology directly addresses the critique by Wolff et
al. in that it generates a system for continuous updating
of the human development categories whenever formula
or data revisions take place.
Thank you.

Human development Index

  • 1.
  • 2.
    The Human DevelopmentIndex (HDI) is a composite statistic of life expectancy, education, and income per capita indicators, which are used to rank countries into four tiers of human development. A country scores higher HDI when the life expectancy at birth is longer, the education period is longer, and the income per capita is higher.
  • 3.
    HISTORY The origins ofthe HDI are found in the annual Development Reports of the United Nations Development Programme (UNDP). These were devised and launched by Pakistani economist Mahbub ul Haq in 1990 and had the explicit purpose "to shift the focus of development economics from national income accounting to people-centered policies". To produce the Human Development Reports, Mahbub ul Haq formed a group of development economists including Paul Streeten, Frances Stewart, Gustav Ranis, Keith Griffin, Sudhir Anand, and Meghnad Desai. Working alongside Nobel laureate Amartya Sen, they worked on capabilities and functions that provided the underlying conceptual framework.
  • 4.
    Haq was surethat a simple composite measure of human development was needed in order to convince the public, academics, and politicians that they can and should evaluate development not only by economic advances but also improvements in human well-being. Sen initially opposed this idea, but he soon went on to help Haq develop the Index. Sen was worried that it was going to be difficult to capture the full complexity of human capabilities in a single index, but Haq persuaded him that only a single number would shift the immediate attention of politicians from economic to human well-being.
  • 5.
    Dimensions of HumanDevelopment Index Published on 4 November 2010 (and updated on 10 June 2011), the 2010 Human Development Report(HDI) combines three dimensions: • A long and healthy life: Life expectancy at birth • Education index: Mean years of schooling and Expected years of schooling • A decent standard of living: GNI per capita (PPP US$)
  • 6.
    Calculation of HumanDevelopment Index Life Expectancy Index (LEI) = LE-20/85-20 LEI is 1 when Life expectancy at birth is 85 and 0 when Life expectancy at birth is 20. LE: Life Expectancy at Birth
  • 7.
    Education Index(EI)= MYSI+EYSI/2 1.MeanYears of Schooling Index (MYSI)= MYS/15 (Fifteen is the projected maximum of this indicator for 2025.) 2.Expected Years of Schooling Index (EYSI)= EYS/ 18 (Eighteen is equivalent to achieving a master’s degree in most countries.) MYS: Mean years of schooling (Years that a person 25 years-of-age or older has spent in schools) EYS: Expected years of schooling (Years that a 5-year-old child will spend in schools throughout his life)
  • 8.
    Income Index (II)= In(GNIpc)-In(100)/In(75,000)-In(100) IIis 1 when GNI per capita is $75,000 and 0 when GNI per capita is $100. GNIpc : Gross national income at purchasing power parity per capita.
  • 9.
    Finally, the HDIis the geometric mean of the previous three normalized indices:
  • 10.
    Geographical coverage ofHDI The HDI has extended its geographical coverage: David Hastings, of the United Nations Economic and Social Commission for Asia and the Pacific, published a report geographically extending the HDI to 230+ economies, whereas the UNDP HDI for 2009 enumerates 182 economies and coverage for the 2010 HDI dropped to 169 countries
  • 11.
    Past Top Countries Thelist below displays the top-ranked country from each year of the Human Development Index. Norway has been ranked the highest twelve times, Canada eight times, followed by Japan which has been ranked highest three times. Iceland has been ranked highest twice. 1990-1991- Japan 1992- Canada 1993- Japan 1994-2000- Canada 2001-2006- Norway 2007-2008- Iceland 2009-2015- Norway
  • 12.
    CRITICISM The Human DevelopmentIndex has been criticized on a number of grounds including alleged ideological biases towards egalitarianism and so-called "Western models of development", failure to include any ecological considerations, lack of consideration of technological development or contributions to the human civilization, focusing exclusively on national performance and ranking, lack of attention to development from a global perspective, measurement error of the underlying statistics, and on the UNDP's changes in formula which can lead to severe misclassification in the categorization of 'low', 'medium', 'high' or 'very high' human development countries.
  • 13.
    Economists Hendrik Wolff,Howard Chong and Maximilian Auffhammer discuss the HDI from the perspective of data error in the underlying health, education and income statistics used to construct the HDI.They identified three sources of data error which are due to (i) data updating, (ii) formula revisions and (iii) thresholds to classify a country’s development status and conclude that 11%, 21% and 34% of all countries can be interpreted as currently misclassified in the development bins due to the three sources of data error, respectively. The authors suggest that the United Nations should discontinue the practice of classifying countries into development bins because - they claim - the cut-off values seem arbitrary, can provide incentives for strategic behavior in reporting official statistics, and have the potential to misguide politicians, investors, charity donors and the public who use the HDI at large.
  • 14.
    In 2010 theUNDP reacted to the criticism and updated the thresholds to classify nations as low, medium, and high human development countries. In a comment to The Economist in early January 2011, the Human Development Report Office responded to a January 6, 2011 article in the magazine which discusses the Wolff et al. paper. The Human Development Report Office states that they undertook a systematic revision of the methods used for the calculation of the HDI and that the new methodology directly addresses the critique by Wolff et al. in that it generates a system for continuous updating of the human development categories whenever formula or data revisions take place.
  • 15.