
Recommended
More Related Content
Similar to human-development-index.pptx
Similar to human-development-index.pptx (20)
More from RumputBiru
Recently uploaded
Recently uploaded (20)
human-development-index.pptx
- 2. GROWTH AND DEVELOPMENT Both growth and development refer tochangesovera period of time. Growth :- Quantitative and value neutral change. Positive or a negativesign. Development :- Qualitative changewhich is alwaysvalue positive. Developmentoccurs when positive growth takes place. For example, if the population of a city grows from one lakh to two lakhs over a period of time, wesay thecity hasgrown. However, if facilities like housing, provision of basic services and other characteristics remain the same, then this growth has not been accompanied by development.
- 3. The quality of life people enjoy in a country, the opportunities they have and freedoms they enjoy, are important aspects ofdevelopment. The concept of human developmentwas introduced by Dr. Mahbub-ul-haq. Dr. Haq has described human development as development that enlarges people’s choices and improves theirlives.
- 4. Access to resources, health and educationare the key areas in humandevelopment.
- 5. FOUR PILLARS OF HUMAN DEVELOPEMNT Just as any building is supported by pillars, the idea of human development is supported by the concepts of equity, sustainability, productivity andempowerment. Equity refers to making equal access to opportunities available to everybody. means continuity in the availability of Sustainability opportunities. Productivity here means human labour productivity or productivity in terms of humanwork. Empowerment means to havethe powerto makechoices.
- 6. WHAT IS HDI ? It is a tool used to measure a country's overall achievement in its social and economicdimensions. Definition:- The human development index (HDI) is a composite statistic of life expectancy, education, and per capita income indicators, which is used to rank countries into four tiers of humandevelopment. The human development index is a measure of economic development and economicwelfare.
- 7. ORIGIN OF HDI Devised and launched by Pakistani economist Mahbub-ul- haq in 1990. Amartya Sen and Mahbub –ul- haq worked upon the capabilities and functioning which provided conceptualframework. Published by United Nations Development Programme (UNDP). MAHBUB –UL- HAQ AMARTYA SEN
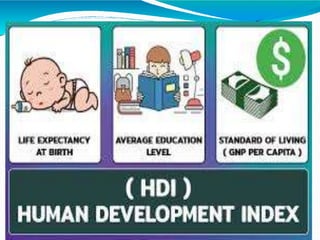
- 8. FACTORS CONSIDERED FOR HDI
- 9. The human development indexexamines three importantcriteriaof economic development 1) Life expectancy 2) Education 3) Income levels Create an overall score between 0 and1. 1 - indicates a high level of economicdevelopment. 0- a very lowlevel.
- 10. MEASURING HUMAN DEVELOPMENT The human development index (HDI) ranks the countries based on their performance in the key areas of health, education and access toresources. Health :- The indicator chosen to assess health is the life expectancy atbirth. A higher life expectancy means that people have a greater chance of living longer and healthierlives.
- 11. Education :- The adult literacyrate and thegrossenrolmentratio represent access toknowledge. The numberof adults who areable to read and writeand the number of children enrolled in schools show how easy or difficult it is toaccess knowledge in a particularcountry. Access to resources is measured in termsof purchasing power (in U.S. Dollars).
- 13. Example : Calculating HDI of India. Life expectancy index = 0.679 Education index = 0.495 Income index = 0.599 HDI = (LI * EI * II)^1/3 HDI = (0.679 * 0.495 * 0.599)^1/3 = 0.586
- 14. INTERNATIONAL COMPARISONS Often smallercountries havedone betterthan larger ones in humandevelopment. Similarly, relatively poorer nations have beenranked higher than richer neighbours in terms of human development. For example, Sri Lanka, Trinidad and Tobago havea higher rank than India in the human development index despite having smallereconomies. Similarly, within India, Kerala performs muchbetter than Punjab and Gujarat in human development despite having lower per capitaincome.
- 15. Ranking base:- Globally countries are divided in the following four classes according to their score in human development index–
- 16. GLOBAL HDI RANKINGS- TOP TEN COUNTRIES RANK COUNTRIES HDI 1 NORWAY 0.944 2 AUSTRALIA 0.933 3 SWITZERLAND 0.917 4 NETHERLANDS 0.915 5 UNITED STATES 0.914 6 GERMANY 0.911 7 NEW ZELAND 0.910 8 CANADA 0.902 9 SINGAPORE 0.901 10 DENMARK 0.900
- 17. LOWEST TEN COUNTRIES IN HDI RANK COUNTRIES HDI 178 MOZAMBIQUE 0.393 179 GUINEA 0.392 180 BURUNDI 0.389 181 BURKINA FASO 0.388 182 ERITERIA 0.381 183 SIERRA LEONE 0.374 184 CHAD 0.372 185 CENTRAL AFRICAN REPUBLIC 0.341 186 CONGO 0.338 187 NIGER 0.337
- 18. HDI ASPECTS OF INDIA India ranks (2014) – 135 HDI – 0.586 Gain of 0.003 HDI from previous year. Comes under medium human developmentcountries. Indicators: - Life expectancy at birth(by UN). Overall – 64.19 years(Rank 147). male – 62.80 years. Female – 65.73 years. Education index : 0.473 . Mean years of schooling : 5.1(rank 65). GNI(Gross National Income)per capita at PPP :$5350 (rank 127) .
- 19. HDI PROGRAMME IN INDIA Unique in it’skind. Preparation of not only national report, but also sub-national human development reports (HDR). Decentralized and integrated the human development concept into its developmentagendaat national, state, as well asdistrict level . More HDRs have been produced in India than the total number of global HDRs. Plan is made by the Planning Commission –United Nations Development Programme(UNDP) partnership through the and preparation of State Human Development Reports (SHDR) District Human Development Reports(DHDR).
- 20. 8th five year Human development programme started in plan(1992-1997). First state - Madhya Pradesh. The world’s first state HDR was published in Madhya Pradesh in 1995 . Computation of the state’s HDI as well as HDI for all the districts in the state made bystategovt. So far 21 states have preparedHDRs. State governments have initiated the work on district HDRs for 80 districts of which 23 HDRs have been released tilldate, 2009 -The first city HDR (Mumbai) waslaunched.
- 21. TREND’S IN INDIA’S HDI
- 22. HDI of different states in India HDI-STATE WISE
- 23. LIFE EXPECTANCY STATEWISE State Life expectancy(YEARS) Kerala 74.0 Punjab 69.4 Maharashtra 67.2 Jharkhand , Chhattisgarh , Madhya Pradesh 58.0
- 24. KERALA – THE HIGHEST HDI STATE HDI - 0.764 LITERACY RATE – 93.91 % LIFE EXPECTANCY – 74 years. HIGHEST SEX RATIO – 1084/1000 . LEAST CORRUPTED STATE. CLEANEST AND HEALTHIEST STATE.
- 25. IMPORTANCE OF HDI The HDI gives an overall indexof economicdevelopment. It does give a rough ability to make comparisons on issues of economicwelfare – much more than just using GDP statisticsshow. It gives idea regarding areas of development which requires improvement. Statisticsgives betterdecision making forareas having wide disparity. More focus on social & human development rather than only capital accumulation and growth.
- 26. LIMITATIONS OF HDI Wide divergence within countries. For example, countries like China and Kenya have widely different HDI scores depending on the region in question. (e.g. :- North china poorer than southeast). Economic welfare depends on several other factors, such as – threat of war, levels of pollution, access to clean drinking water etc. GNI does not show how the income is spent by the government. Some countries spend more on military than on healthcare.
- 27. When knowledge is measured it only takes into account what children learn at school not in the family. And so maybe knowledge statistics may be distorted if the family play more of a role in education in thehome. Longevity can also be distorted as the life expectancy of a person does not consider how healthy the lifewas led. Life expectancy value for a country is the given is an average of the total population. There are many communities in the country that will not all have access to good healthcare services and so there will be variations of life expectancy values.
- 28. THE CASE OF BHUTAN Bhutan is the only country in the world to officially proclaim the gross national happiness (GNH) as the measure of the country’sprogress. Material progress and technological developments are approached more cautiously taking into consideration the possible harm environment or the they other might aspects bring to the of cultural and spiritual life of the Bhutanese.
- 29. This simply means material progress cannot come at the cost of happiness. GNH encourages us to think of the spiritual, non- material and qualitative aspects ofdevelopment.
- 30. WHY INDIA IS LAGGING IN HDI ?? Large number of population in India lives in slums that is around 158 .4 million. 42 % children below 5 years age are underweight and 59 % stunted. Low spending on education by the government. Lack of schemes for urban poor like NRHM etc. India treats its environment poorly . Ranks 125 out of 132 countries in a study done by Yale university.
- 31. CONCLUSION an overall index of economic The HDI gives development. There are certain differences among different states development conditions so there must be equal opportunities fordevelopment forall. Some important issues are missing in HDI such as infrastructure and some economicfactors.