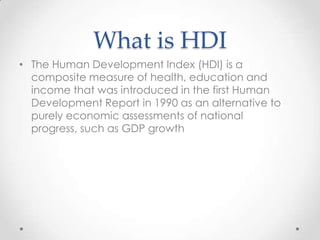
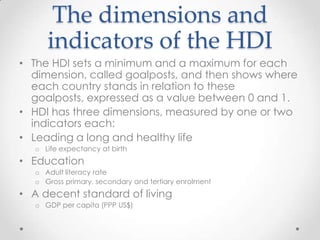
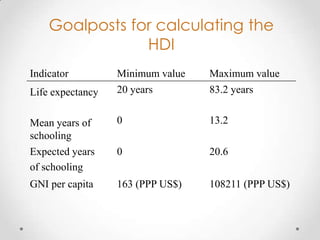
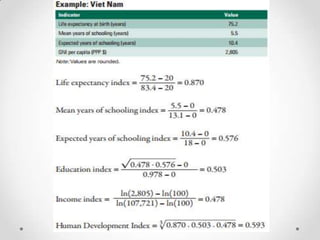
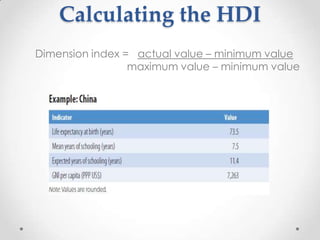
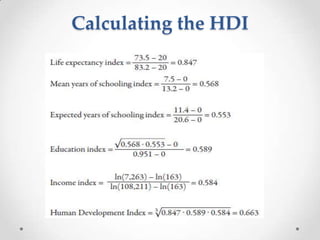
HUMAN
DEVELOPMENT
INDEX
History of the Human
Development Concept
• Re-discovered and presented in the first Global
Human Development Report in 1990 by
distinguished economist Mahbub ul Haq
• And expanded and widely used since then in
particular with many inputs over the years from
Nobel Prize-winning economist Amartya Sen
What is HDI
• The Human Development Index (HDI) is a
composite measure of health, education and
income that was introduced in the first Human
Development Report in 1990 as an alternative to
purely economic assessments of national
progress, such as GDP growth
The dimensions and
indicators of the HDI
• The HDI sets a minimum and a maximum for each
dimension, called goalposts, and then shows where
each country stands in relation to these
goalposts, expressed as a value between 0 and 1.
• HDI has three dimensions, measured by one or two
indicators each:
• Leading a long and healthy life
o Life expectancy at birth

• Education
o Adult literacy rate
o Gross primary, secondary and tertiary enrolment

• A decent standard of living
o GDP per capita (PPP US$)
Calculating the HDI
Dimensions:

A long and
healthy life

Being
Knowledgeable

A decent
standard
of living

Indicators:

Life
Expectancy

MYS &
EYS

GNI
per capita

Dimension
index

Life
Expectancy
Index

Education
Index

GNI
Index

The HDI
Goalposts for calculating the
HDI
Indicator

Minimum value
20 years

Maximum value
83.2 years

Mean years of
schooling
Expected years
of schooling

0

13.2

0

20.6

GNI per capita

163 (PPP US$)

108211 (PPP US$)

Life expectancy
Life expectancy at birth: Number of years a newborn infant could
expect to live if prevailing patterns of age-specific mortality rates at
the time of birth stay the same throughout the infant’s life.

Mean years of schooling: Average number of years of education
received by people ages 25 and older.

Expected years of schooling: Number of years of schooling that
a child of school entrance age can expect to receive if prevailing
patterns of age-specific enrolment rates persist throughout the
child’s life.
Calculating the HDI
Calculating the HDI
Dimension index = actual value – minimum value
maximum value – minimum value
Calculating the HDI
interpretation
• The HDI simplifies the comparison among countries
by combining the achievement on the number of
different variables into a single number.
• The value of the HDI index can vary between 0 and
1, with the HDI score close to zero indicating greater
distance from the maximum to be achieved on the
aggregate of the factors entering the HDI.
• With the HDI score close to one indicating greater
achievement relative to the maximum attainable
on the aggregate of the factors entering the HDI.
Gender Inequality Index
• The Gender Inequality Index (GII) reflects women’s
disadvantage in three dimensions—reproductive
health, empowerment and the labor market
• The index shows the loss in human development
due to inequality between female and male
achievements in these dimensions.
• It ranges from 0, which indicates that women and
men fare equally, to 1, which indicates that women
fare as poorly as possible in all measured
dimensions.
Gender Inequality Index
• The health dimension is measured by two indicators:
maternal mortality ratio and the adolescent fertility rate.
• The empowerment dimension is also measured by two
indicators: the share of parliamentary seats held by
each sex and by secondary and higher education
attainment levels.
• The labor dimension is measured by women’s
participation in the work force.
• The Gender Inequality Index is designed to reveal the
extent to which national achievements in these aspects
of human development are eroded by gender
inequality, and to provide empirical foundations for
policy analysis and advocacy efforts.
Multidimensional Poverty
Index
• The Multidimensional Poverty Index (MPI) identifies
multiple deprivations at the individual level in
health, education and standard of living. It uses
micro data from household surveys, and—unlike the
Inequality-adjusted Human Development Index—all
the indicators needed to construct the measure
must come from the same survey. Each person in a
given household is classified as poor or non-poor
depending on the number of deprivations his or her
household experiences. This data are then
aggregated into the national measure of poverty
Multidimensional Poverty
Index
• The MPI reflects both the prevalence of multidimensional
deprivation, and its intensity—how many deprivations people
experience at the same time.
• It can be used to create a comprehensive picture of people
living in poverty, and permits comparisons both across
countries, regions and the world and within countries by
ethnic group, urban or rural location, as well as other key
household and community characteristics.
• The MPI builds on recent advances in theory and data to
present the first global measure of its kind, and offers a
valuable complement to income-based poverty measures.
• The 2013 Human Development Report (HDR) presents
estimates for 104 countries with a combined population of 5.4
billion (76% of the world total). About 1.6 billion people in the
countries covered—30% of their entire population—lived in
multidimensional poverty between 2002 and 2011.
HUMAN DEVELOPMENT INDEX AND ITS MEASUREMENT

HUMAN DEVELOPMENT INDEX AND ITS MEASUREMENT

  • 1.
  • 2.
    History of theHuman Development Concept • Re-discovered and presented in the first Global Human Development Report in 1990 by distinguished economist Mahbub ul Haq • And expanded and widely used since then in particular with many inputs over the years from Nobel Prize-winning economist Amartya Sen
  • 3.
    What is HDI •The Human Development Index (HDI) is a composite measure of health, education and income that was introduced in the first Human Development Report in 1990 as an alternative to purely economic assessments of national progress, such as GDP growth
  • 4.
    The dimensions and indicatorsof the HDI • The HDI sets a minimum and a maximum for each dimension, called goalposts, and then shows where each country stands in relation to these goalposts, expressed as a value between 0 and 1. • HDI has three dimensions, measured by one or two indicators each: • Leading a long and healthy life o Life expectancy at birth • Education o Adult literacy rate o Gross primary, secondary and tertiary enrolment • A decent standard of living o GDP per capita (PPP US$)
  • 5.
    Calculating the HDI Dimensions: Along and healthy life Being Knowledgeable A decent standard of living Indicators: Life Expectancy MYS & EYS GNI per capita Dimension index Life Expectancy Index Education Index GNI Index The HDI
  • 6.
    Goalposts for calculatingthe HDI Indicator Minimum value 20 years Maximum value 83.2 years Mean years of schooling Expected years of schooling 0 13.2 0 20.6 GNI per capita 163 (PPP US$) 108211 (PPP US$) Life expectancy
  • 7.
    Life expectancy atbirth: Number of years a newborn infant could expect to live if prevailing patterns of age-specific mortality rates at the time of birth stay the same throughout the infant’s life. Mean years of schooling: Average number of years of education received by people ages 25 and older. Expected years of schooling: Number of years of schooling that a child of school entrance age can expect to receive if prevailing patterns of age-specific enrolment rates persist throughout the child’s life.
  • 8.
  • 10.
    Calculating the HDI Dimensionindex = actual value – minimum value maximum value – minimum value
  • 11.
  • 12.
    interpretation • The HDIsimplifies the comparison among countries by combining the achievement on the number of different variables into a single number. • The value of the HDI index can vary between 0 and 1, with the HDI score close to zero indicating greater distance from the maximum to be achieved on the aggregate of the factors entering the HDI. • With the HDI score close to one indicating greater achievement relative to the maximum attainable on the aggregate of the factors entering the HDI.
  • 13.
    Gender Inequality Index •The Gender Inequality Index (GII) reflects women’s disadvantage in three dimensions—reproductive health, empowerment and the labor market • The index shows the loss in human development due to inequality between female and male achievements in these dimensions. • It ranges from 0, which indicates that women and men fare equally, to 1, which indicates that women fare as poorly as possible in all measured dimensions.
  • 14.
    Gender Inequality Index •The health dimension is measured by two indicators: maternal mortality ratio and the adolescent fertility rate. • The empowerment dimension is also measured by two indicators: the share of parliamentary seats held by each sex and by secondary and higher education attainment levels. • The labor dimension is measured by women’s participation in the work force. • The Gender Inequality Index is designed to reveal the extent to which national achievements in these aspects of human development are eroded by gender inequality, and to provide empirical foundations for policy analysis and advocacy efforts.
  • 16.
    Multidimensional Poverty Index • TheMultidimensional Poverty Index (MPI) identifies multiple deprivations at the individual level in health, education and standard of living. It uses micro data from household surveys, and—unlike the Inequality-adjusted Human Development Index—all the indicators needed to construct the measure must come from the same survey. Each person in a given household is classified as poor or non-poor depending on the number of deprivations his or her household experiences. This data are then aggregated into the national measure of poverty
  • 17.
    Multidimensional Poverty Index • TheMPI reflects both the prevalence of multidimensional deprivation, and its intensity—how many deprivations people experience at the same time. • It can be used to create a comprehensive picture of people living in poverty, and permits comparisons both across countries, regions and the world and within countries by ethnic group, urban or rural location, as well as other key household and community characteristics. • The MPI builds on recent advances in theory and data to present the first global measure of its kind, and offers a valuable complement to income-based poverty measures. • The 2013 Human Development Report (HDR) presents estimates for 104 countries with a combined population of 5.4 billion (76% of the world total). About 1.6 billion people in the countries covered—30% of their entire population—lived in multidimensional poverty between 2002 and 2011.