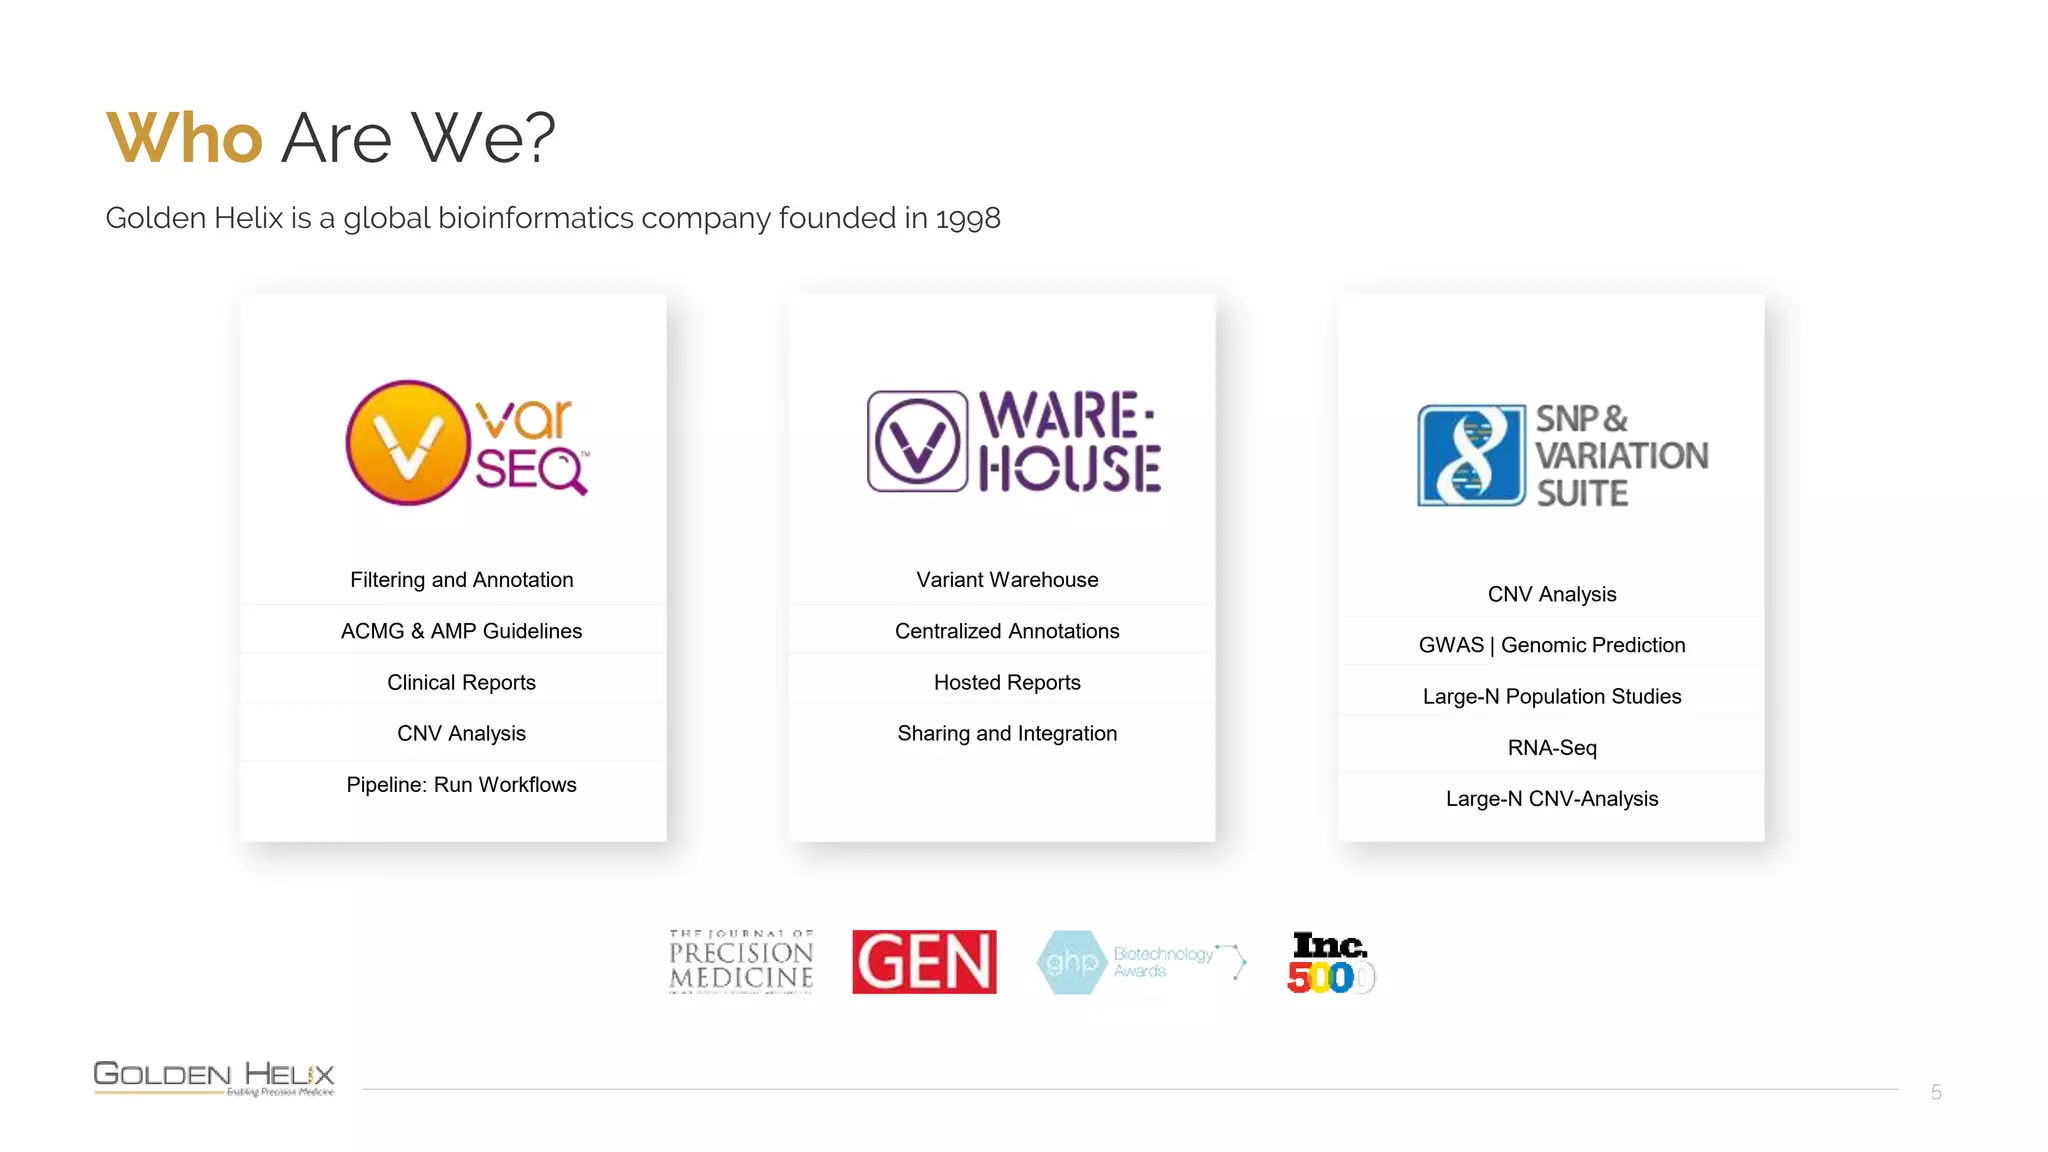
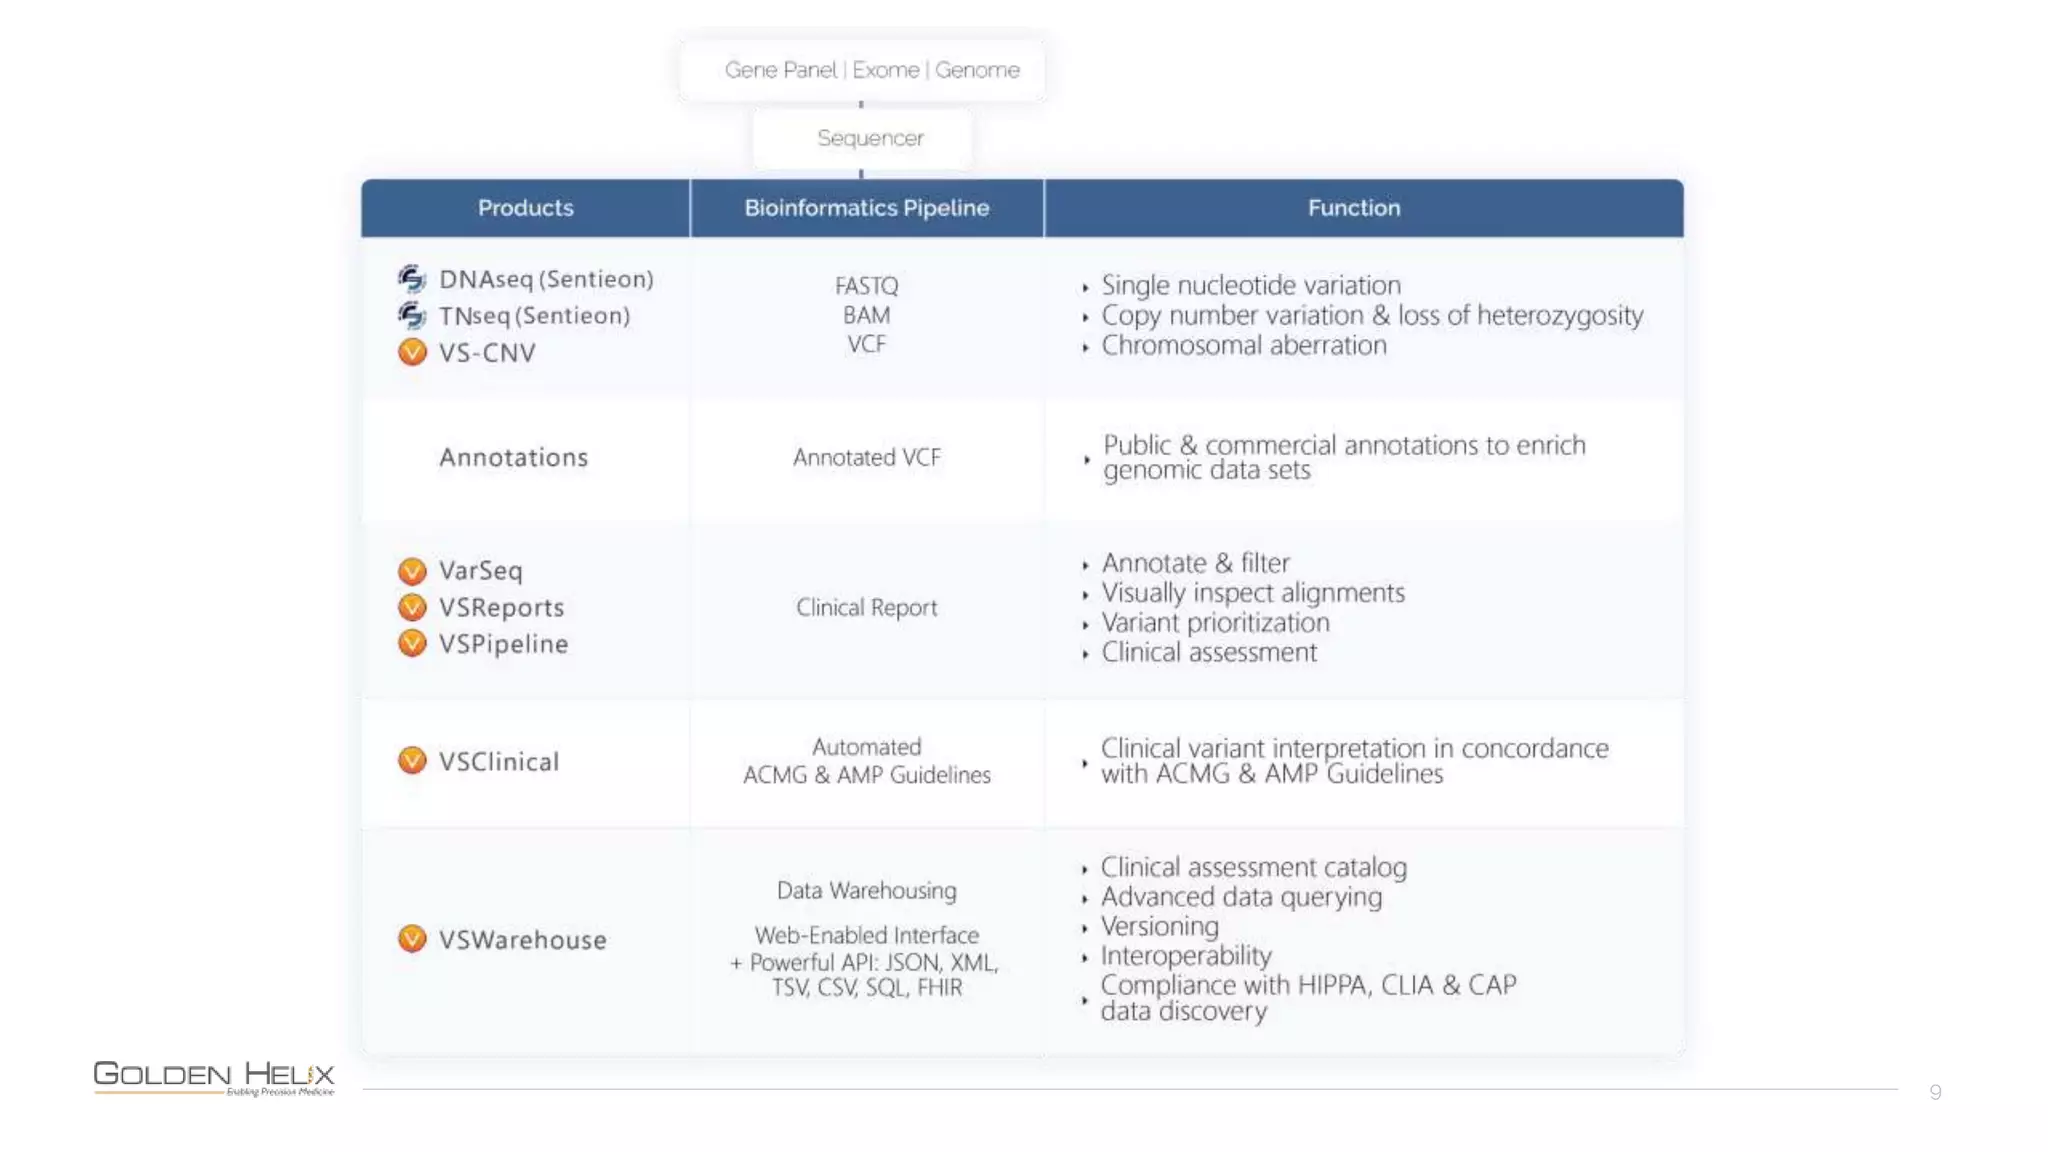
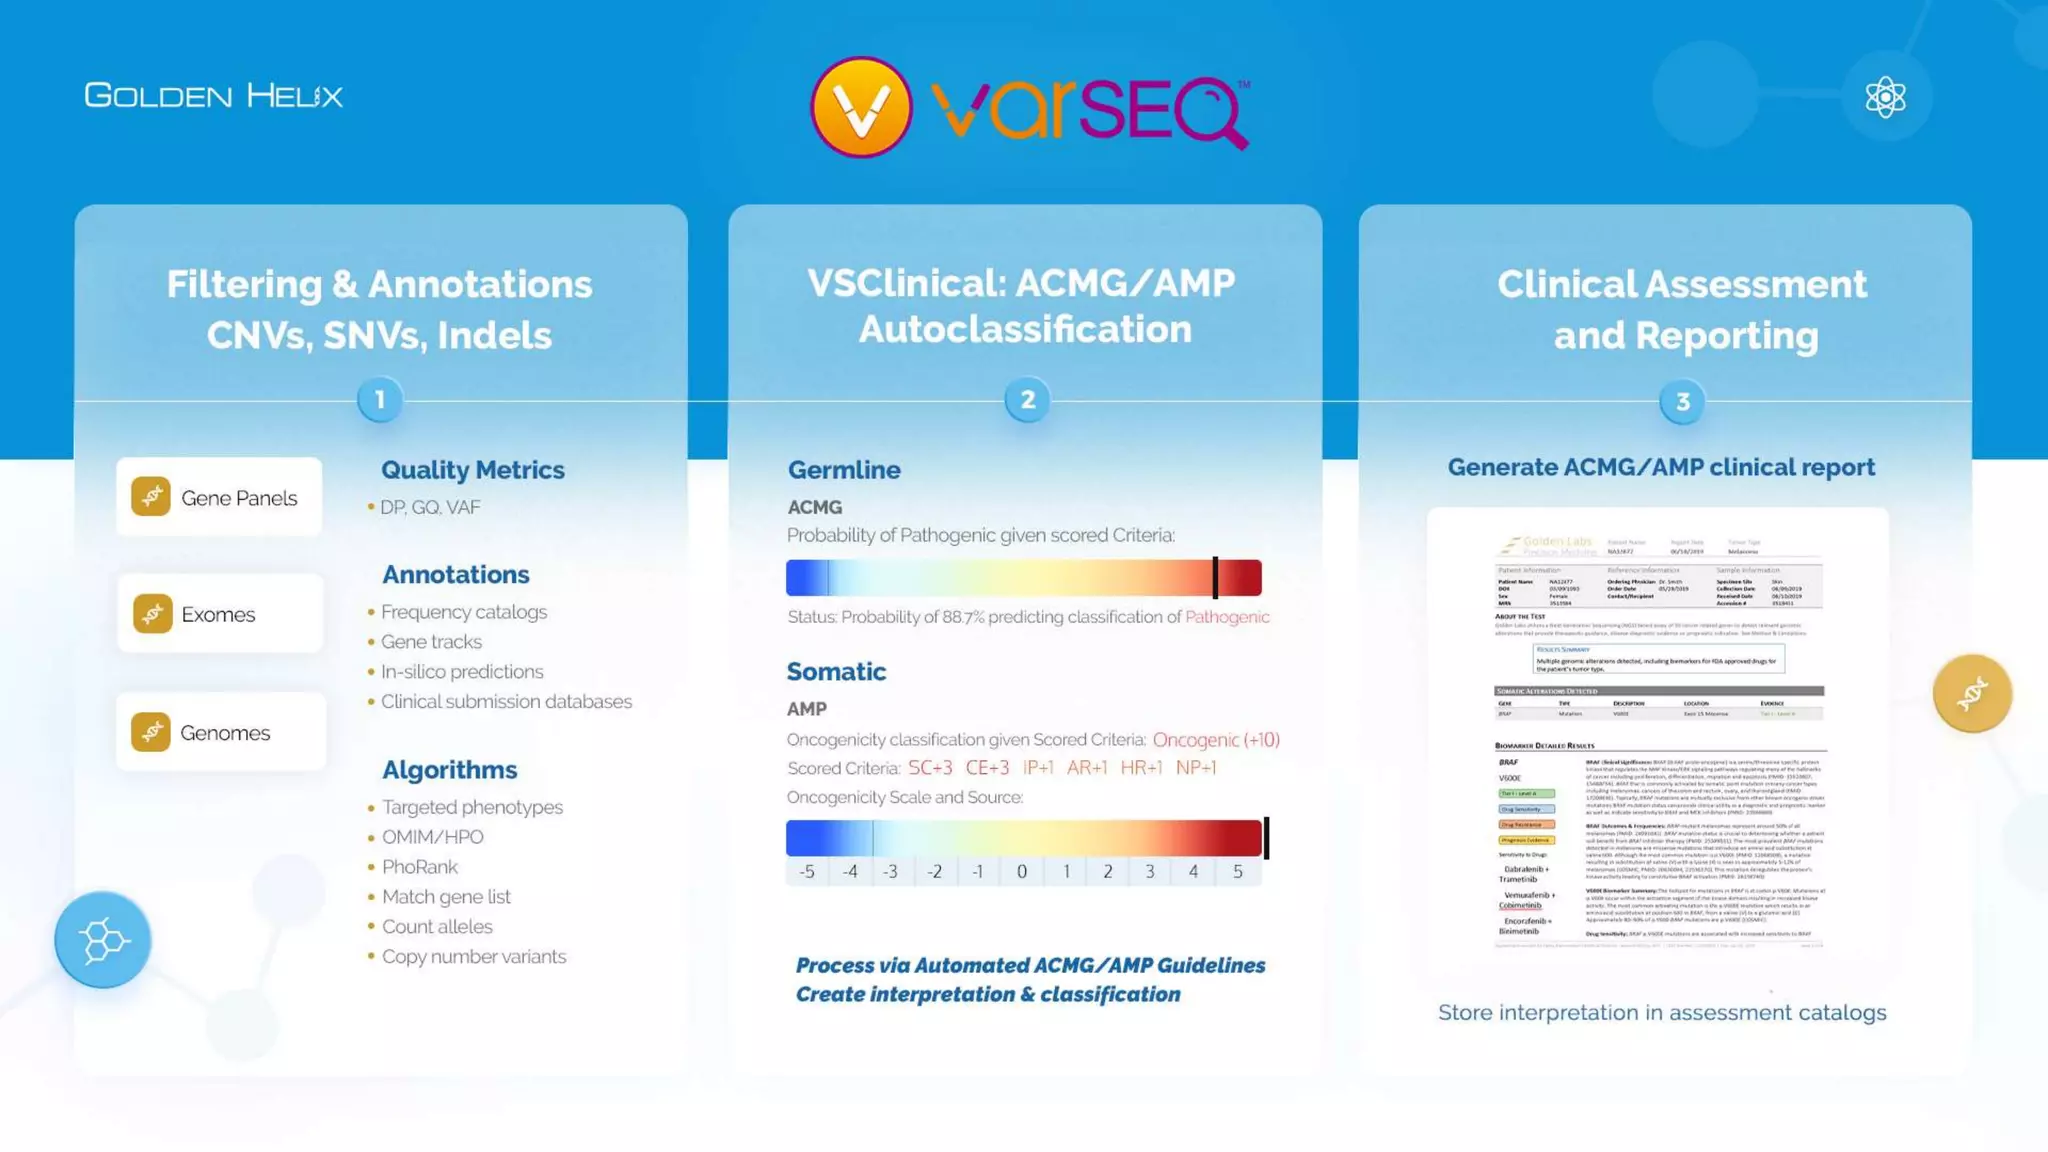
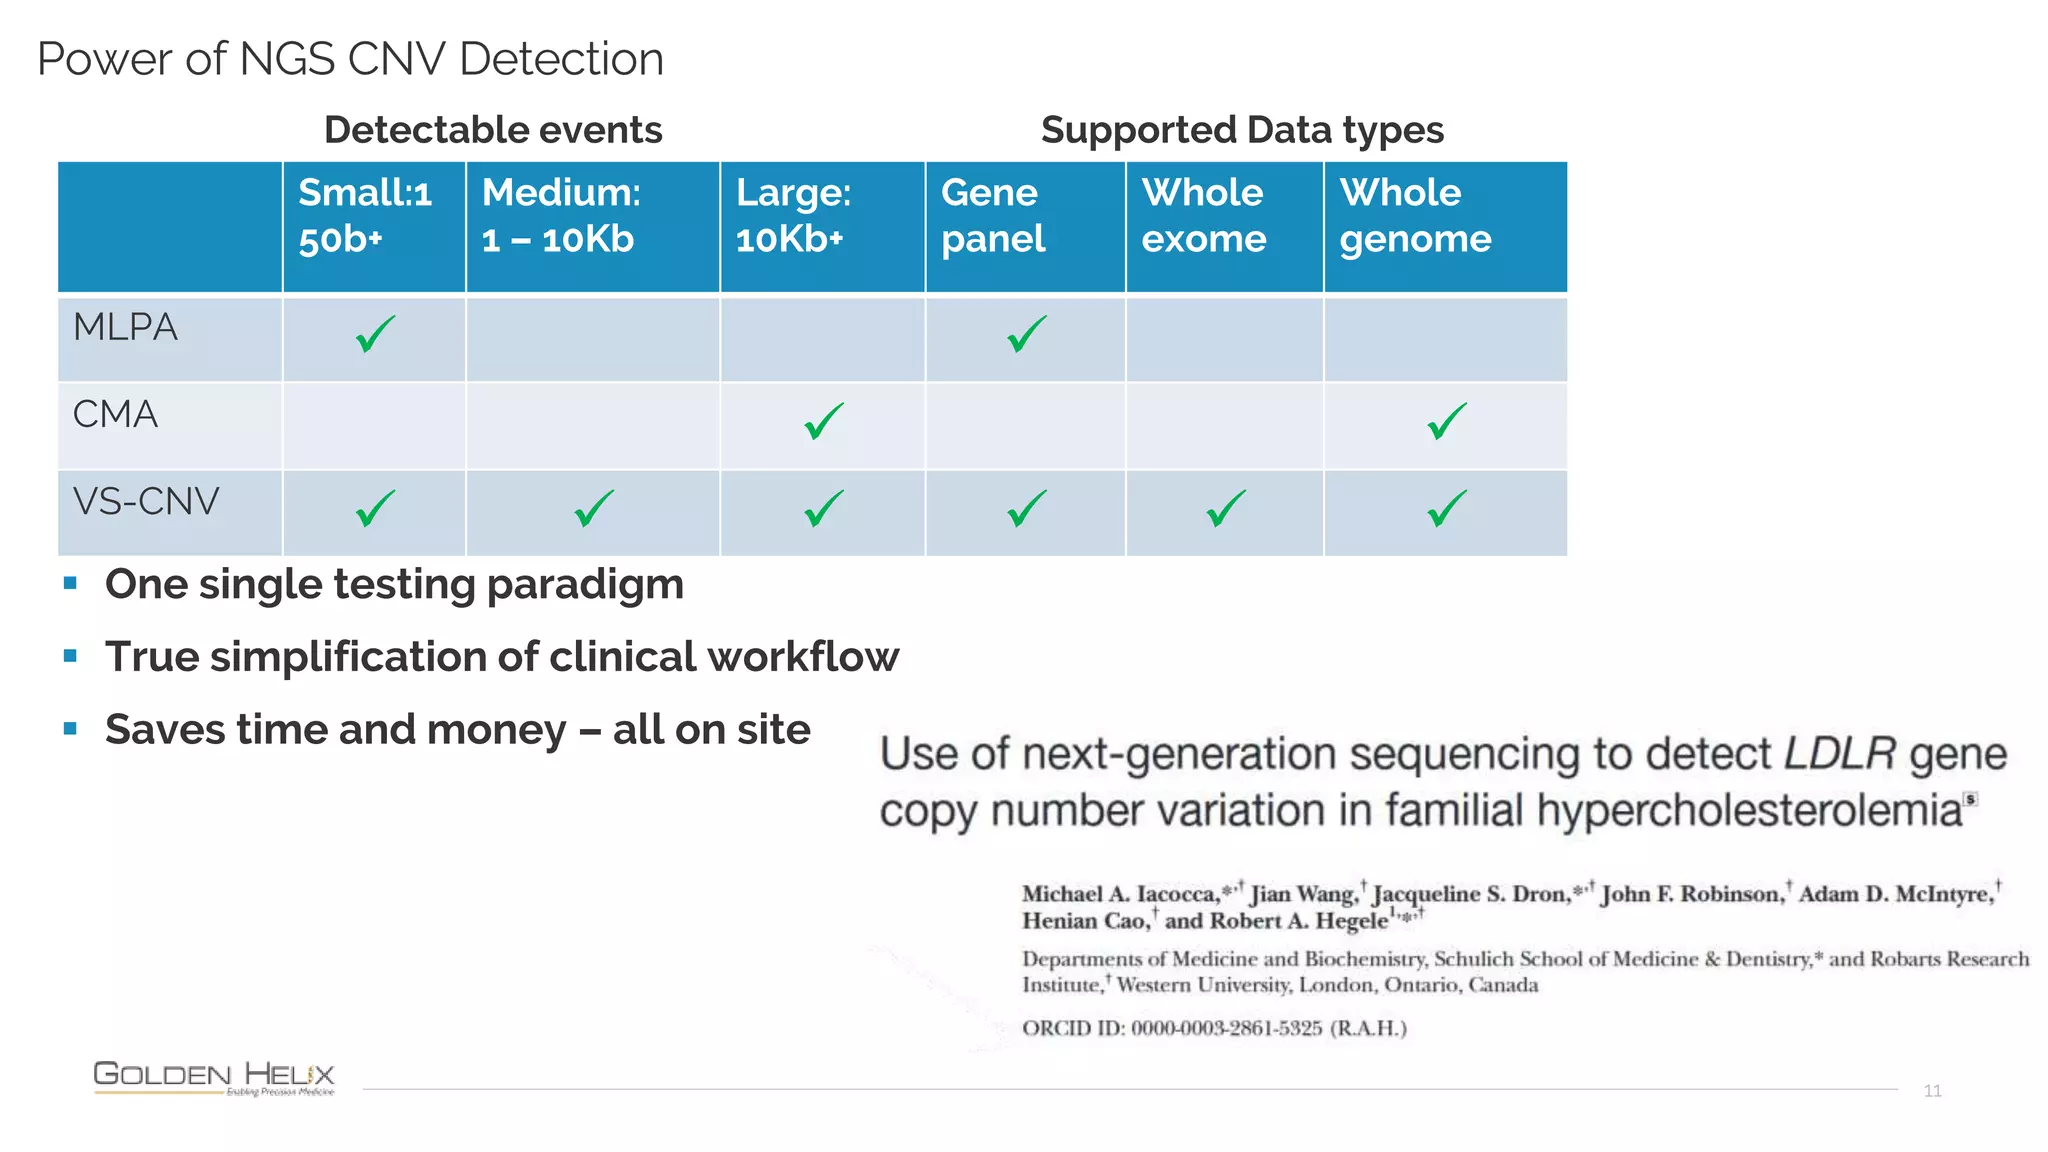
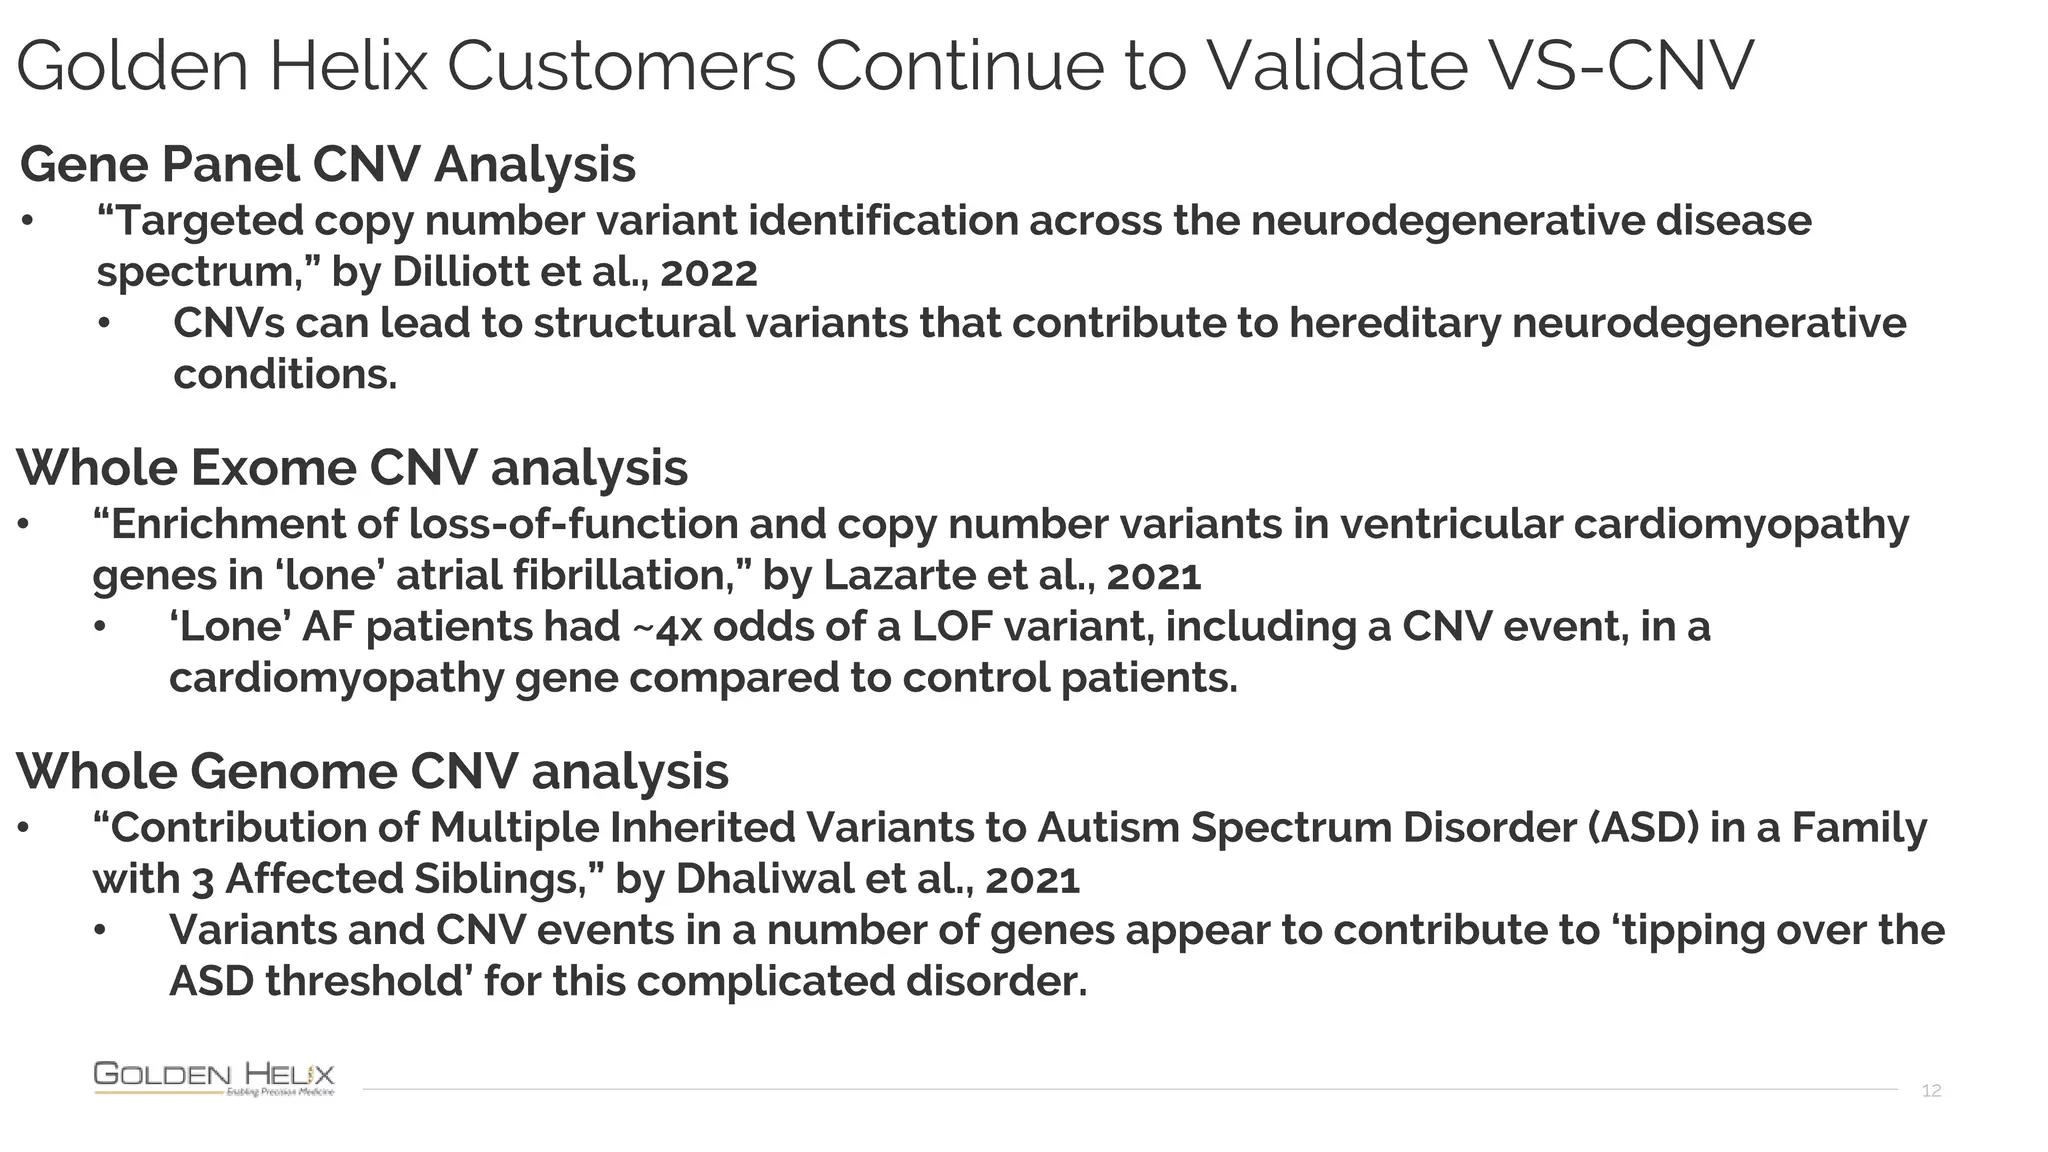
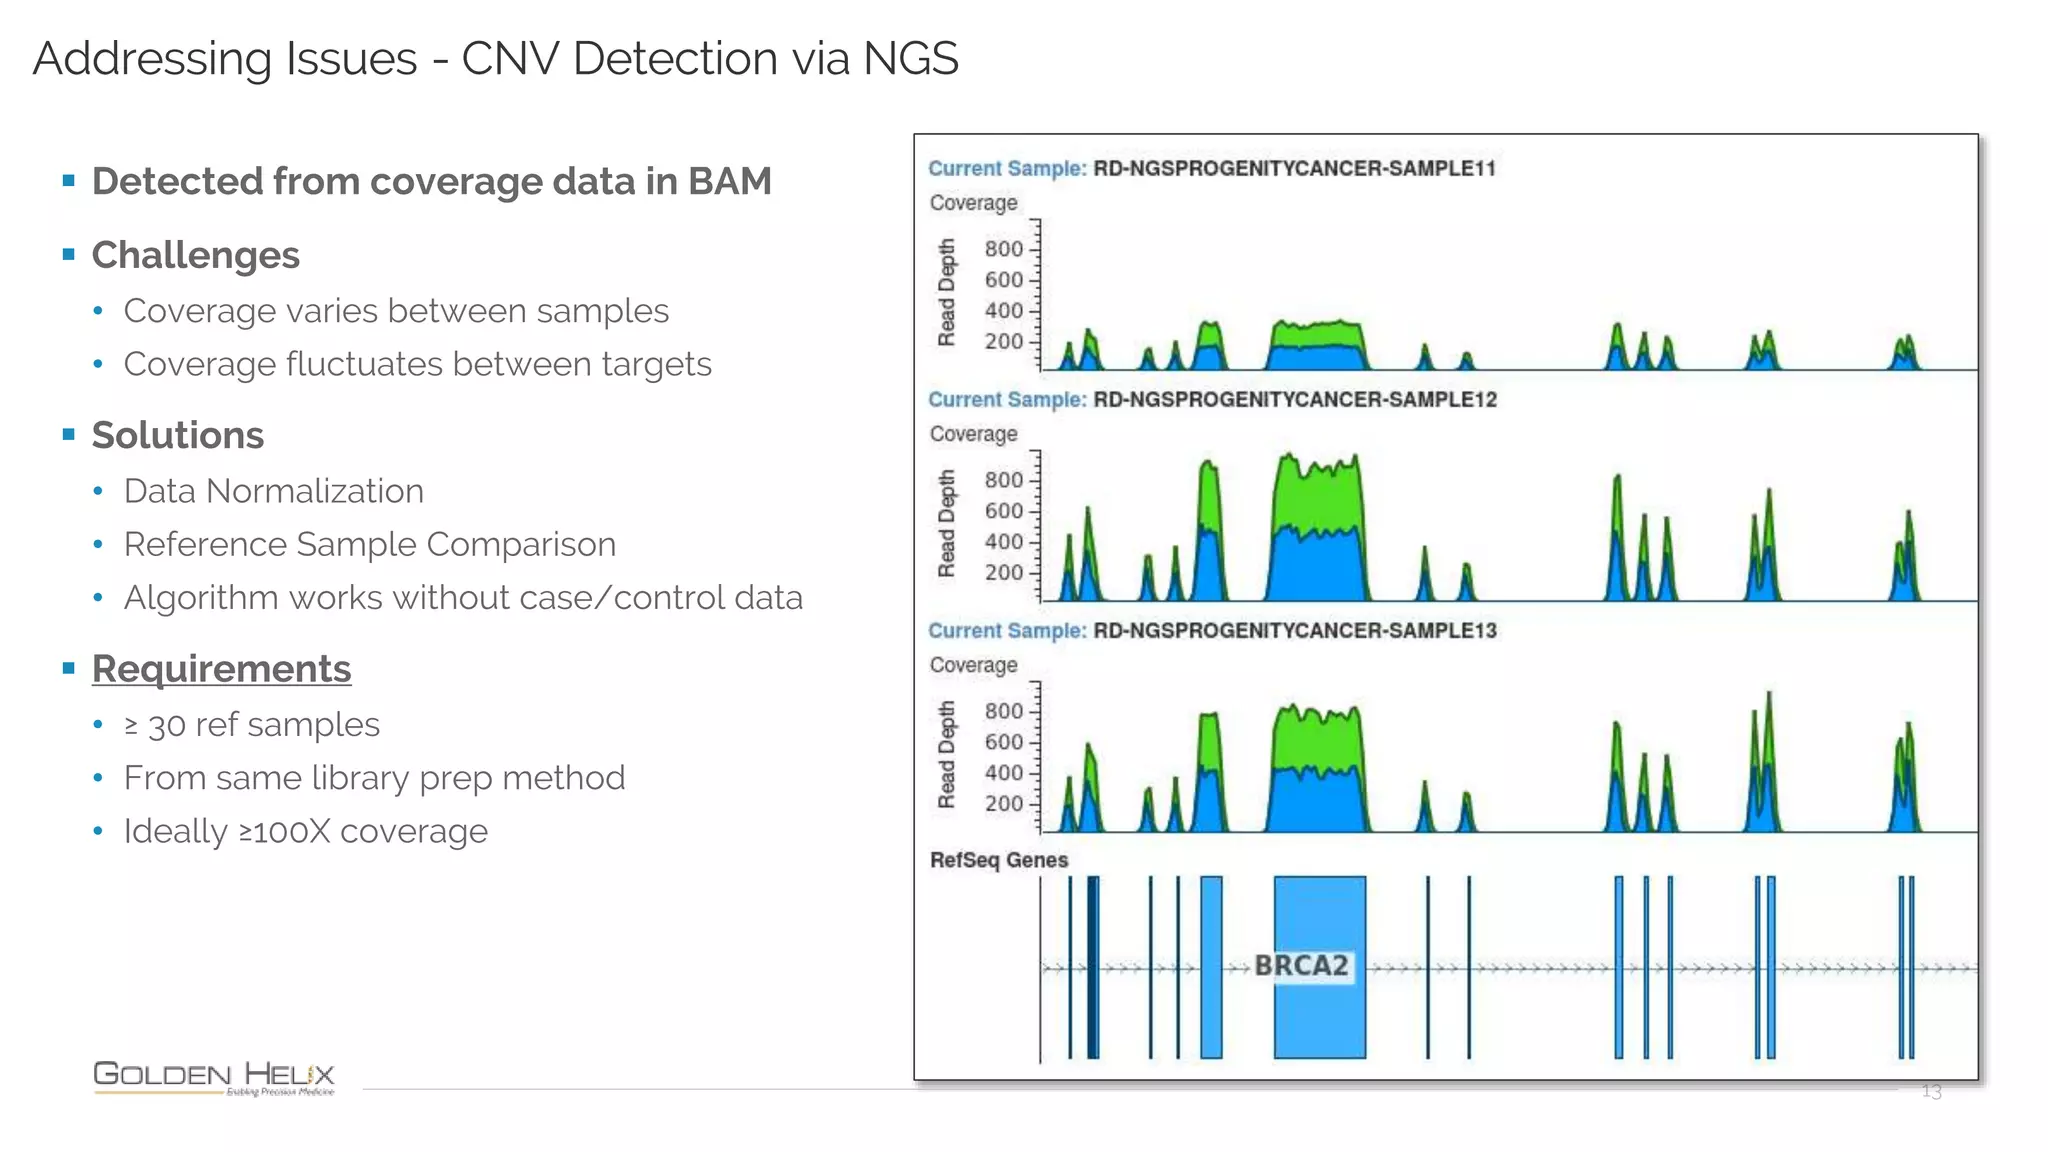
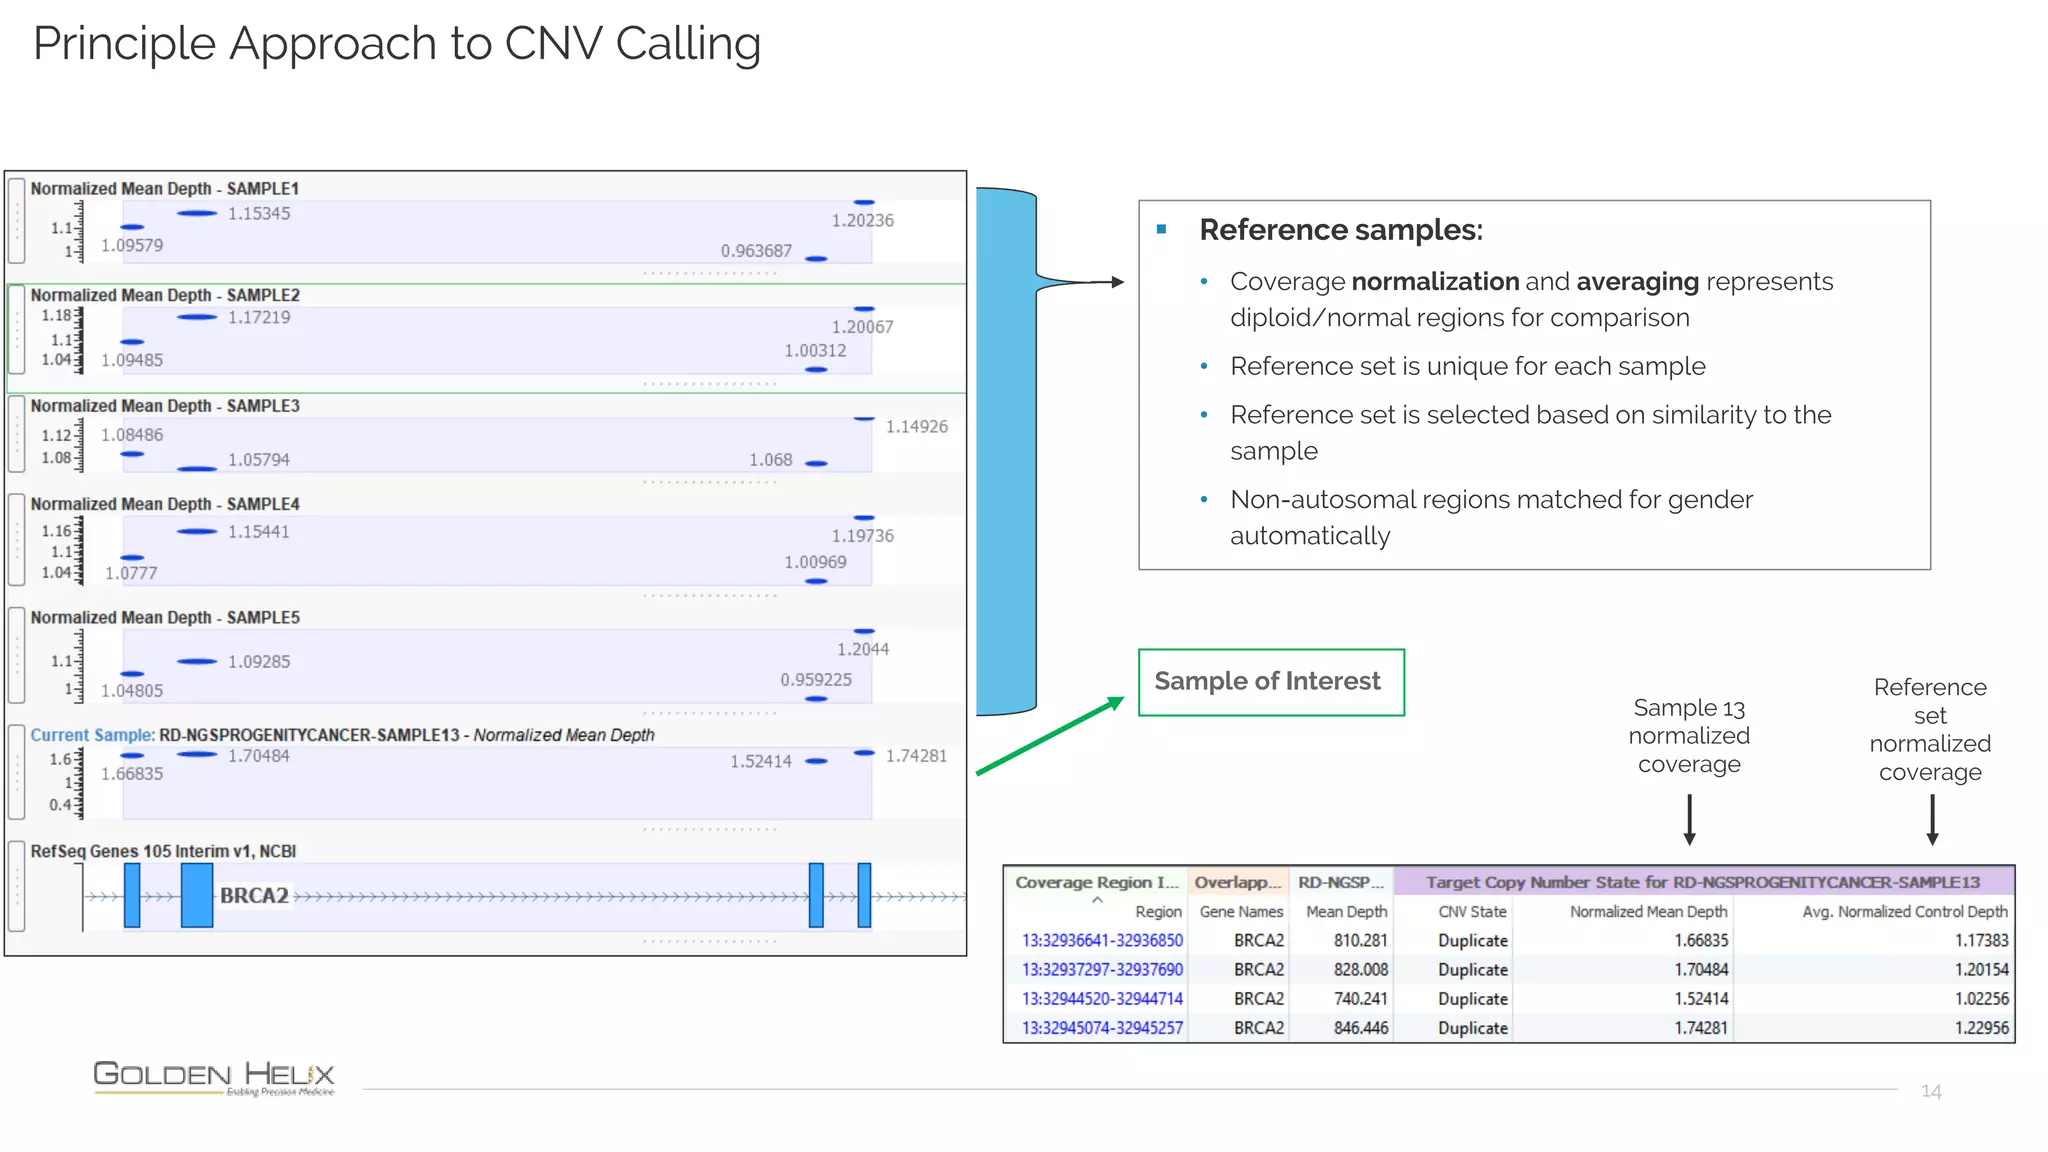
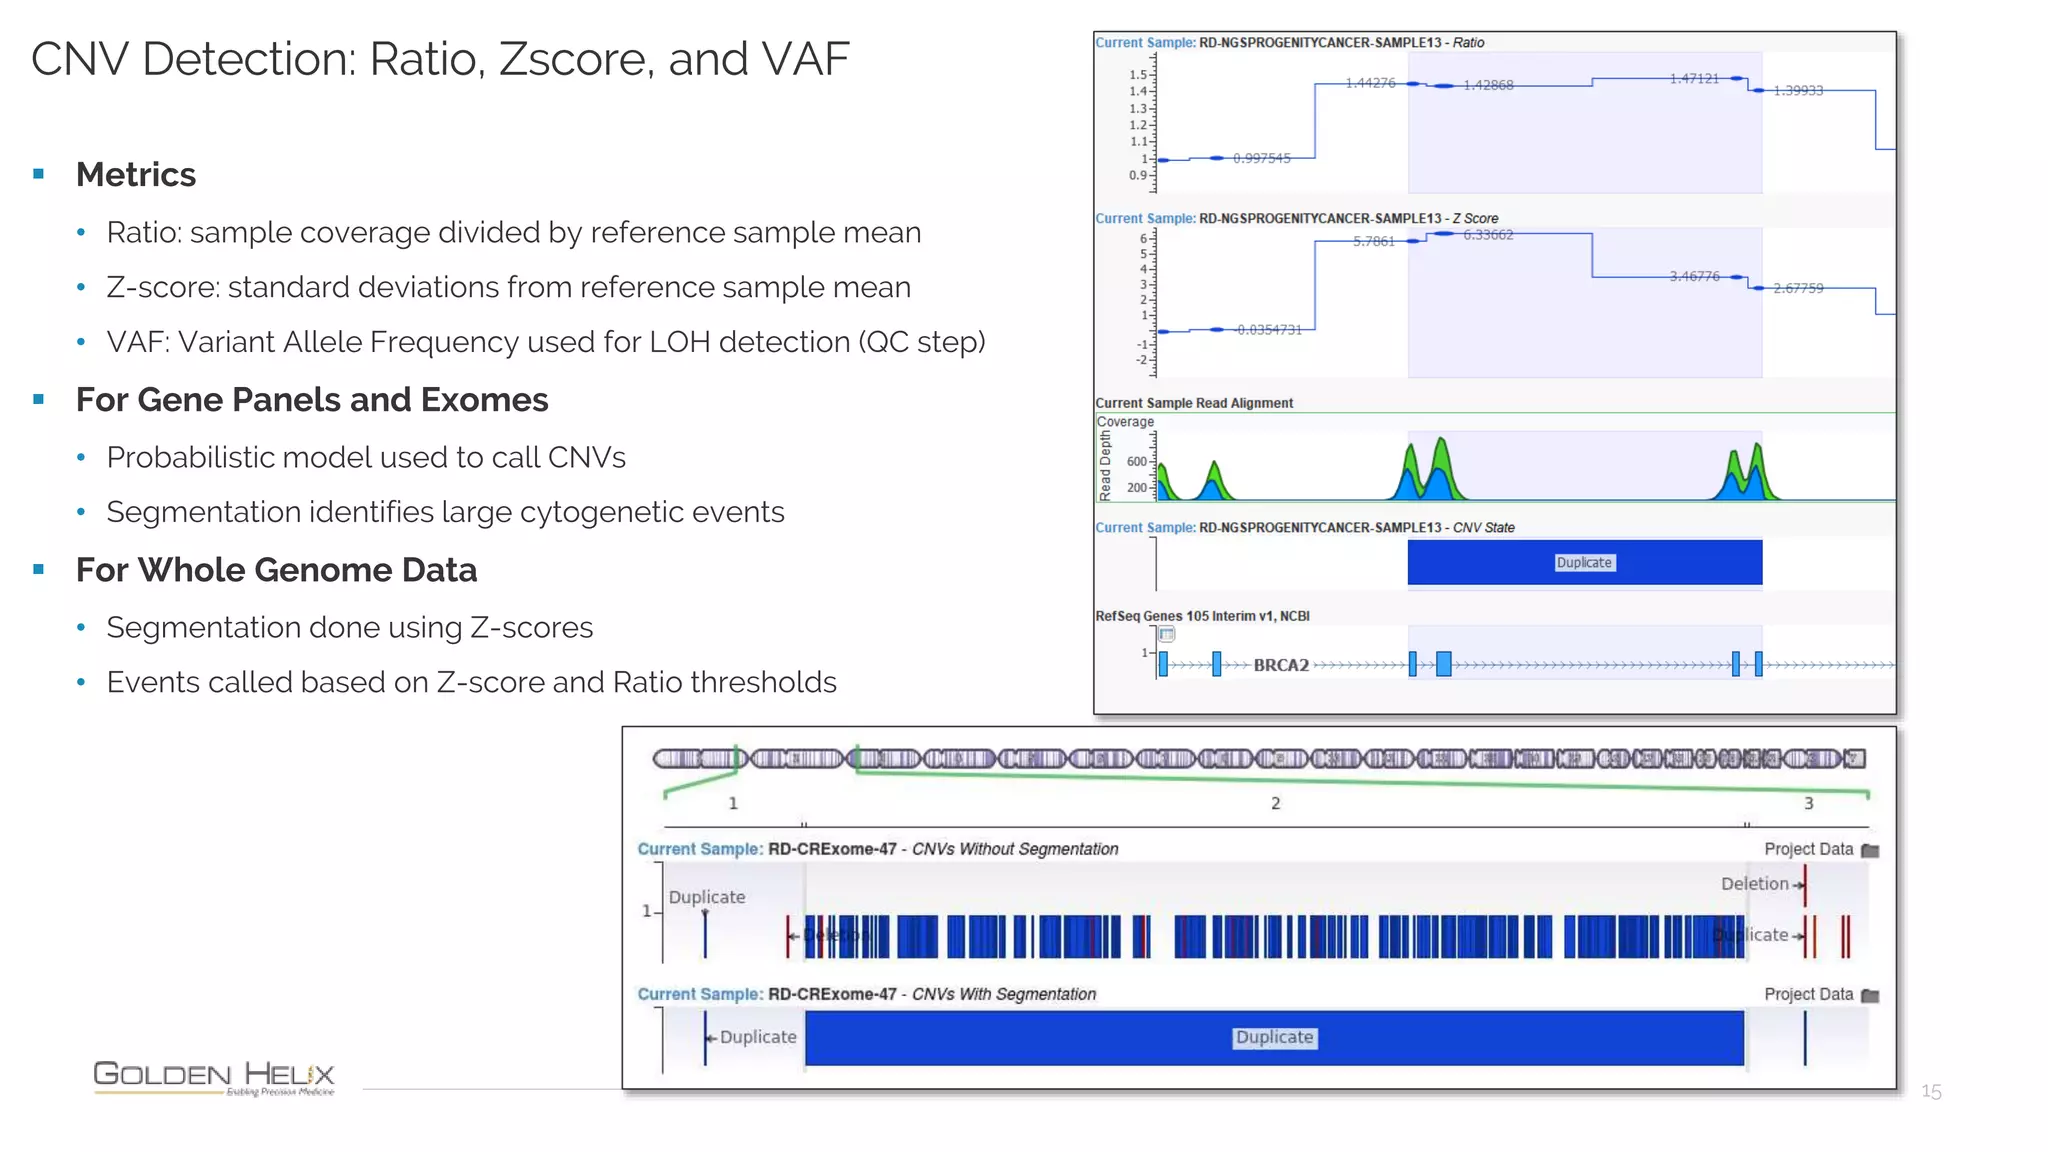
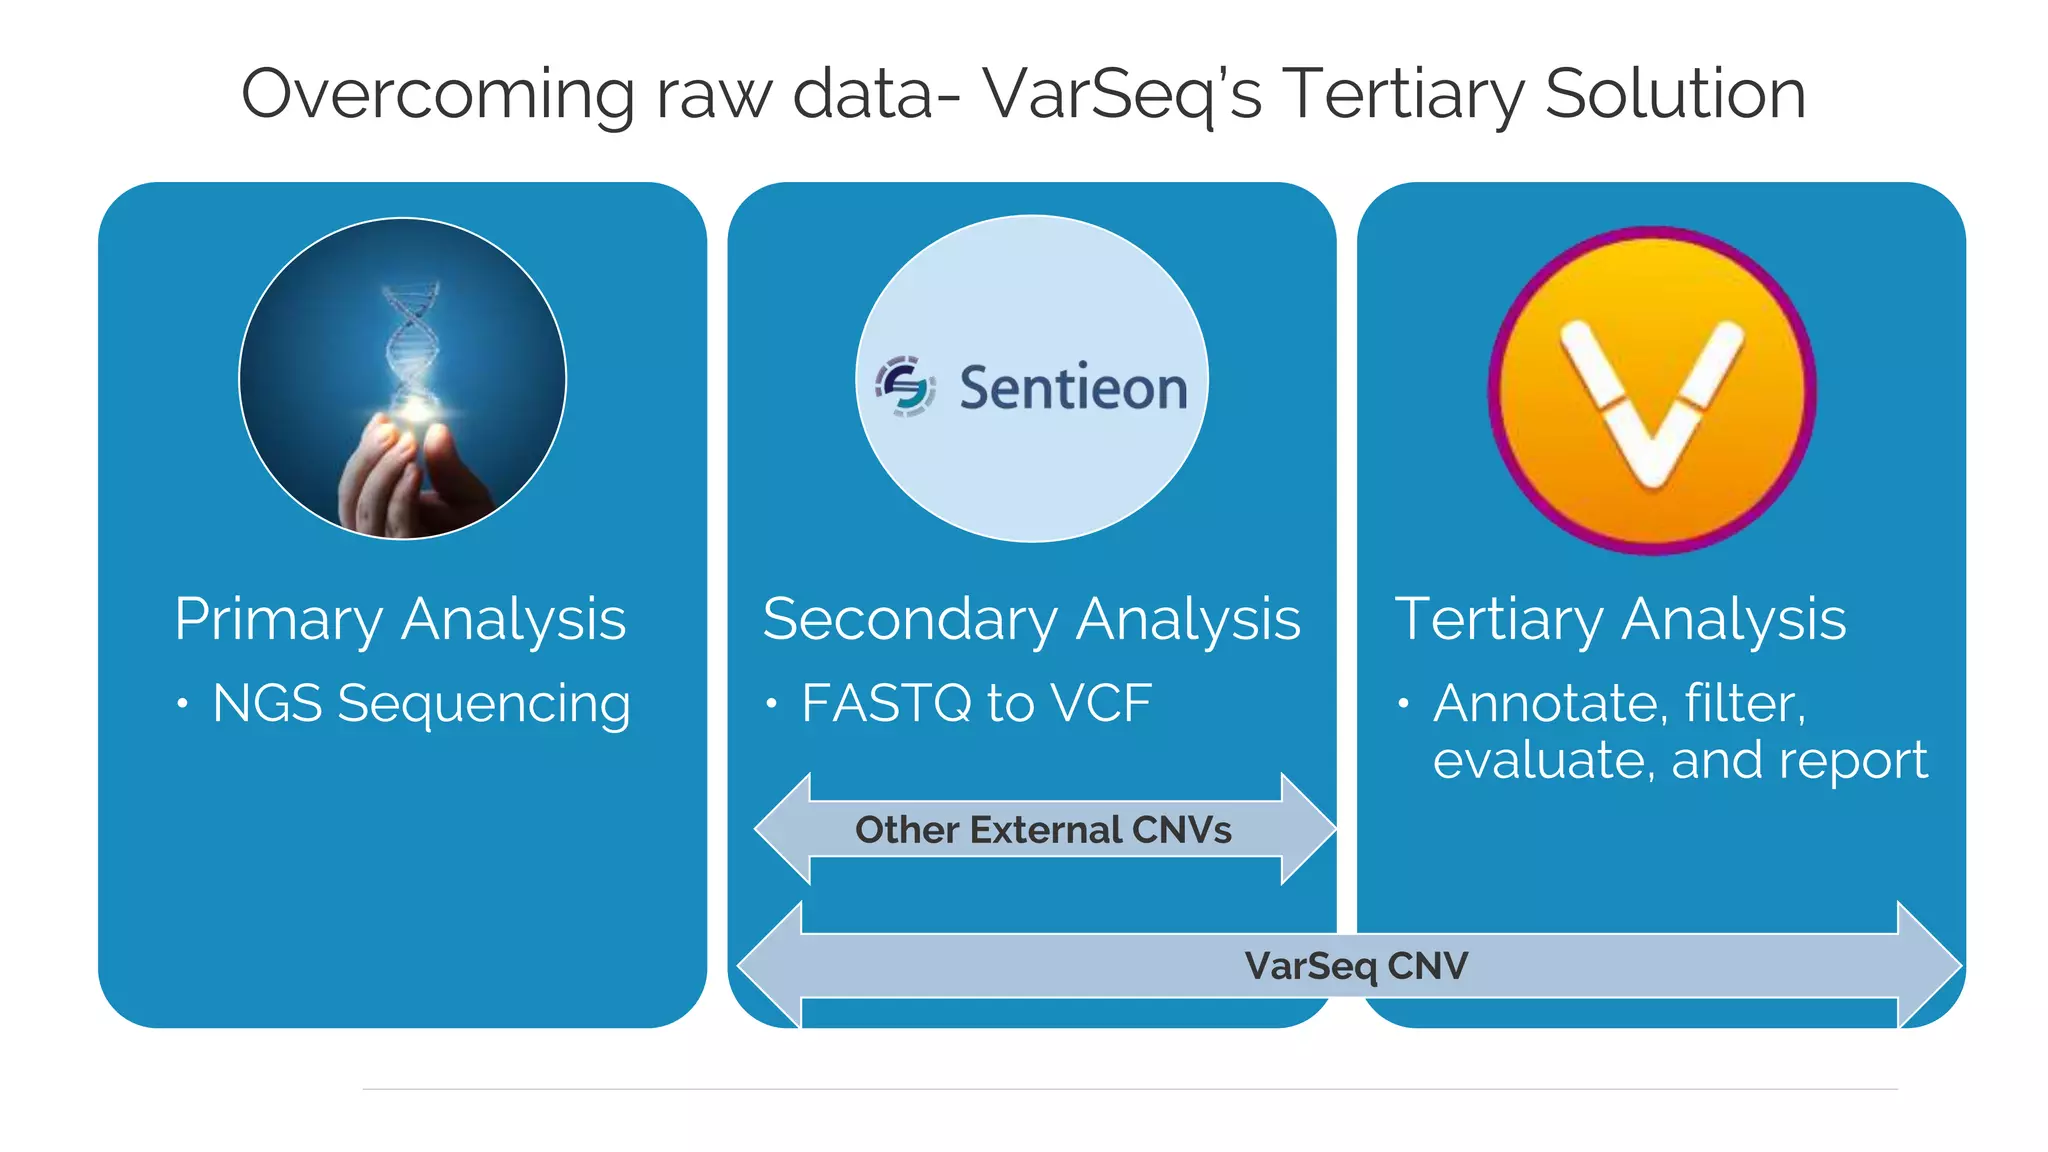
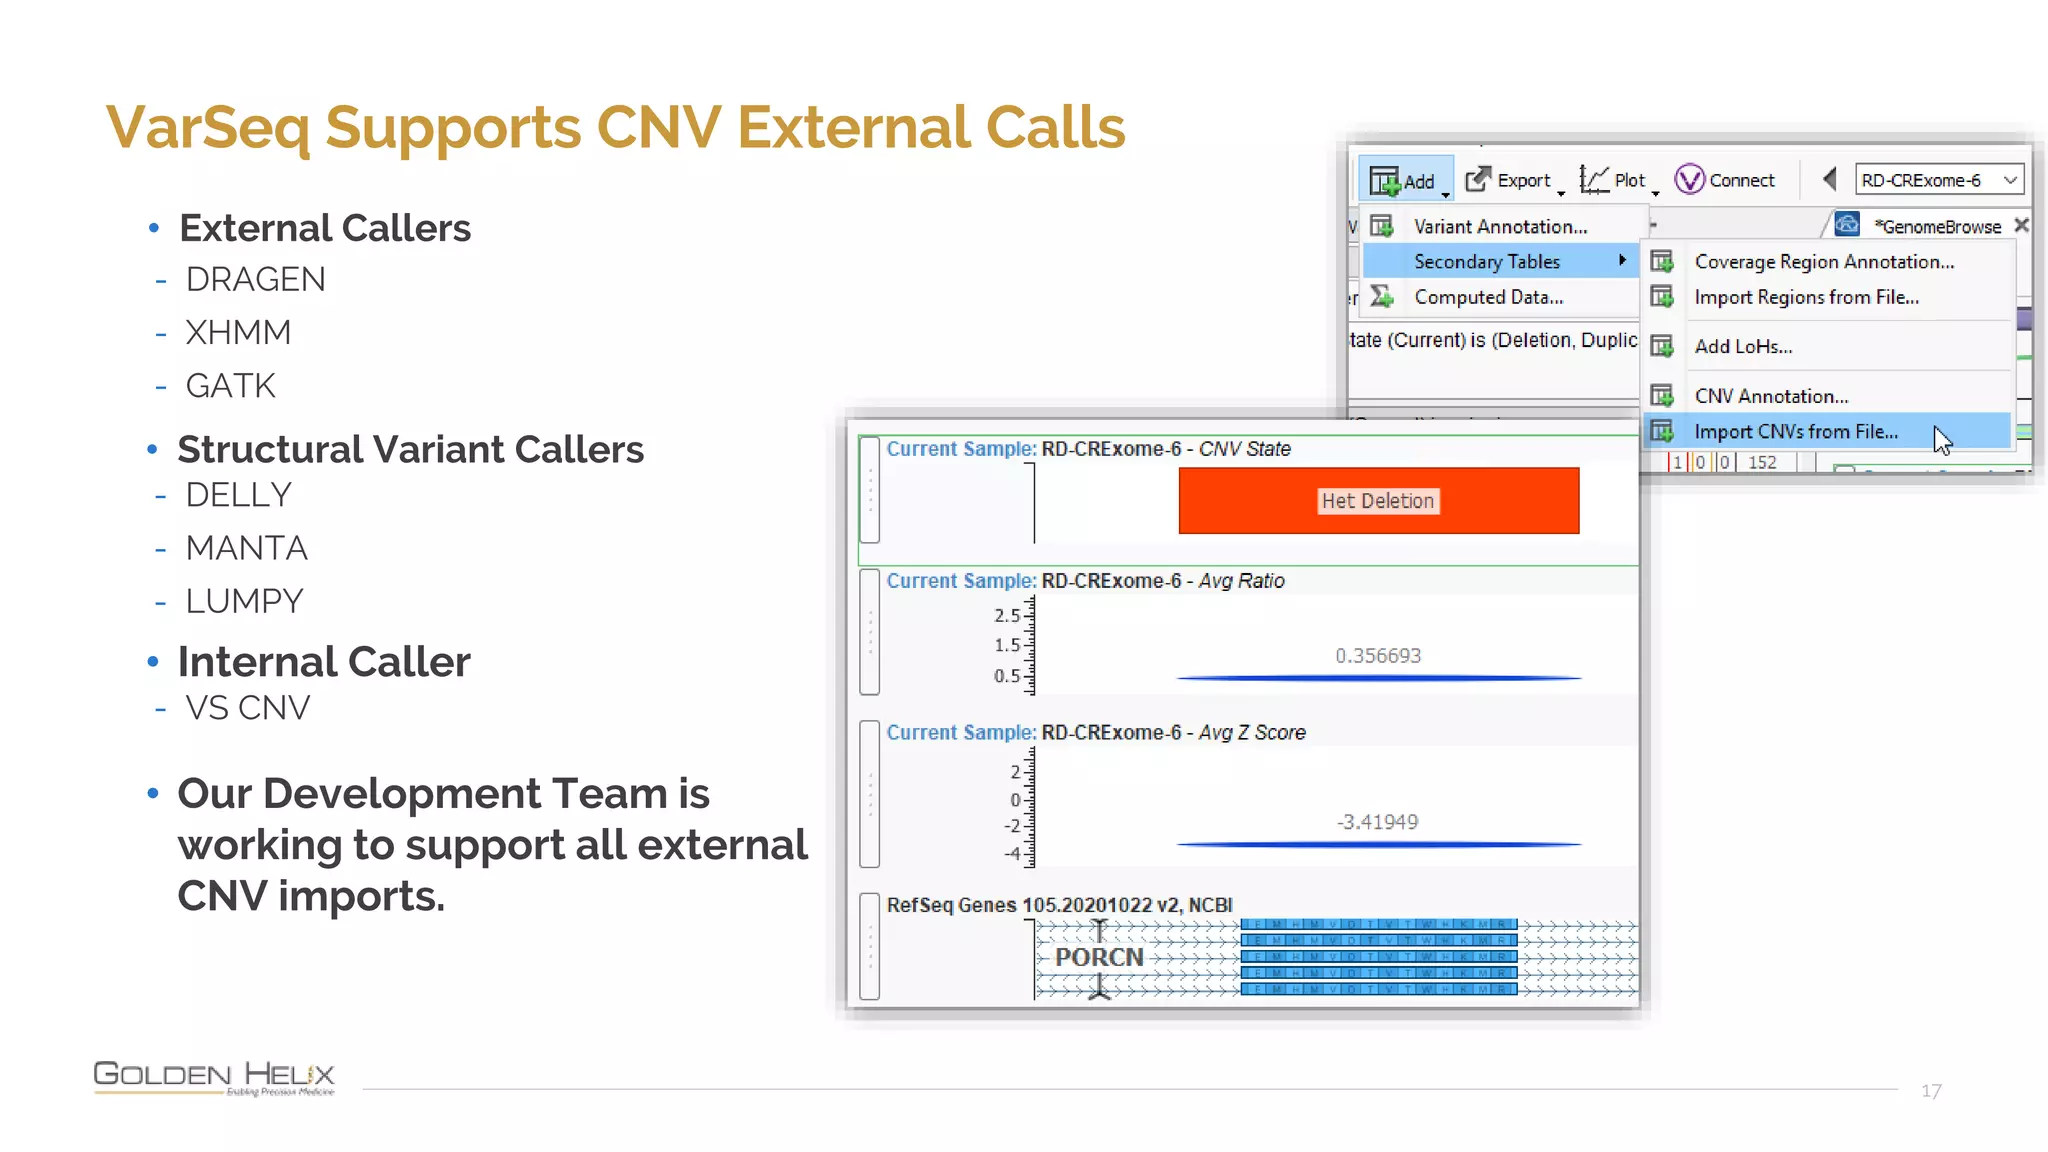
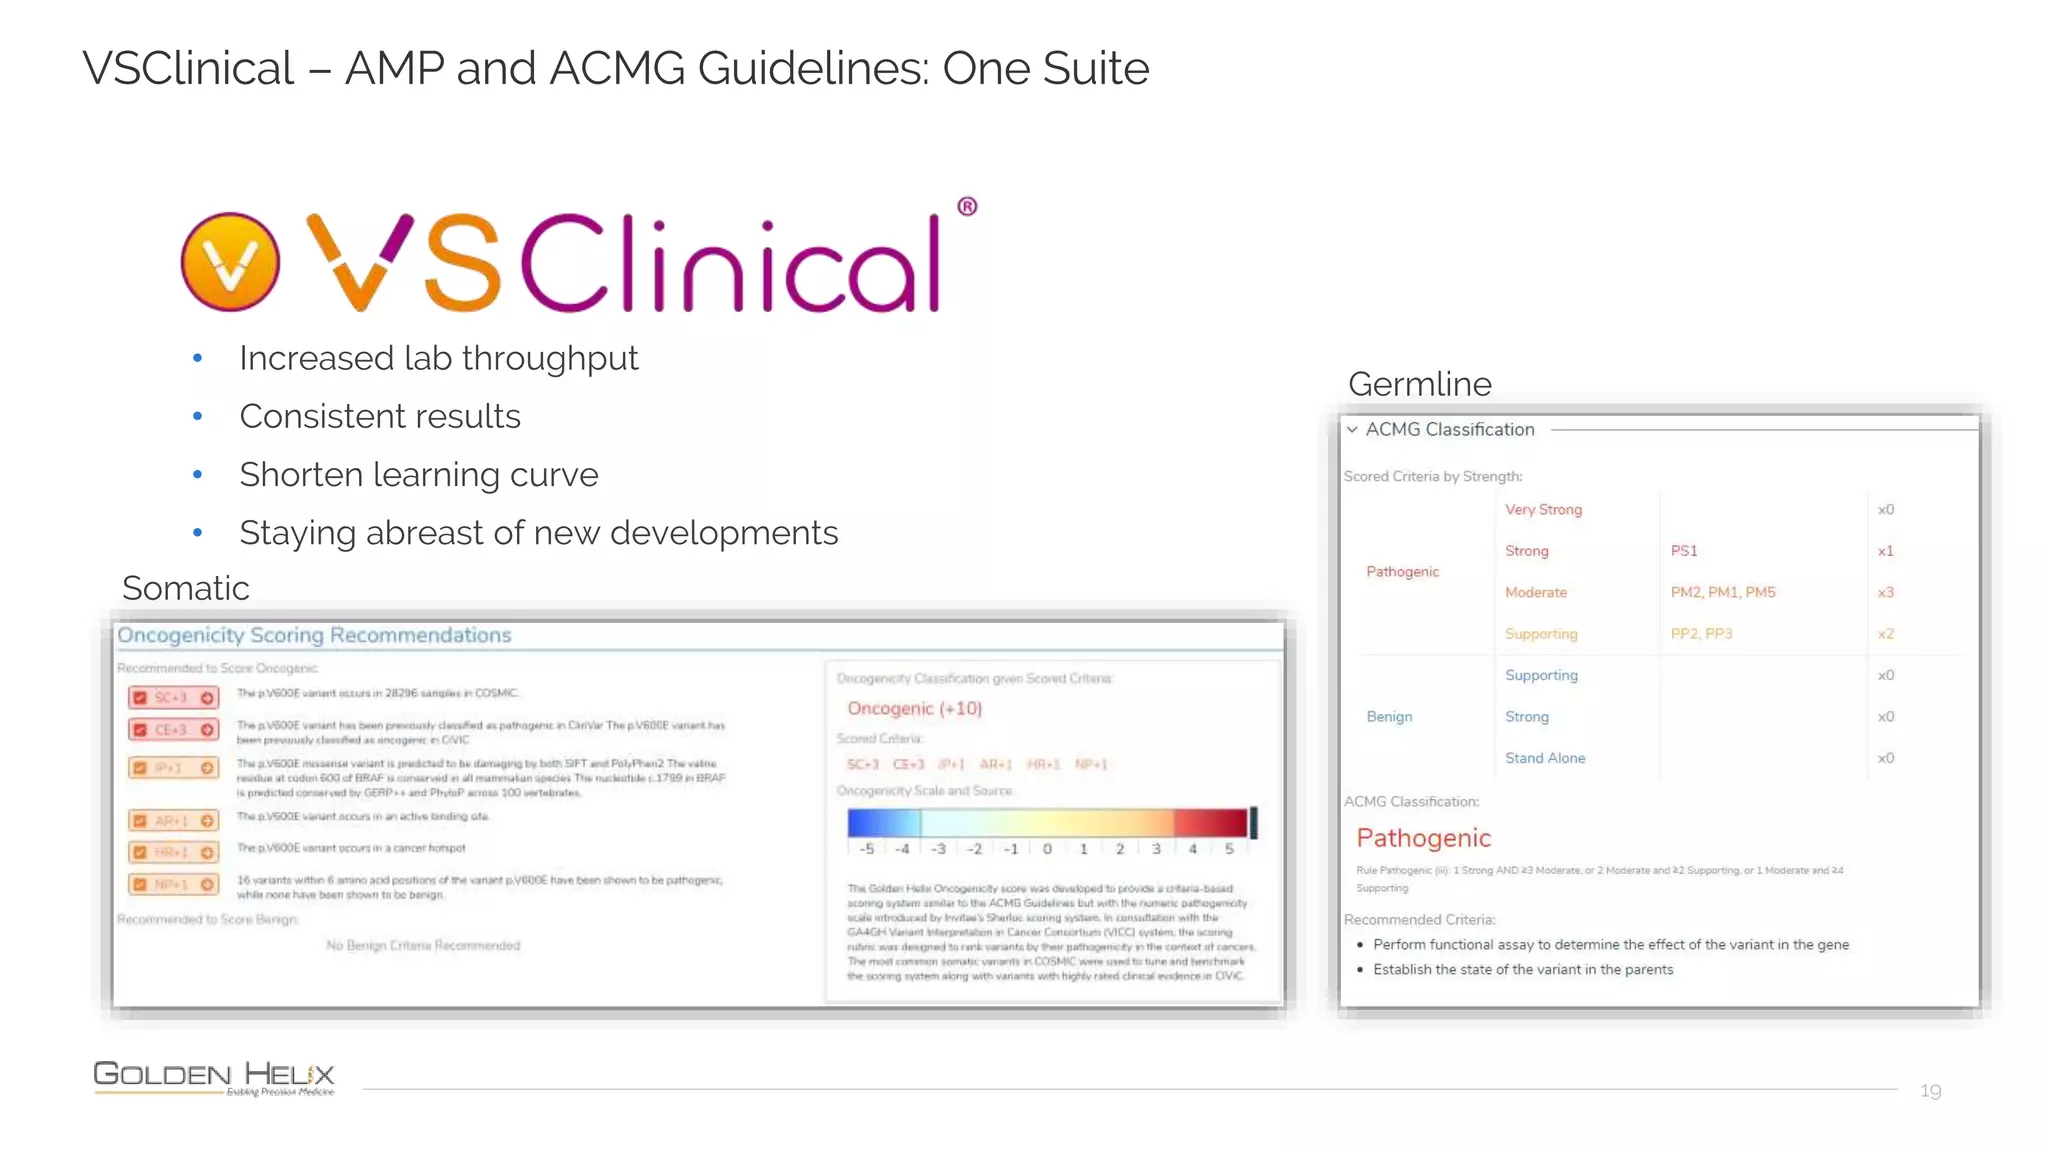
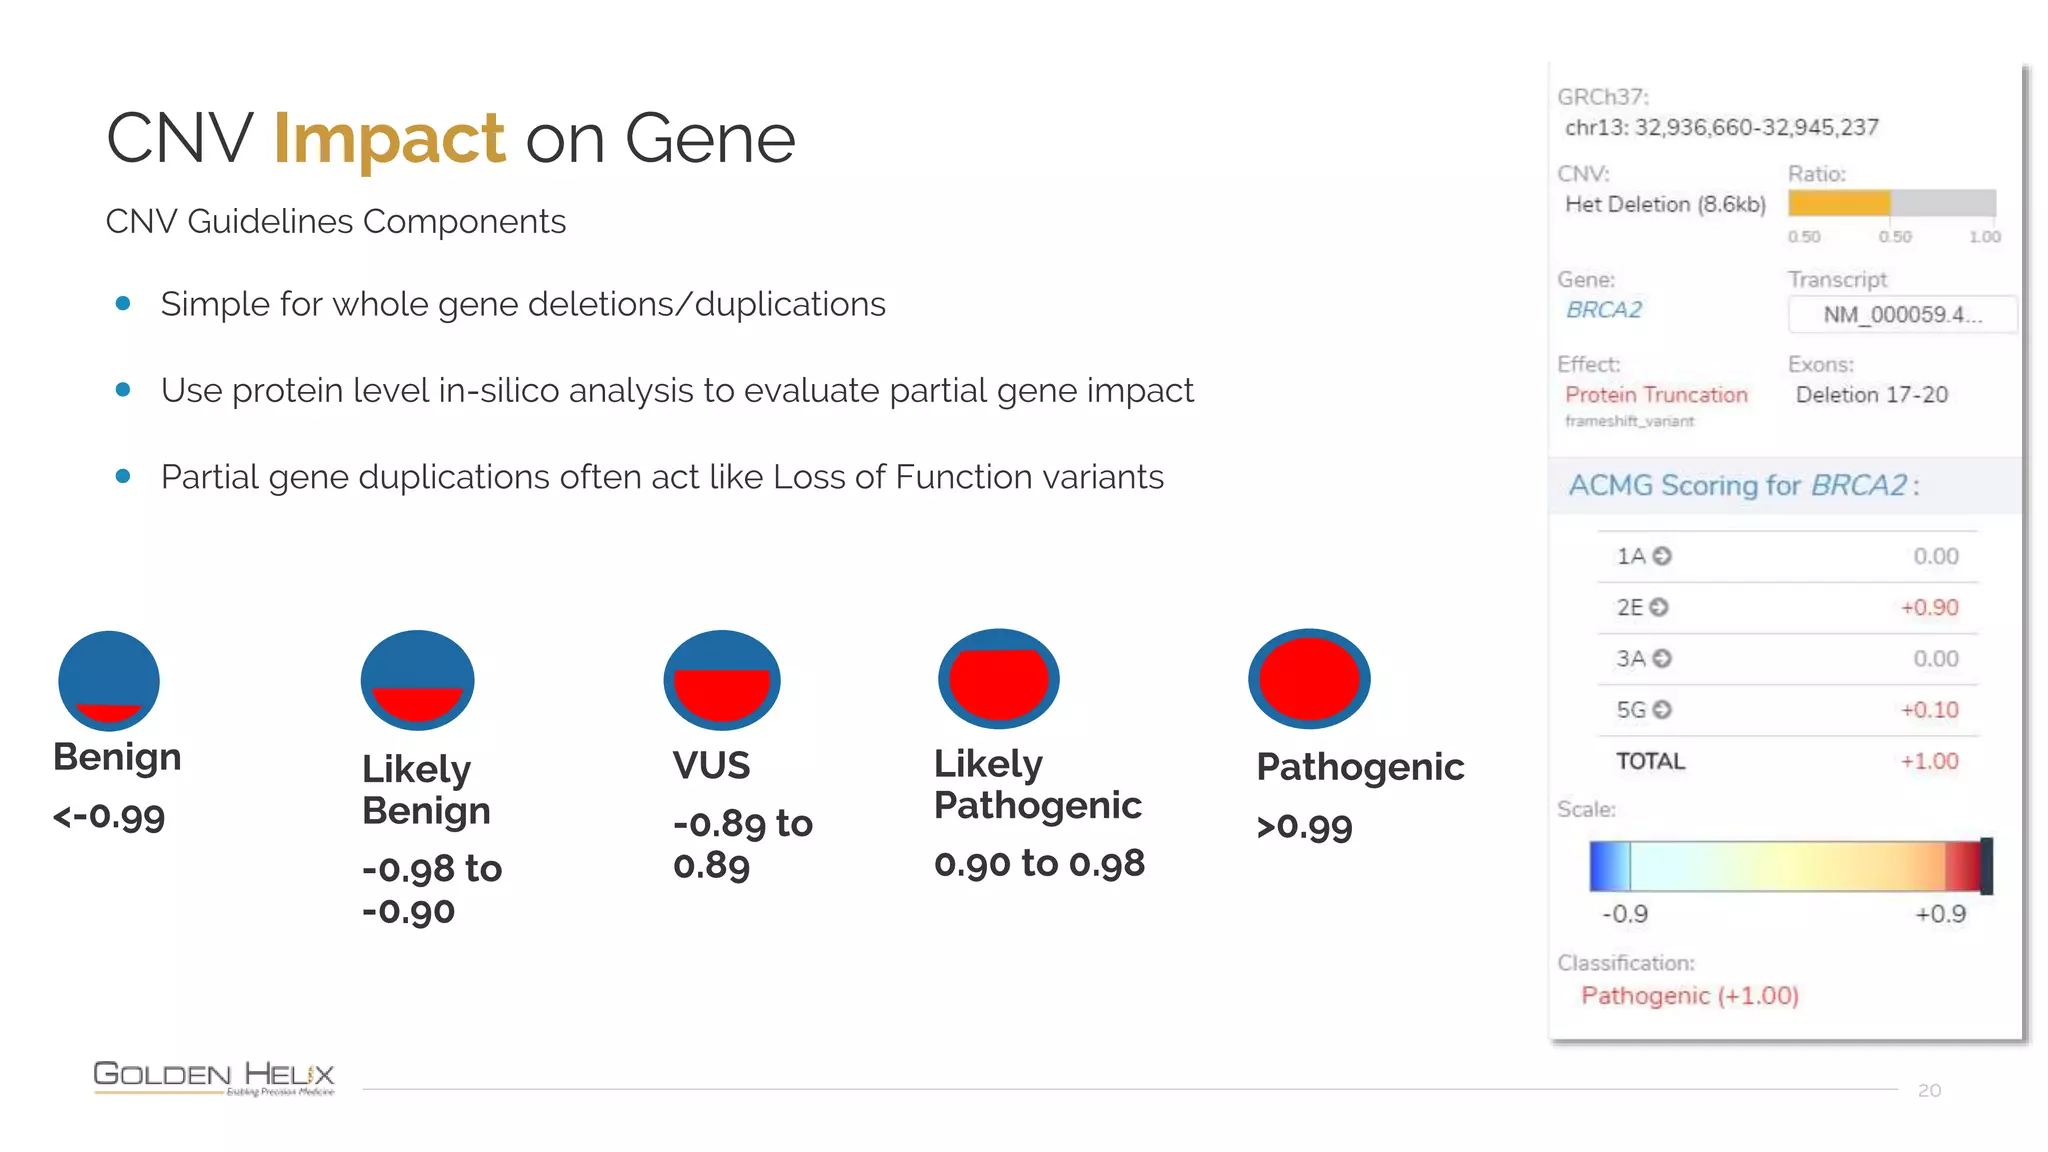
Golden Helix is presenting on their software VarSeq, which can handle a variety of CNV caller inputs. VarSeq uses normalization and reference sample comparison to call CNVs from NGS coverage data. It can detect small, medium, and large CNVs from gene panels, whole exomes, and whole genomes. Previous customers have validated VarSeq for these applications. The presentation demonstrates VarSeq's CNV detection approach and ability to import calls from external callers. It also discusses using VarSeq with their guidelines software to evaluate CNV impact according to ACMG/AMP standards.
3. Handling a Variety of CNV Caller
Inputs with VarSeq
June 22nd, 2022
Presented by Dr. Jennifer Dankoff, Field Application Scientist
4. NIH Grant Funding Acknowledgments
4
• Research reported in this publication was supported by the National Institute Of General Medical Sciences of
the National Institutes of Health under:
o Award Number R43GM128485-01
o Award Number R43GM128485-02
o Award Number 2R44 GM125432-01
o Award Number 2R44 GM125432-02
o Montana SMIR/STTR Matching Funds Program Grant Agreement Number 19-51-RCSBIR-005
• PI is Dr. Andreas Scherer, CEO of Golden Helix.
• The content is solely the responsibility of the authors and does not necessarily represent the official views of the
National Institutes of Health.
5. Who Are We?
5
Golden Helix is a global bioinformatics company founded in 1998
Filtering and Annotation
ACMG & AMP Guidelines
Clinical Reports
CNV Analysis
Pipeline: Run Workflows
CNV Analysis
GWAS | Genomic Prediction
Large-N Population Studies
RNA-Seq
Large-N CNV-Analysis
Variant Warehouse
Centralized Annotations
Hosted Reports
Sharing and Integration
8. When you choose Golden Helix, you receive
more than just the software
8
Software is Vetted
• 20,000+ users at 400+ organizations
• Quality & feedback
Simple, Subscription-
Based Business Model
• Yearly fee
• Unlimited training & support
Deeply Engrained in Scientific
Community
• Give back to the community
• Contribute content and support
Innovative Software Solutions
• Cited in 1,000s of publications
• Recipient of numerous NIH grant and other
funding bodies
11. 11
Power of NGS CNV Detection
Small:1
50b+
Medium:
1 – 10Kb
Large:
10Kb+
Gene
panel
Whole
exome
Whole
genome
MLPA
CMA
VS-CNV
Detectable events Supported Data types
One single testing paradigm
True simplification of clinical workflow
Saves time and money – all on site
12. Golden Helix Customers Continue to Validate VS-CNV
12
Gene Panel CNV Analysis
• “Targeted copy number variant identification across the neurodegenerative disease
spectrum,” by Dilliott et al., 2022
• CNVs can lead to structural variants that contribute to hereditary neurodegenerative
conditions.
Whole Exome CNV analysis
• “Enrichment of loss-of-function and copy number variants in ventricular cardiomyopathy
genes in ‘lone’ atrial fibrillation,” by Lazarte et al., 2021
• ‘Lone’ AF patients had ~4x odds of a LOF variant, including a CNV event, in a
cardiomyopathy gene compared to control patients.
Whole Genome CNV analysis
• “Contribution of Multiple Inherited Variants to Autism Spectrum Disorder (ASD) in a Family
with 3 Affected Siblings,” by Dhaliwal et al., 2021
• Variants and CNV events in a number of genes appear to contribute to ‘tipping over the
ASD threshold’ for this complicated disorder.
13. 13
Addressing Issues - CNV Detection via NGS
Detected from coverage data in BAM
Challenges
• Coverage varies between samples
• Coverage fluctuates between targets
Solutions
• Data Normalization
• Reference Sample Comparison
• Algorithm works without case/control data
Requirements
• ≥ 30 ref samples
• From same library prep method
• Ideally ≥100X coverage
14. 14
Principle Approach to CNV Calling
Reference samples:
• Coverage normalization and averaging represents
diploid/normal regions for comparison
• Reference set is unique for each sample
• Reference set is selected based on similarity to the
sample
• Non-autosomal regions matched for gender
automatically
Sample of Interest
Sample 13
normalized
coverage
Reference
set
normalized
coverage
15. 15
CNV Detection: Ratio, Zscore, and VAF
Metrics
• Ratio: sample coverage divided by reference sample mean
• Z-score: standard deviations from reference sample mean
• VAF: Variant Allele Frequency used for LOH detection (QC step)
For Gene Panels and Exomes
• Probabilistic model used to call CNVs
• Segmentation identifies large cytogenetic events
For Whole Genome Data
• Segmentation done using Z-scores
• Events called based on Z-score and Ratio thresholds
16. Overcoming raw data- VarSeq’s Tertiary Solution
Primary Analysis
• NGS Sequencing
Secondary Analysis
• FASTQ to VCF
Tertiary Analysis
• Annotate, filter,
evaluate, and report
VarSeq CNV
Other External CNVs
17. VarSeq Supports CNV External Calls
17
• External Callers
• Internal Caller
- DRAGEN
- XHMM
- GATK
• Structural Variant Callers
- DELLY
- MANTA
- LUMPY
- VS CNV
• Our Development Team is
working to support all external
CNV imports.
18. 19
VSClinical – AMP and ACMG Guidelines: One Suite
• Increased lab throughput
• Consistent results
• Shorten learning curve
• Staying abreast of new developments
Germline
Somatic
19. CNV Impact on Gene
20
CNV Guidelines Components
• Simple for whole gene deletions/duplications
• Use protein level in-silico analysis to evaluate partial gene impact
• Partial gene duplications often act like Loss of Function variants
Benign
<-0.99
Likely
Benign
-0.98 to
-0.90
VUS
-0.89 to
0.89
Likely
Pathogenic
0.90 to 0.98
Pathogenic
>0.99
21. NIH Grant Funding Acknowledgments
22
• Research reported in this publication was supported by the National Institute Of General Medical Sciences of
the National Institutes of Health under:
o Award Number R43GM128485-01
o Award Number R43GM128485-02
o Award Number 2R44 GM125432-01
o Award Number 2R44 GM125432-02
o Montana SMIR/STTR Matching Funds Program Grant Agreement Number 19-51-RCSBIR-005
• PI is Dr. Andreas Scherer, CEO of Golden Helix.
• The content is solely the responsibility of the authors and does not necessarily represent the official views of the
National Institutes of Health.
24. 25
Upcoming Events
Upcoming Webcast: Maximizing Profitability in your NGS Testing Lab
Develop repeatable cancer and germline interpretation workflows that scale from panels to whole
exomes and genomes.
Presented by: Andreas Scherer, Golden Helix President & CEO, and Gabe Rudy, VP of Product &
Engineering
Webcast invitation will be sent out soon.
2022 T-Shirt Competition
Keep your eyes out for more information!
Before we start diving into the subject, I wanted mention our appreciation for our grant funding from NIH.
The research reported in this publication was supported by the National institute of general medical sciences of the national institutes of health under the listed awards.
Additionally we are also grateful for receiving local grant funding from the state of Montana. Our PI is Dr. Andreas Scherer who is also the CEO at Golden Helix and the content described today is the responsibility of the authors and does not officially represent the views of the NIH.
So with that covered, lets take just a few minutes to talk a little bit about our company Golden Helix.
GoldenHelix is a global bioinformatics software and analytics company that enables research and clinical practices to analyze large genomic datasets. We were originally founded in 1998 based on pharmacogenomics work performed at GalxoSmithKline who still is a primary investor in our company.
We currently have two flagship products Varseq and SNP and Variation Suite (SVS) for short.
VarSeq serves as a clinical tertiary analysis tool tailored for basic variant annotation and filtration but additionally, users have access to automated AMP or ACMG variant guidelines. VarSeq also has the capability to detect copy number variations scaling from single exome to large aneuploidy level events. Additionally, the finalization of variant interpretation and classification is further optimized with the VarSeq clinical reporting capability. Users can integrate all of these features into a standardized workflow which can be automated further with batch runs via VSPipeline.
Paired with VarSeq is VSWarehouse which serves as the repository for this large amount of useful genomic data. Warehouse not only solves the issue of data storage for ever increasing genomic content, but also is fully query able and auditable with definability of user access for project managers or collaborators.
Lastly, our research platform, SVS, enables researchers to perform complex analysis and visualizations on genomic and phenotypic data.
SVS has a range of tools to perform GWAS, Genomic Prediction, RNA-Seq analysis and the ability to process CNVs
Our software has been very well received by the industry. We have been cited in thousands of peer-reviewed publications and that’s a testament to our customer base.
We work with over 400 organizations all over the globe.
top-tier institutions, Stanford and yale
government organizations, NCI
clinics, Sick kids
genetic testing labs and prevention genetics
With now well over 20,000 installs of our products and with 1,000’s of unique users.
So how is this relevant to you?
This means that over the course of 20 years our products have received a lot user feedback, which we immediately incorporate into developing and releasing newer versions of our products. **click**
We receive active research grants to support the advancement of our software capability which is always directed from our user feedback and awareness of the industry needs. **click**
We also stay relevant in the community by regularly attending conferences and providing useful product information via eBooks, tutorials, and blog posts. **click**
Your access to the software is a simple subscription based model where we don’t charge per sample nor per version. You also maintain full access to our support and training staff to get you up to speed quickly with your analysis
The Golden Helix stack provides the capability to start with an initial FASTQ file all the way down to a clinical report. This is achievable through our partnership with Sentieon providing the alignment and variant calling steps to produce the VCF and BAM files. This output serves as the basis for CNV detection and import data for your tertiary analysis in VarSeq. If you are performing NGS based CNV analysis, Golden Helix is the market leader; supported by studies like Robarts Research Institute showing 100% concordance with MLPA. Additionally, the imported variants in your VarSeq project can be run through VSClinical’s automated ACMG and AMP guidelines. After completing secondary and tertiary processing, all analysis can be rendered into a clinical report which can be stored in VSWarehouse providing researchers and clinicians with access to this information and to view previous findings.
And with that, let’s take a look at the VarSeq workflow, to get an exposure to what VarSeq does along with how we handle Copy Number Variants. There is a lot to consider when reviewing all the components for the guidelines ACMG or AMP manually, which makes all the hard work in automating this process so valuable.
If we conceptually separate the VarSeq application into stages, Stage 1 would be the importing, detection, and filtering of variants. All the imported or detected variants pass through a user define template that is based on a variety of public databases and algorithms.
This of course includes the CNV ACMG classifier algorithm. Today we will leverage the auto classifier to isolate clinically relevant pathogenic CNVs which will be carried into stage 2 of the analysis, processing the CNV through VSClinical with the guidelines just mentioned. The third and final step of analysis is the rendering of the complete clinical report, which we will not have time to look at today. If you would like to know more about Clinical Reporting, there is an excellent Webcast from December that dives into this topic.
Next, let’s take a look at how CNV calling fits into the wider scope of NGS data analysis.
To best explain the value of VS CNV detection, we can compare against the traditional best methods. One traditional method is MLPA which is ideally tailored for detecting smaller events for a single or maybe few genes. In addition to being expensive, around $80 per gene, one additional con to MLPA is the inability to detect larger events, which chromosomal microarrays can handle. The large aneuploidy level of CMA event detection is typically from 10 kbp or larger. CNV detection with your NGS data in VarSeq accurately detects not only the 10kbp and larger events, but can detect events down to a single gene and even exon.
Now, VarSeq breaks down the barriers of the limitations across CMA and MLPA methods, and gives the user full scale capability to process everything from small gene panels up to whole genome datasets in one software suite while saving you a fortune on assays. Another value here is that the CNV detection is performed by you, eliminating the need to outsource this process which only adds time and inefficiency in both producing and understanding the results. Each of these approaches have their nuances, and NGS is no exception, lets discuss some of the associated challenges and how we tackle them.
We know that one of the concerns when working with CNVs is the accuracy and the reliability of the caller and analysis methods. Know that our caller was released in 2017, and within a year, **click** the Robarts Research Institute had published this study, “Use of next-generation sequencing to detect LDLR gene copy number variation in familial hyper-cholesterol-e-mia.” They showed that our CNV caller had 100% concordance with the MLPA method.
And the validation of our tools does not stop there.
We know that clinical validation is a concern for labs, but know that our CNV caller and analysis has run the testing gauntlet and is regularly used in peer-reviewed research.
Since the launch of VS CNV, there are numerous groups that have published using our tool in a variety of settings, and I wanted to take this opportunity to highlight several recent papers by our customers. This first paper, “Targeted copy number variant identification across the neurodegenerative disease spectrum,” was released recently, at the beginning of June. This group used a targeted gene panel approach to determine that CNVs can lead to structural variants that contribute to hereditary neurodegenerative conditions.
Since the CNV caller’s release in 2017, we have been proven to handle larger data sets as well. **click** this next paper, “Enrichment of loss-of-function and copy number variants in ven-tric-ular cardiomyopathy genes in ‘lone’ atrial fib-ril-lation,” examines whole genome CNV analysis. This study shows that ‘Lone’ AF patients have a 4x odd of a LOF variant, including a CNV event, in a cardiomyopathy gene compared to control patients.
To round this off, I would like to show an example of a whole genome CNV analysis with VS-CNV. **click** The paper, “Contribution of multiple inherited variants to autism spectrum disorder in a family with 3 affected siblings,” demonstrates that variants and CNV events in a number of genes appear to contribute to ‘tipping over the ASD threshold’ for this complicated disorder.
These three examples help show that our CNV analysis is used in a variety of settings, from research labs, to hospital diagnostics, and in the context of biobanks. We would like to thank our customers for working with the tools and contributing to the ongoing validation through their publications. With this in mind, let’s take a look at how this clinically validated CNV caller works.
In VarSeq, the primary file that we need to import is the VCF, but we also can leverage the coverage data that comes from the BAM file. That coverage data is what serves as the baseline for the CNV detection in the VarSeq platform.
Simply looking at the coverage is not enough though, and to detect CNVs we need to use a series of reference samples. Case and point, we can take a look at sample 11 in this image on the right. If you had to simply look at the coverage, you might make assumption that because the coverage is half as much across all of these regions, we might be looking at a Het Deletion in BRAC2.
But, by using a series of reference samples, we both normalize and average the coverage profile to serve as a baseline diploid coverage which we can compare to any one sample’s normalized coverage to get a much more accurate depiction of coverage differences and subsequently, CNV calls.
What we find out is we don’t actually have a Het Deletion in Sample 11, we have a different event seen in Sample 13, and we will make sense of that in a minute.
With the collection of reference samples comes some strong recommendations. One, you need to have enough of them to serve as a good baseline for this normalization and averaging of the coverage. We do recommend having 30 or more reference samples for those coverage calculations.
Beyond that, all of the samples need to come from the same library prep method, but they do not need to come from the same sequencing run, just the same methodology. What we do NOT want to do is compare apples to oranges, so we want them all to come from the same pipeline.
Beyond that, it comes down to a conversation about adequate coverage. We see the best results with at least 100x coverage on average for your panels or exomes, or what is more commonly seen as 30x with a whole genome for the binned region approach. So, these are just the recommendations just for the reference set. Now, let’s pick apart how this process works.
What we have here is a very simple example where we have my sample of interest, sample 13, which you can see near the bottom. What I’m doing is not only normalizing the coverage for sample 13, but also normalizing the coverage for all of the samples above that are serving as my example reference set. **click** So all of the normalized coverage in the target regions is making an average for the reference set **click click** and we compare the average of the normalized value to the normalized value in sample 13.
The algorithm is smart enough to choose the ideal reference set, not only for similar coverage profiles, but also matching for gender. Then when we compare the target regions for normalized coverage, **click** we get a table very much like this one in the bottom right hand corner. Here is our trend **click click**- when we compare the normalized coverage for sample 13 to the average normalized set for the reference values, we see that the normalized depth for these target regions are consistently higher. Is this enough to say that this is a CNV for consistently higher coverage over this region when compared directly to the reference set? When we go to the next slide, we see that it is.
We are calling a duplication for these few exons in sample 13. This is a much more robust system than simply looking at the coverage data in the BAM file. This is our fundamental process here for CNV detection in VarSeq.
So we are taking this CNV call, and we are reinforcing the strength of the call with these metrics that we have for ratio- ratio simply being the normalized coverage of the individual sample of interest divided by the reference set. So a sample that has normalized coverage that is half as much as the reference would likely correspond to a Het Deletion call.
Z-score, is just the standard deviation for that event as well.
Beyond that, we can use these probabilistic approach for these smaller events like a single exon all the way to these full-blown aneuploidy or chromosomal level events using segmentation. **click** Our users don’t suffer from a million small events being labeled as a duplication over an entire chromosome, all of those events are being lumped into one big call for those larger events.
So those are just the fundamentals, but the purpose of today’s call is to not only expose you to the VarSeq methodology, but that there are other CNV callers out there that we support. We want to make sure that you can utilize those in VarSeq and carry on with the evaluation.
We know that VarSeq is one among many CNV calling platforms out there. The purpose of this webcast is to talk about our ongoing journey to support calls from multiple platforms.
However, the show really begins after the generation of the raw calls. False positives and negatives happen, and the VarSeq CNV caller is able to be adjusted for increased or decreased sensitivity for calling. What is really interesting here is the ability to then filter and annotate through the raw data after the initial call. Not only have we proven ourselves in the ability to generate raw calls- we take this a step further by bringing in the filtering strategies to get down to your clinically relevant CNVs. This is especially useful when looking at exome CNV data where the number of CNV events can reach the thousands.
I want to show you an example of this, where I can take a CNV VCF from an external caller, and by using a pre-designed template, my filters bring me down to a single clinically relevant CNV. This is starting from a position of about 150 raw calls in the VCF.
The main take away here is, VarSeq is not done after generating the raw data. By utilizing filtering and annotation strategies, we provide a means of searching through the raw data to isolate the clinically relevant CNV that then goes through the ACMG evaluation, leading to the generation of the final clinical report, which we will get back to momentarily.
We just discussed reviewing the fundamentals of how we isolate CNVs with VarSeq, but you should know that we support CNVs coming from external calls. Our workflow can support CNVs through both of these methods. Overall, we are unique in our ability to support the calling and analysis of CNV calls all in one platform, paired with the tertiary solution. Now, let’s take a minute to look at some of these other formats supported by VarSeq CNV.
Here is a list of some of the common formats that you may have heard of if not already using. **read through** We know that there are a LOT of CNV callers out there, and this is obviously an incomplete list. Our development team is chipping away to make sure we support those external CNV callers.
Before we move on, I wanted to take a quick poll to get some insight into which CNV callers are common with our customers. Please select all that apply and feel free to say Other if you are using one of the callers that is not listed here.
. . . Thank you for your input. I can see that we got a wide range of responses. Overall, the goal is to be able to get all of this data in and to support its formatting, so you can get to the point of having those filtered CNVs ready for analysis with VSClinical.
M:\FAS\FAS_Pitches\VarSeq_Golden Helix Project Data\CNV\External CNV files
We want all of you to get to this goal, complete your analysis, and get the final clinical report to your patients. We want to avoid having any road blocks with your initial data formatting when we import that into the software.
Within VarSeq is VSClinical which serves as our ACMG and AMP guideline interpretation hub. It is worth discussing the value points in having a true automated guideline interface.
First off, you want to maintain consistency in your analysis. This is relevant even for a single user suffering from potential workflow fatigue or comparing multiple user’s interpretations. More discretely, is the added value of getting new users familiar with the guidelines more quickly.
The interpretation hub serves as a great educational interface to account for all relevant guideline criteria. Lastly, but critical is our support for integrating these guidelines into the software so that users spend more time processing variants and less time tweaking their bioinformatic pipeline. Case and point is our recent development of automating the ACMG and ClinGen interpretation and reporting standards for copy number variants.
There is of course a lot that goes into this process with optimization and quality control, and there are a lot of layers we aren’t getting into today, so we can always deep dive into these topics on a training session 1 on 1.
I am not going to be able to go over the finer details of the CNV analysis process today. The reason being, that we have recently had another webcast on that same topic, and if you are really interested, I would highly recommend checking out the webcasts in April and May of 2021.
Overall, our goal is to provide a streamlined approach of processing the 5 distinct sections of approximately 80 scoring criteria for the evaluation of everything from small intragenic CNVs to large aneuploidy level events. The scoring system is on a scale of -1 benign to +1 pathogenic which you can see is represented on the right with a detected pathogenic heterozygous deletion in BRCA2.
Alongside the release of these standards in early 2020, our development team attended all available web sessions provided from the ClinGen group and even got direct feedback from the authors to ensure that our software achieves all goals of the guidelines, making us the first to automate the CNV guidelines. **click**
This scoring scale is based in a 5 level system where the Pathogenic level has a score of 0.99 or above, correlating to a 99% level of pathogenic certainty. The Likely Pathogenic level has a score range of of 0.90 or 0.98 or 90 to 98% certainty.
The Variant of Unknown Significance category is the largest, ranging from positive 0.89 to negative 0.89. Finally we have our final categories of Likely Benign with a -0.90 to -0.98 score, 90% to 98% confidence respectively, and our Benign with the -0.99 or 99% certainty.
The real value of VSClinical is the automation of this scoring system to expedite your path to final report as quickly and reliably as possible.
And with that, let’s go ahead and transition over to my different VarSeq projects.
Before we start diving into the subject, I wanted mention our appreciation for our grant funding from NIH.
The research reported in this publication was supported by the National institute of general medical sciences of the national institutes of health under the listed awards.
Additionally we are also grateful for receiving local grant funding from the state of Montana. Our PI is Dr. Andreas Scherer who is also the CEO at Golden Helix and the content described today is the responsibility of the authors and does not officially represent the views of the NIH.
So with that covered, lets take just a few minutes to talk a little bit about our company Golden Helix.
Casey has a couple of marketing updates to share, and don’t forget to enter in all of your questions!
Title: Title with background
Category: Images
Tags: background, image, picture, half, window
Title: Title with background
Category: Images
Tags: background, image, picture, half, window