The document provides a comprehensive overview of single-cell RNA sequencing (scRNA-seq) workflows, discussing the importance of single-cell analysis, current platforms, costs, and experimental design considerations. It covers various analytical methods such as transcript counting, normalization, dimensionality reduction, clustering, and differential expression analysis, highlighting the intricacies involved in data interpretation. Additionally, the document offers resources for further exploration and datasets relevant to scRNA-seq studies.
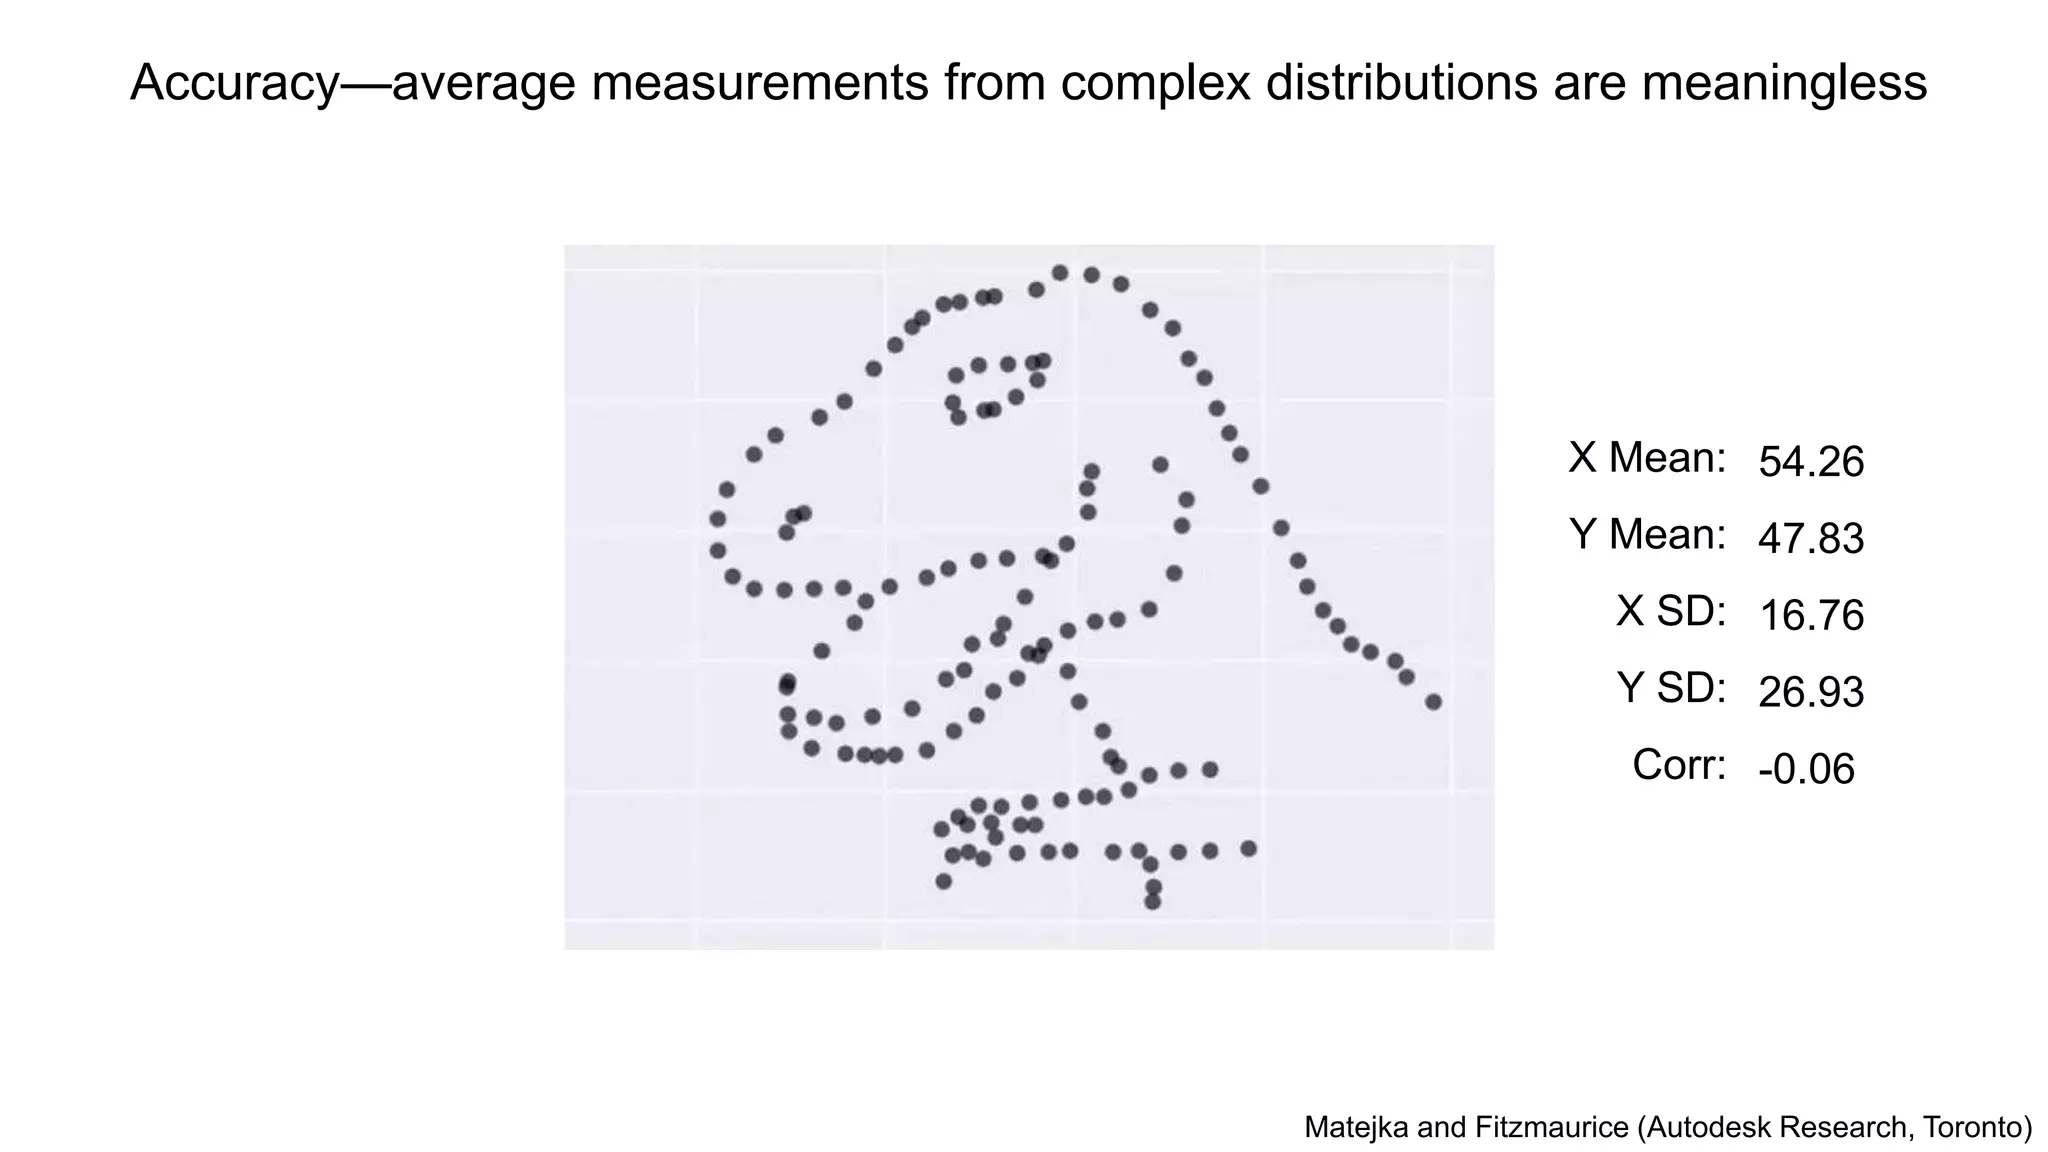
Accuracy—average measurements fromcomplex distributions are meaningless
X Mean:
Y Mean:
X SD:
Y SD:
Corr:
54.26
47.83
16.76
26.93
-0.06
Matejka and Fitzmaurice (Autodesk Research, Toronto)
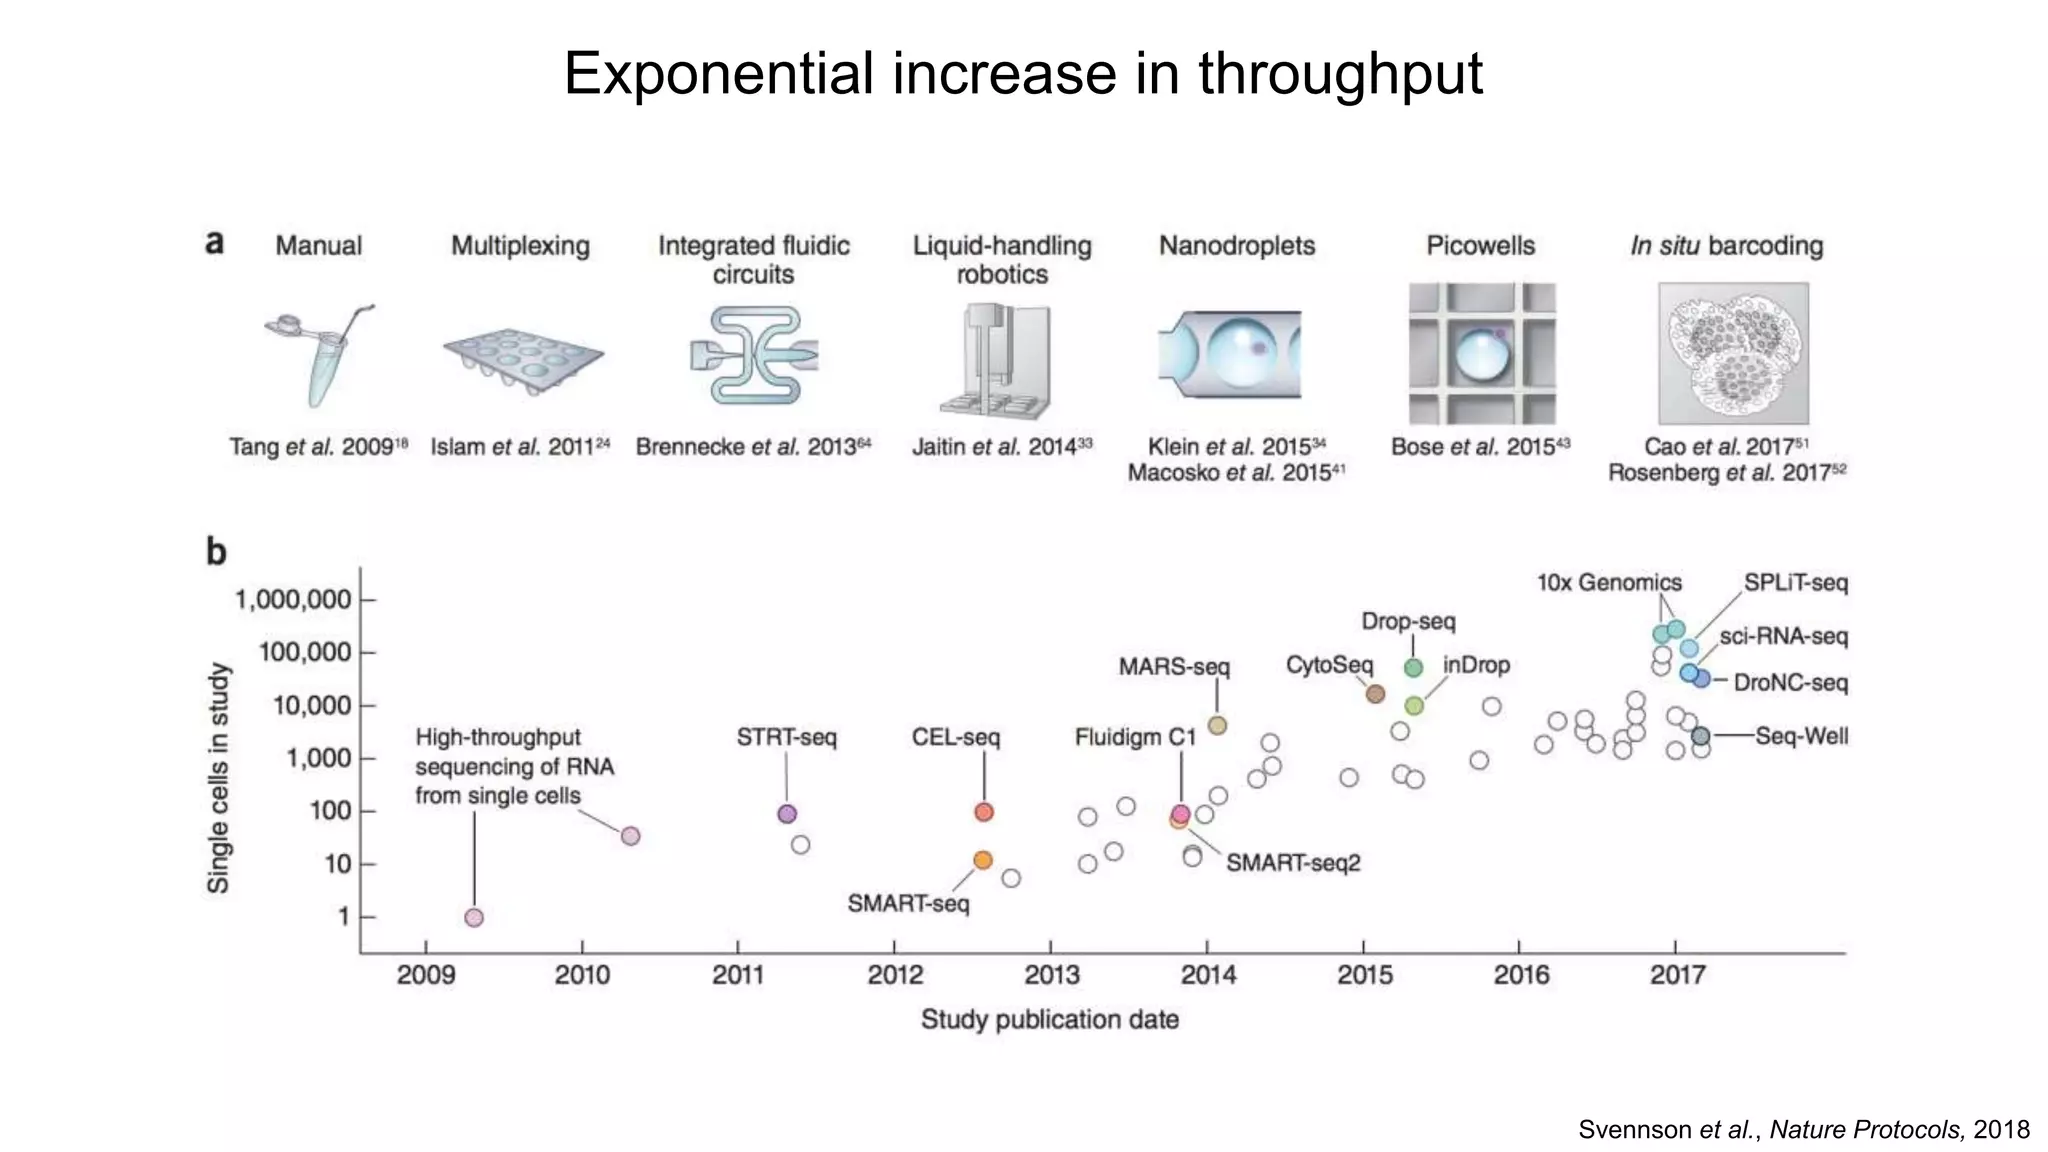
5.
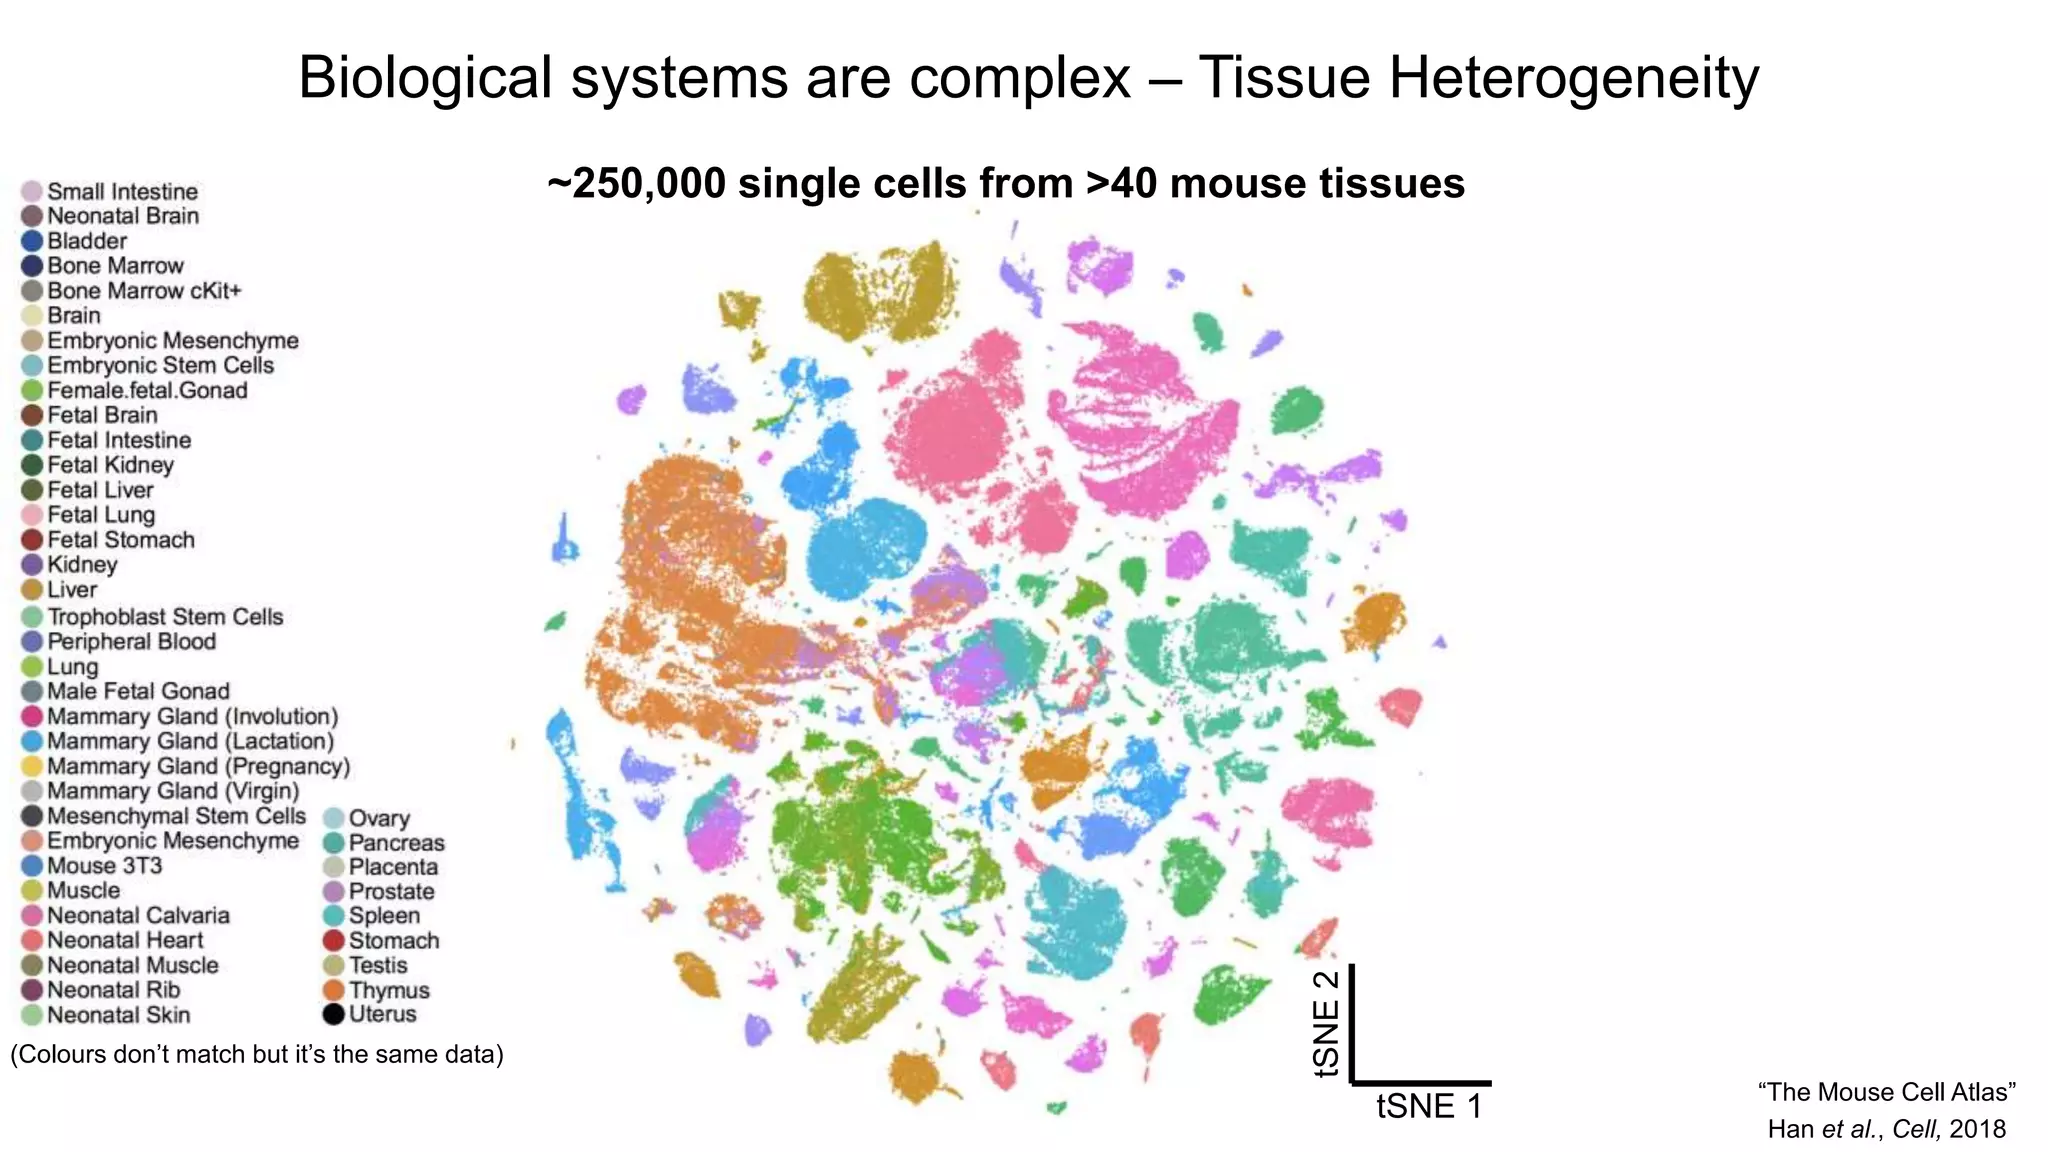
Biological systems arecomplex – Tissue Heterogeneity
~250,000 single cells from >40 mouse tissues
Han et al., Cell, 2018
tSNE 1
tSNE2
“The Mouse Cell Atlas”
(Colours don’t match but it’s the same data)
6.
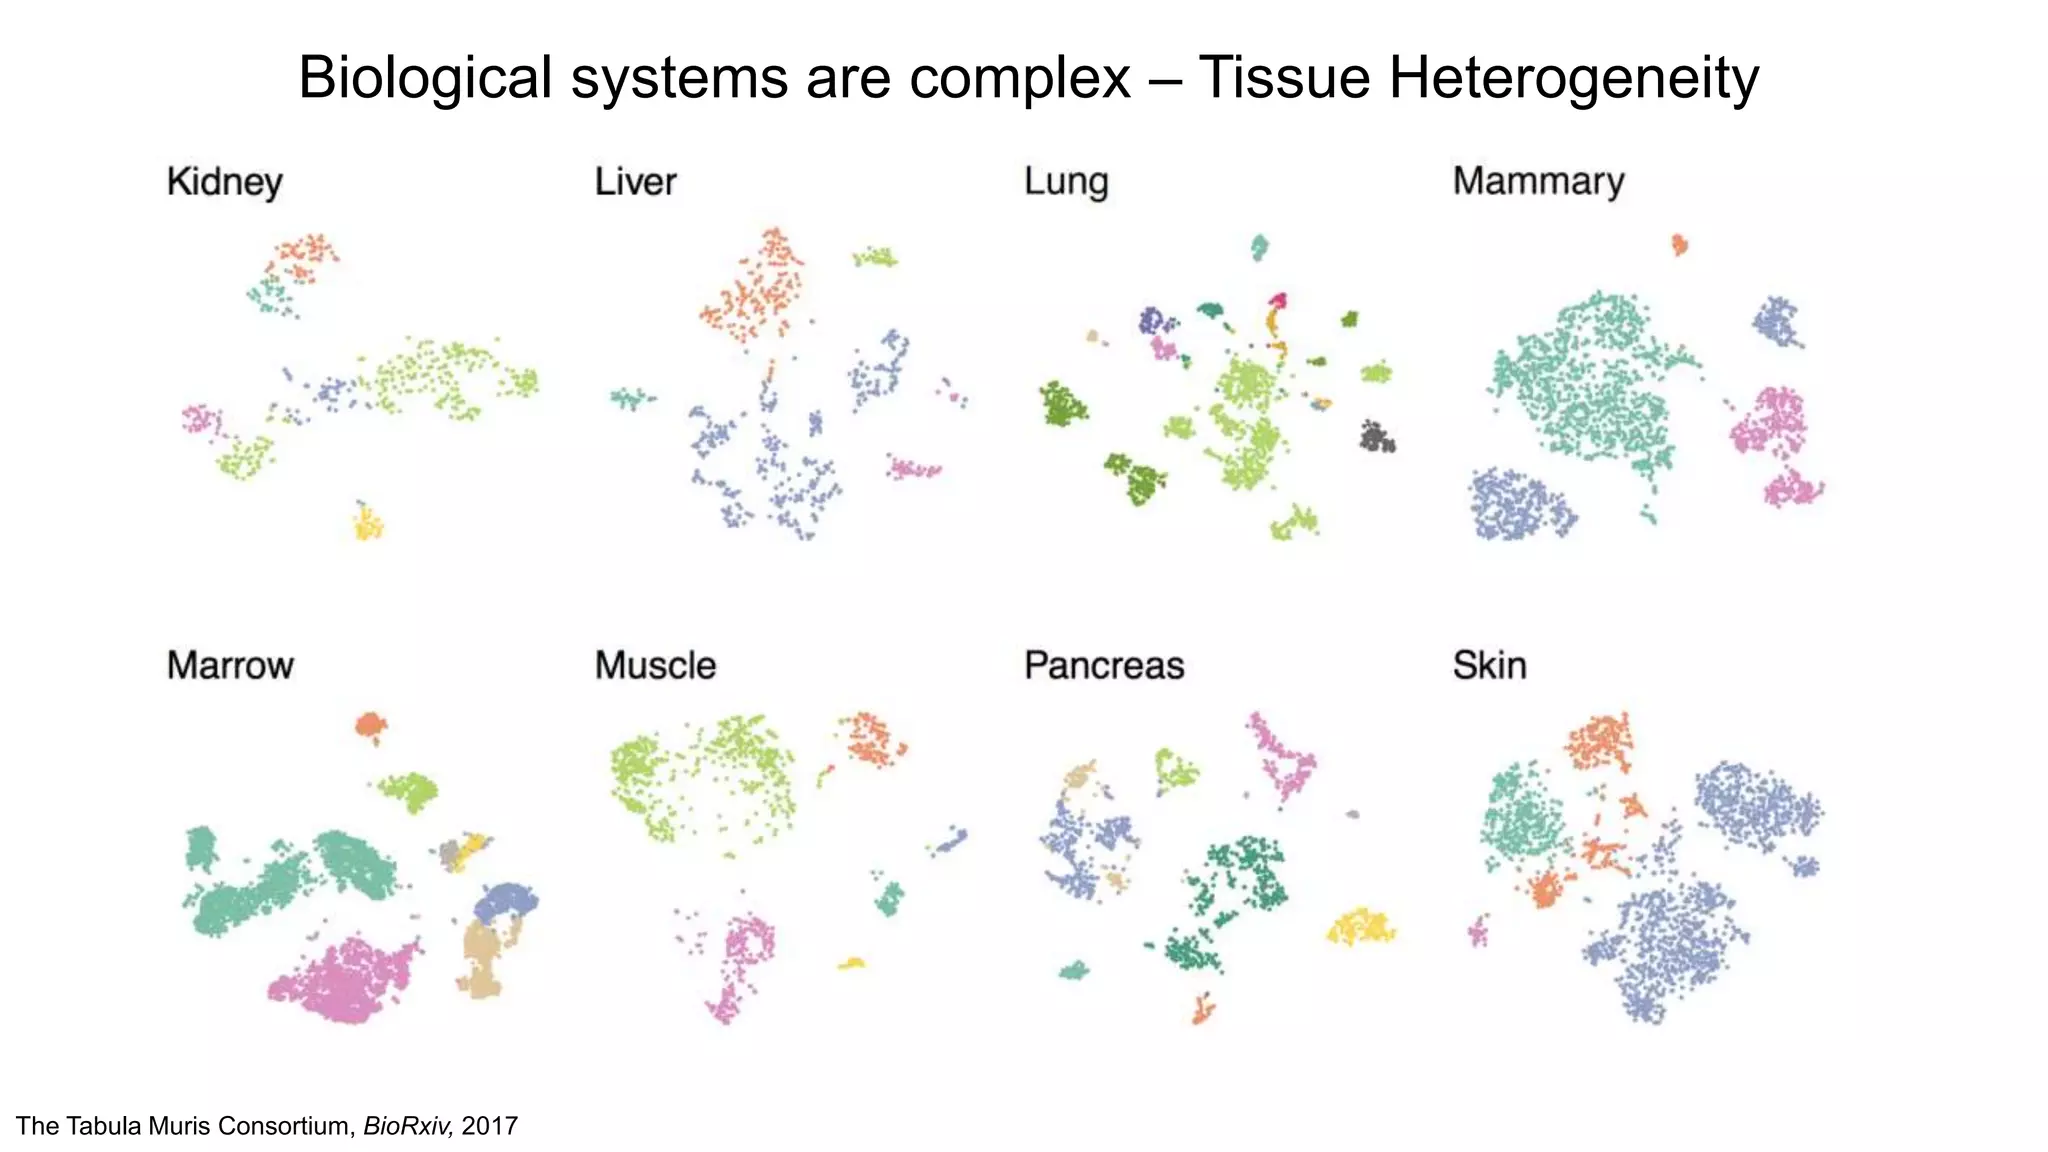
The Tabula MurisConsortium, BioRxiv, 2017
Biological systems are complex – Tissue Heterogeneity
7.
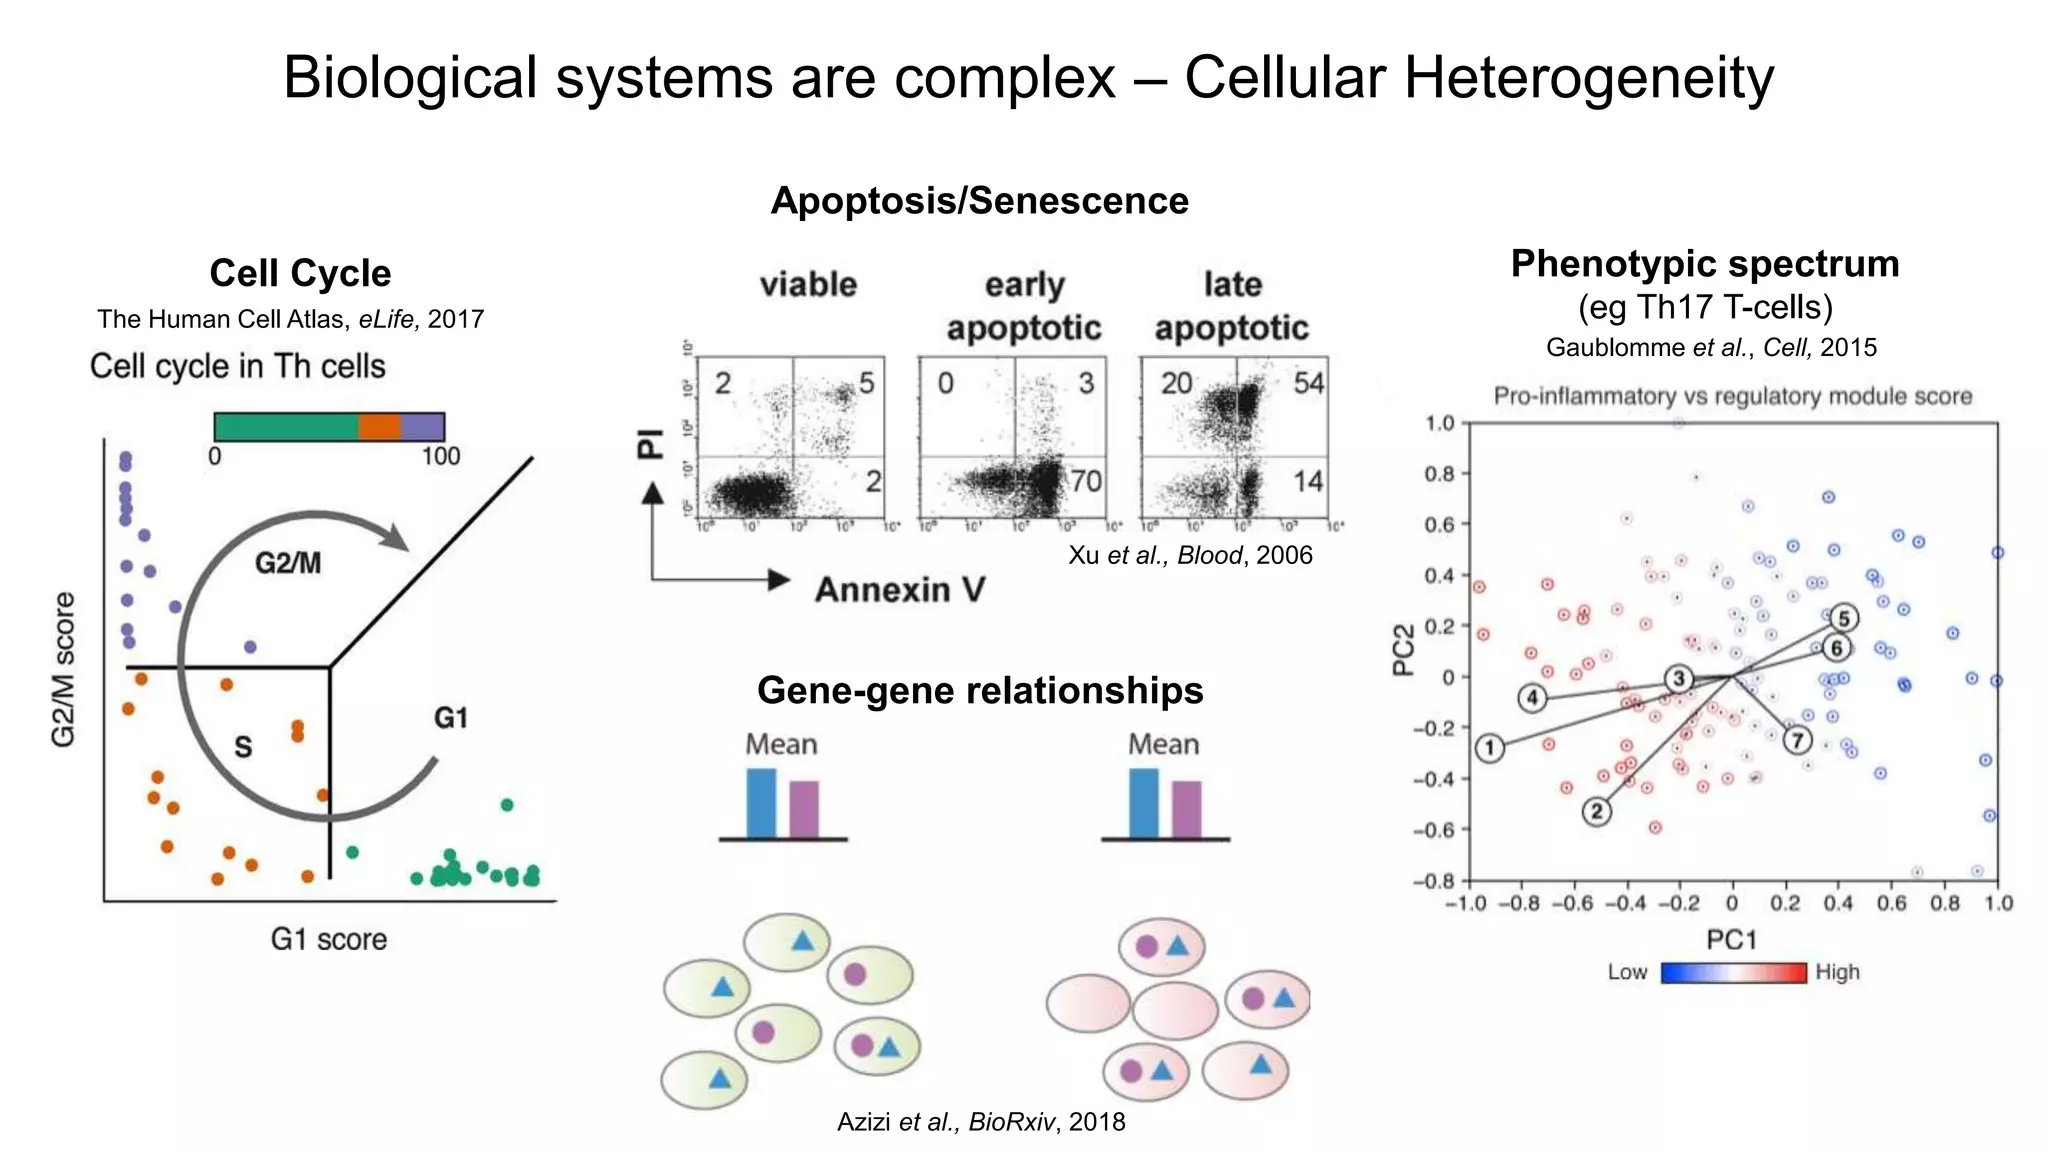
Cell Cycle
Apoptosis/Senescence
Xu etal., Blood, 2006
The Human Cell Atlas, eLife, 2017
Phenotypic spectrum
(eg Th17 T-cells)
Gaublomme et al., Cell, 2015
Gene-gene relationships
Biological systems are complex – Cellular Heterogeneity
Azizi et al., BioRxiv, 2018
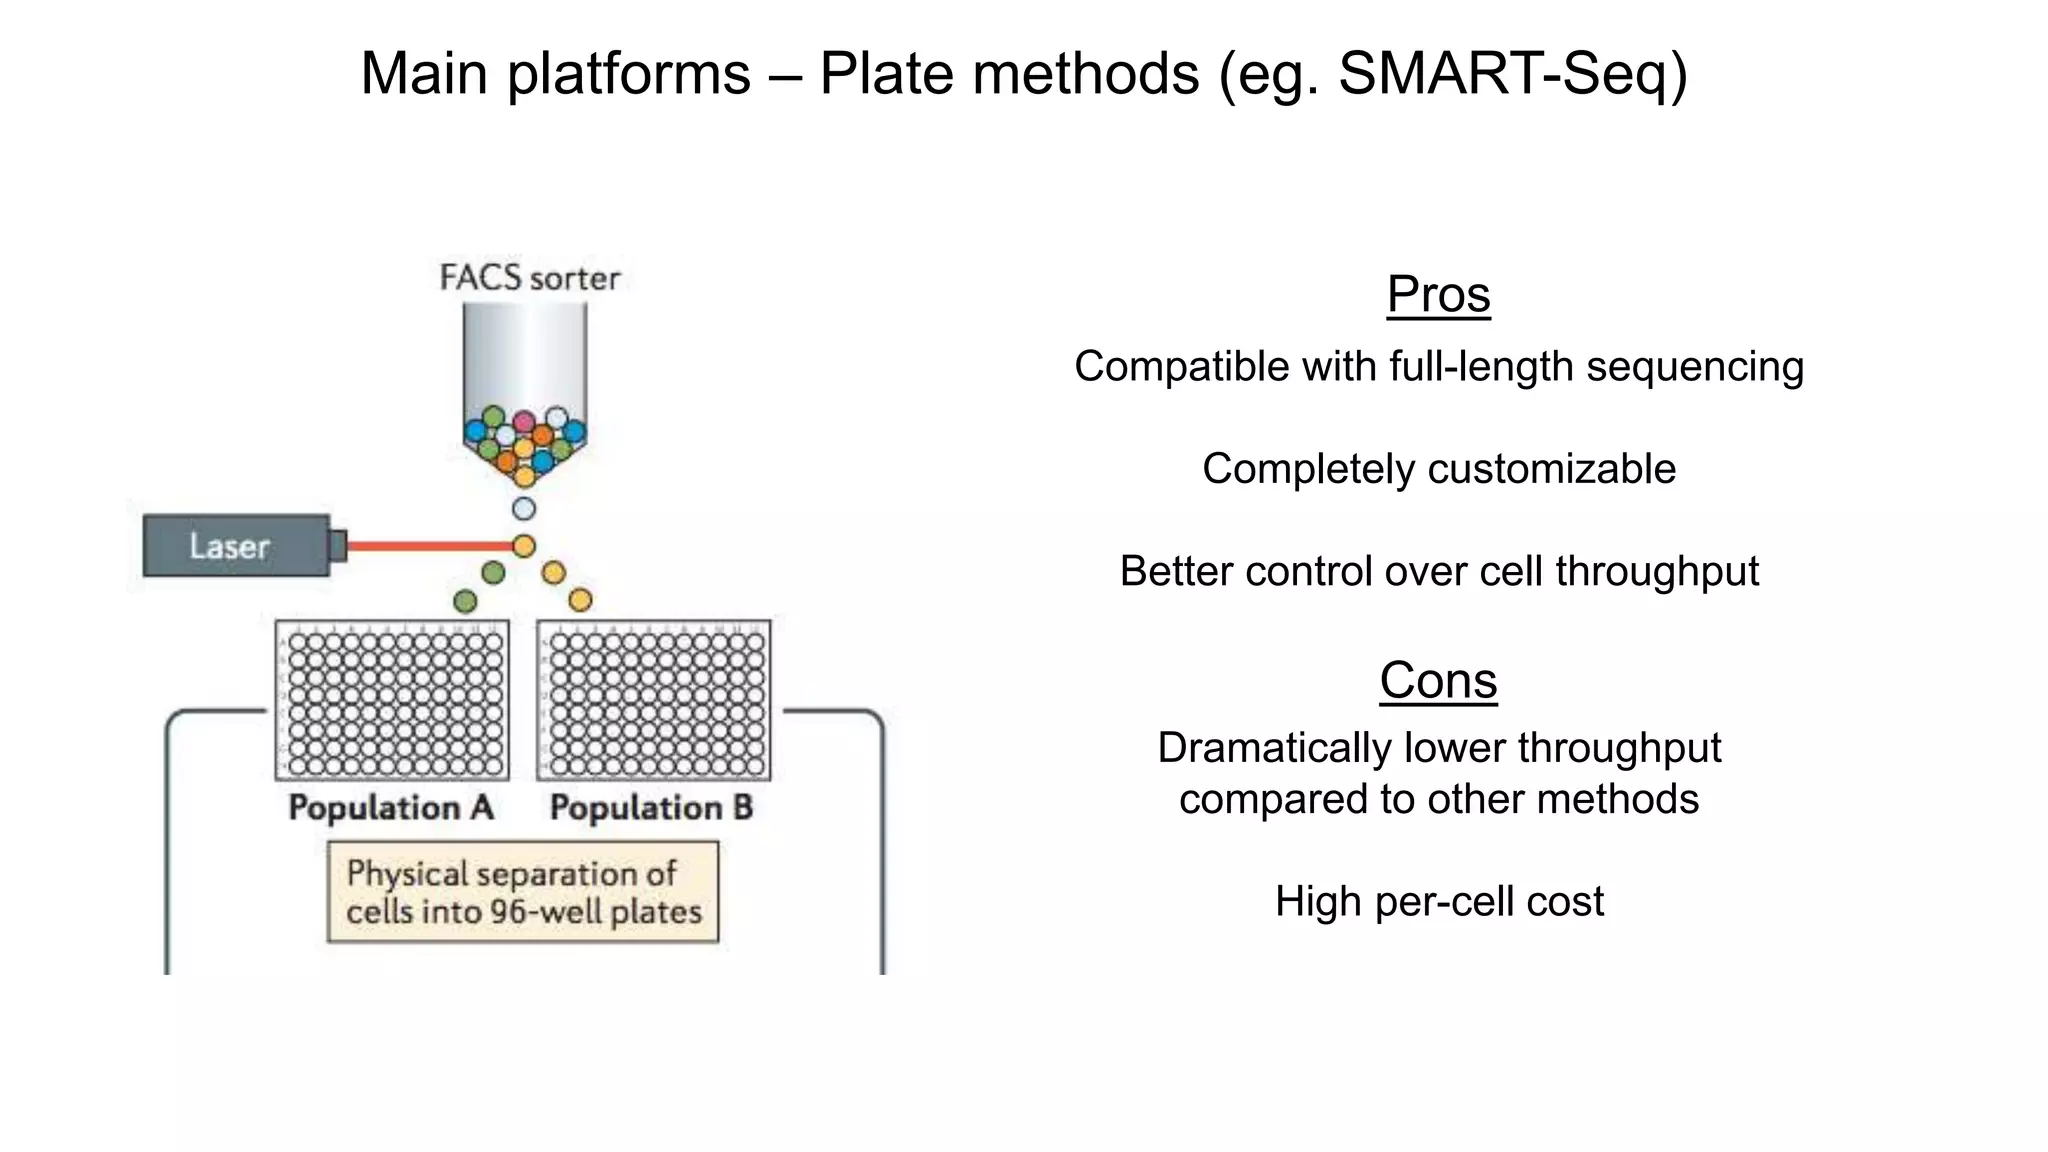
Main platforms –Plate methods (eg. SMART-Seq)
Pros
Compatible with full-length sequencing
Completely customizable
Better control over cell throughput
Cons
Dramatically lower throughput
compared to other methods
High per-cell cost
11.
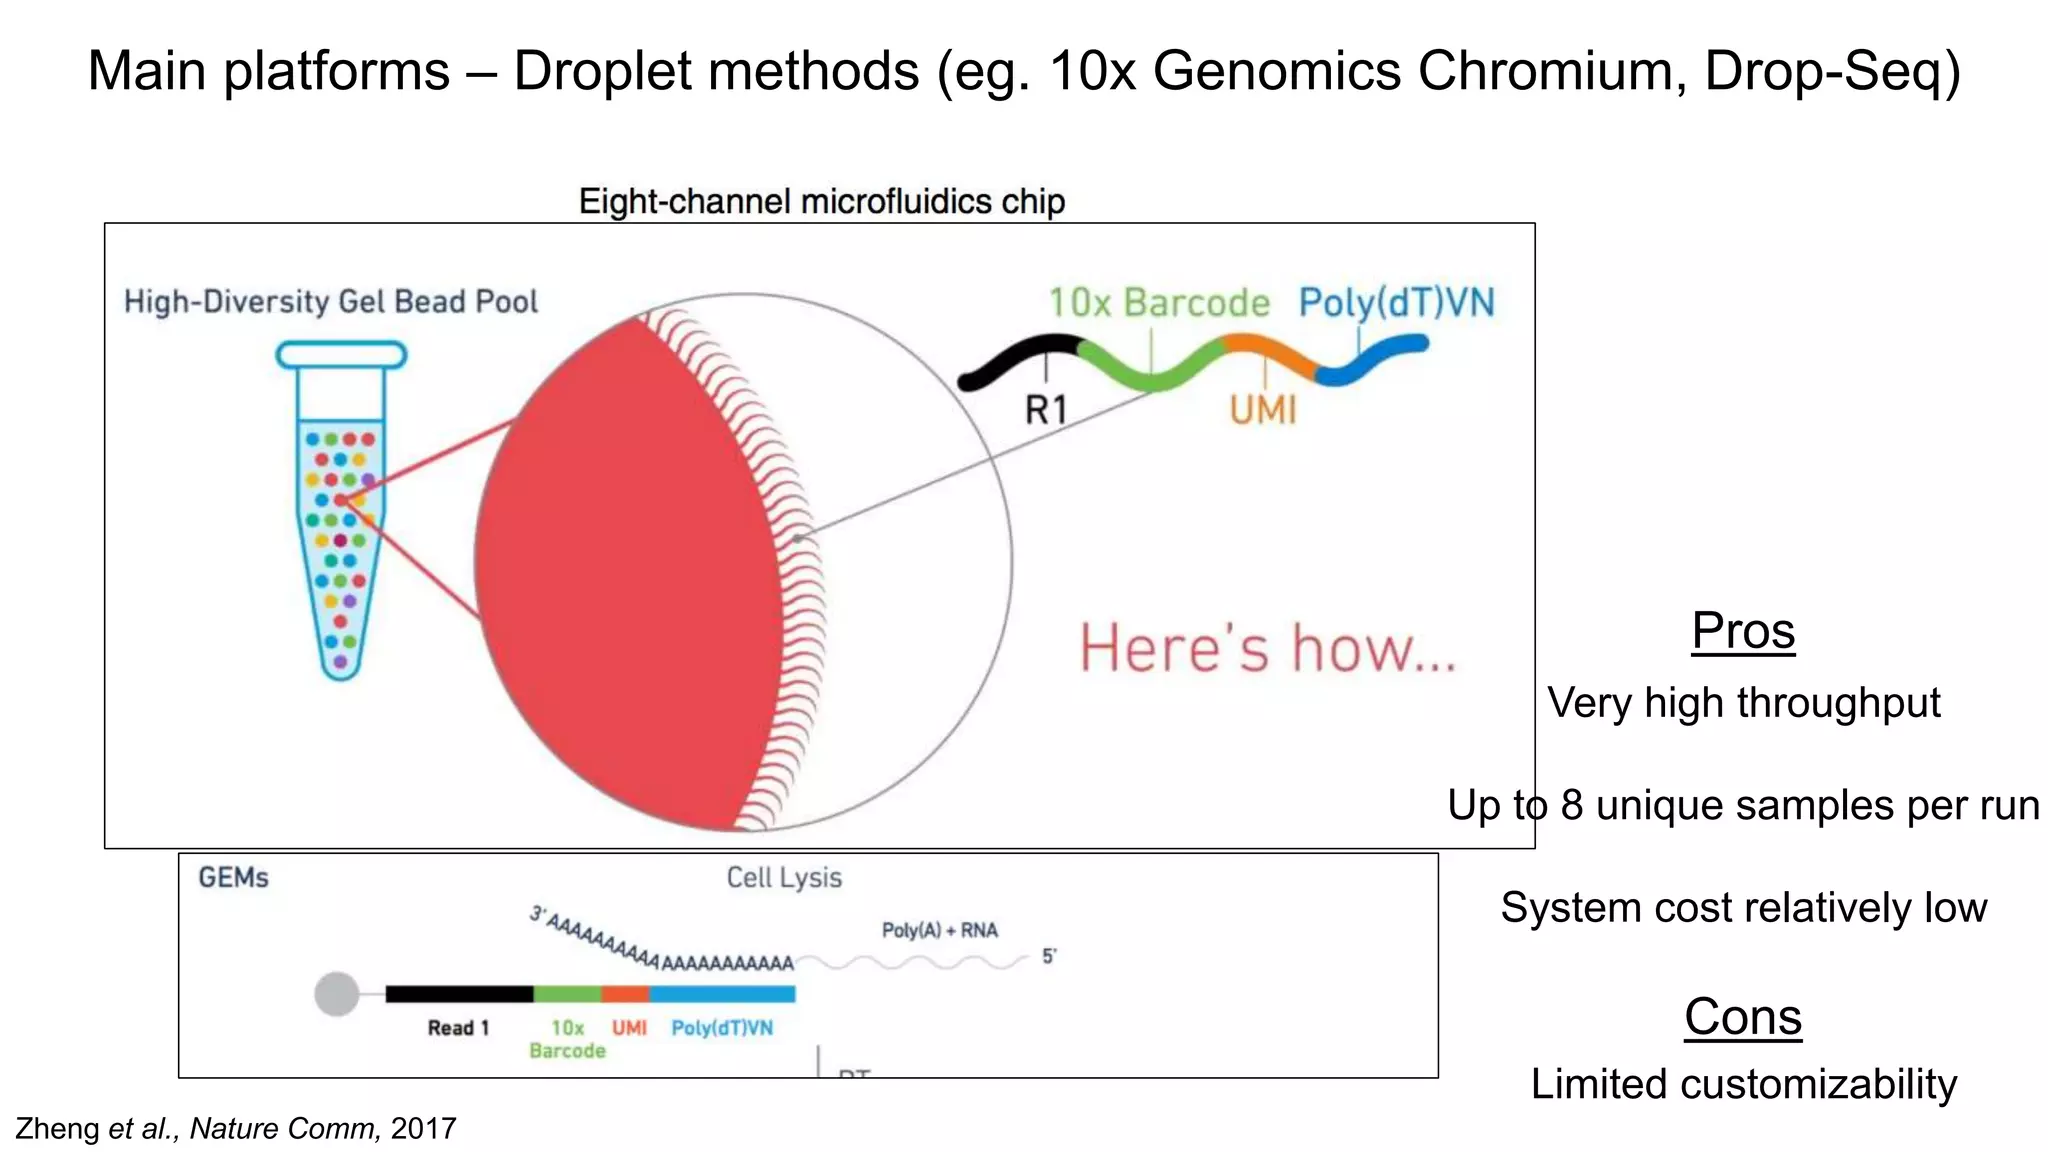
Main platforms –Droplet methods (eg. 10x Genomics Chromium, Drop-Seq)
Pros
Very high throughput
Up to 8 unique samples per run
System cost relatively low
Cons
Limited customizability
Zheng et al., Nature Comm, 2017
12.
Approximate cost breakdownfor 10x Genomics experiment
Consumables
10x Reagents (Beads, enzyme, etc)
Microfluidics chip
HiSeq4000 PE100 Lane
(~350,000,000 reads)
Sequencing options
NextSeq500 150-cycle
(~400,000,000 reads)
NextSeq500 75-cycle
(~400,000,000 reads)
Costs ($CAD)
$2900/sample (max throughput = ~10,000 cells/sample)
$320 for an 8-sample chip (consumable; no re-use)
$2550
$3700
$1800
Enough for about 8000 cells*
How deep tosequence?
But we don’t necessarily need to
detect everything in every cell!
# of genes saturates around 1 million reads
Ziegenhain et al., Molecular Cell, 2017
General Rule: “…when the number of genes required to
answer a given biological question is small, then greater
transcriptome coverage is more important than analyzing large
number of cells.” Torre et al., Cell Systems, 2018
My current targets
Identifying different cell types present: 25-50k reads per cell
Identifying transcriptional dynamics within a population:
50-100k reads per cell
15.
How many cells?
Twomain things to consider
1) How many cell types are there?
2) What is the proportion of the rarest cell type you’re interested in?
10x Genomics currently allows for each run to yield anywhere from ~500-10,000 cells
Satija Lab “How Many Cells”
power calculator
https://satijalab.org/howmanycells
Caution: Do you actually know how many cell types are there? What about cell states?
The current trend in the field seems more focused in increasing cell #
16.
What about replicates?
Itkind of depends…
Replicates would always be good, but each replicate adds a significant cost right now, so we have to
ask if it’s worth it
What biological variability are you trying to capture with replicates?
• Biological variability between cells is captured in scRNA-seq (many measurements in one “replicate”)
• Measurements are not confounded by differences in population composition
• Genetic differences could contribute to important variation (eg. Comparing two tumour samples)
What technical variability are you trying to capture with replicates?
• Batch effects are always possible, but not all experiments involve batching
• The use of UMIs has been said to reduce technical variability by ~50% (due to mitigation of PCR
artifacts)
• Culture conditions (eg. Cell confluence, user-supplied growth factors, etc) could lead to variation
• Tissue dissociation protocols can lead to variable purification efficiencies
Technical replicate of PBMCs
has near-perfect overlap
Cancer cells dramatically
different between patients
17.
What are yourquestions?
Common questions for scRNA-seq experiments
What cell types exist in this tissue?
Can we identify new cell types/subtypes?
What are the proportion of each cell type in this tissue?
What are the gene expression patterns that define each cell type?
How do cell types relate to each other in terms of their expression?
Can we reconstruct transcriptional dynamics associated with differentiation? (More on this later)
Can we construct gene regulatory networks?
Transcript Counting
CellRanger (10xGenomics)
Fastq file
Aligns each read to transcriptome
Removes duplicate UMIs
Sorts reads by cell (10x) barcode
Counts reads aligning to each gene for each cell
Gene-barcode matrix
21.
QC and Filtering
Commonparameters worth exploring
UMI distribution
Number of genes detected
Percent of UMIs aligning to mitochondrial genes
Goal: Remove low-quality cells and potential doublets Oddly-high nUMI/nGene could be doublets
(~90 doublets per 1000 cells)
High mitochondrial genes is associated with
cell death (loss of membrane integrity >
cytoplasmic loss > enrichment of mitochondrial
content)
22.
Normalization (The inelegantway)
Goal: Make profiles of each cell comparable
Simplest Approach: Scaling library size to some arbitrary value (eg. 10,000)
Cell 1 (5,000 UMI total)
Gene A: 10 UMIs
Before Normalization
Cell 2 (20,000 UMI total)
Gene A: 40 UMIs
Cell 1 (10,000 UMI total)
Gene A: 20 UMIs
After Normalization
Cell 2 (10,000 UMI total)
Gene A: 20 UMIs
(10 UMI / 5,000 UMI) x 10,000 UMI
(40 UMI / 20,000 UMI) x 10,000 UMI
But this alone isn’t sufficient to
remove the effect of seq depth
on the structure of the data
Not uncommon to “regress out”
the effect of nUMI and percent
mito on each cell
After regressing out nUMI
and percent mito
23.
Normalization (The inelegantway)
In some systems, cell cycle stage can confound biological variation of interest
Cell cycle score can also be regressed out if you want to “look past” the effect of cell cycle
24.
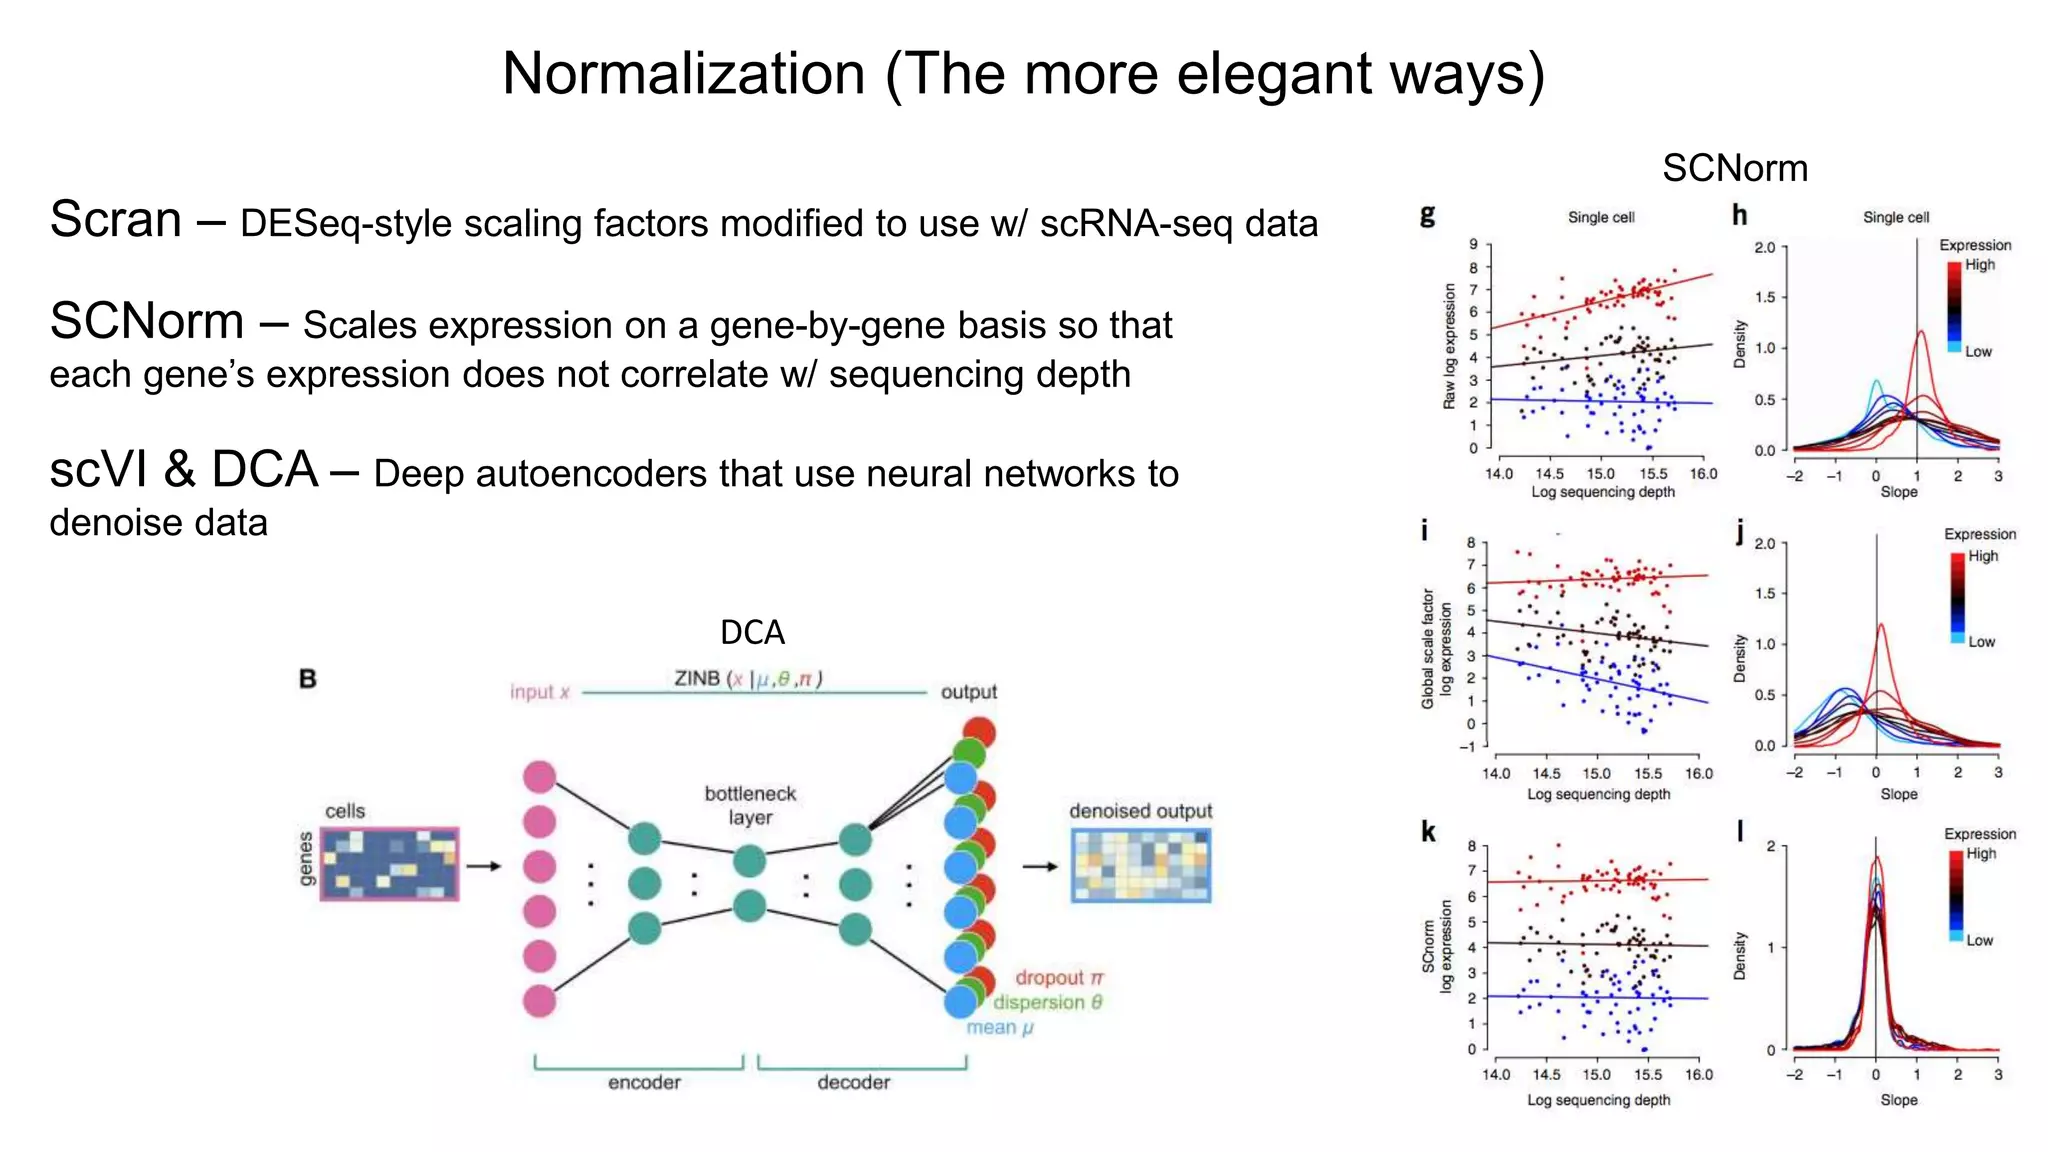
Normalization (The moreelegant ways)
Scran – DESeq-style scaling factors modified to use w/ scRNA-seq data
SCNorm – Scales expression on a gene-by-gene basis so that
each gene’s expression does not correlate w/ sequencing depth
SCNorm
scVI & DCA – Deep autoencoders that use neural networks to
denoise data
DCA
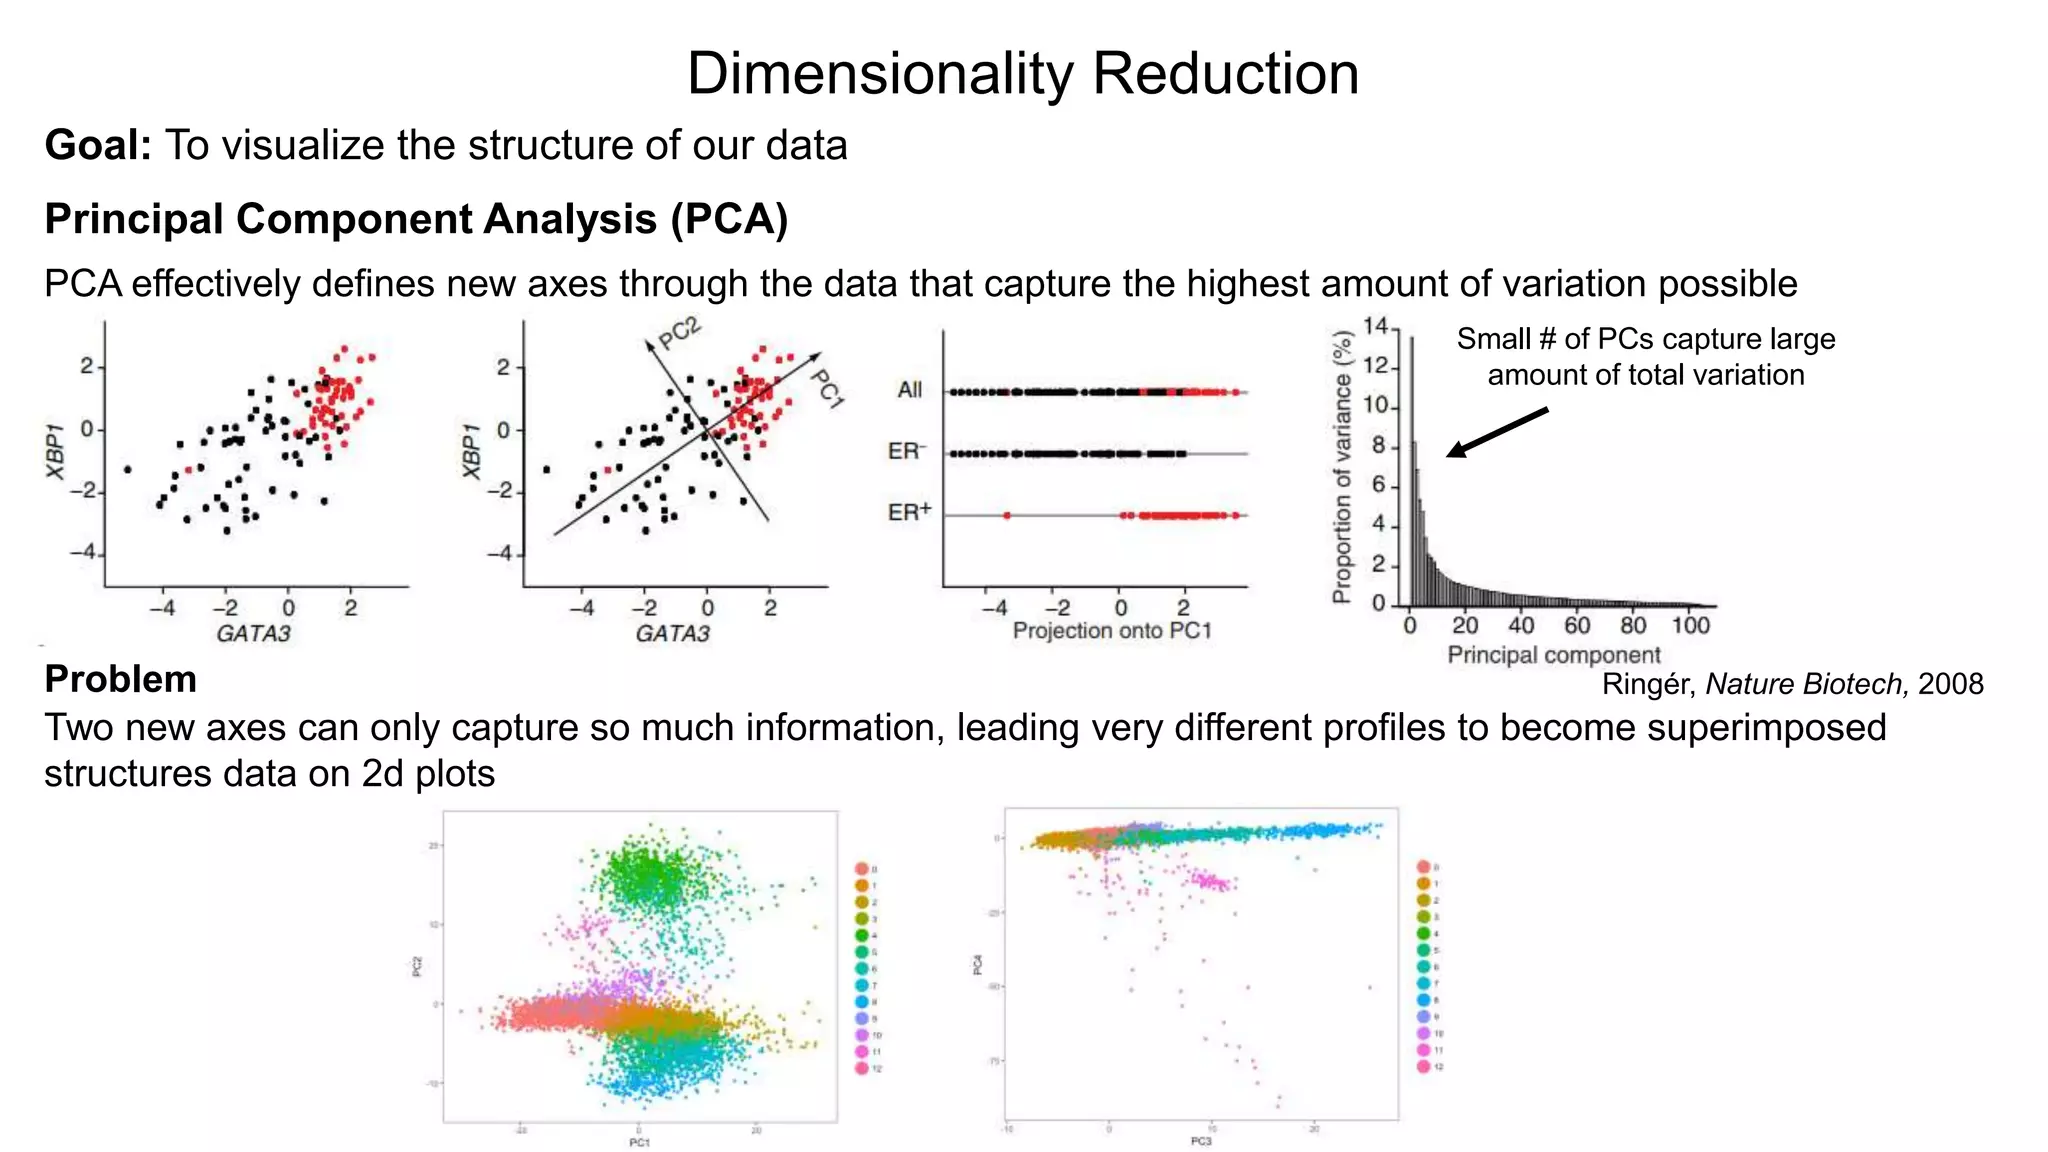
Dimensionality Reduction
Goal: Tovisualize the structure of our data
Principal Component Analysis (PCA)
PCA effectively defines new axes through the data that capture the highest amount of variation possible
Small # of PCs capture large
amount of total variation
Problem
Two new axes can only capture so much information, leading very different profiles to become superimposed
structures data on 2d plots
Ringér, Nature Biotech, 2008
27.
Dimensionality Reduction
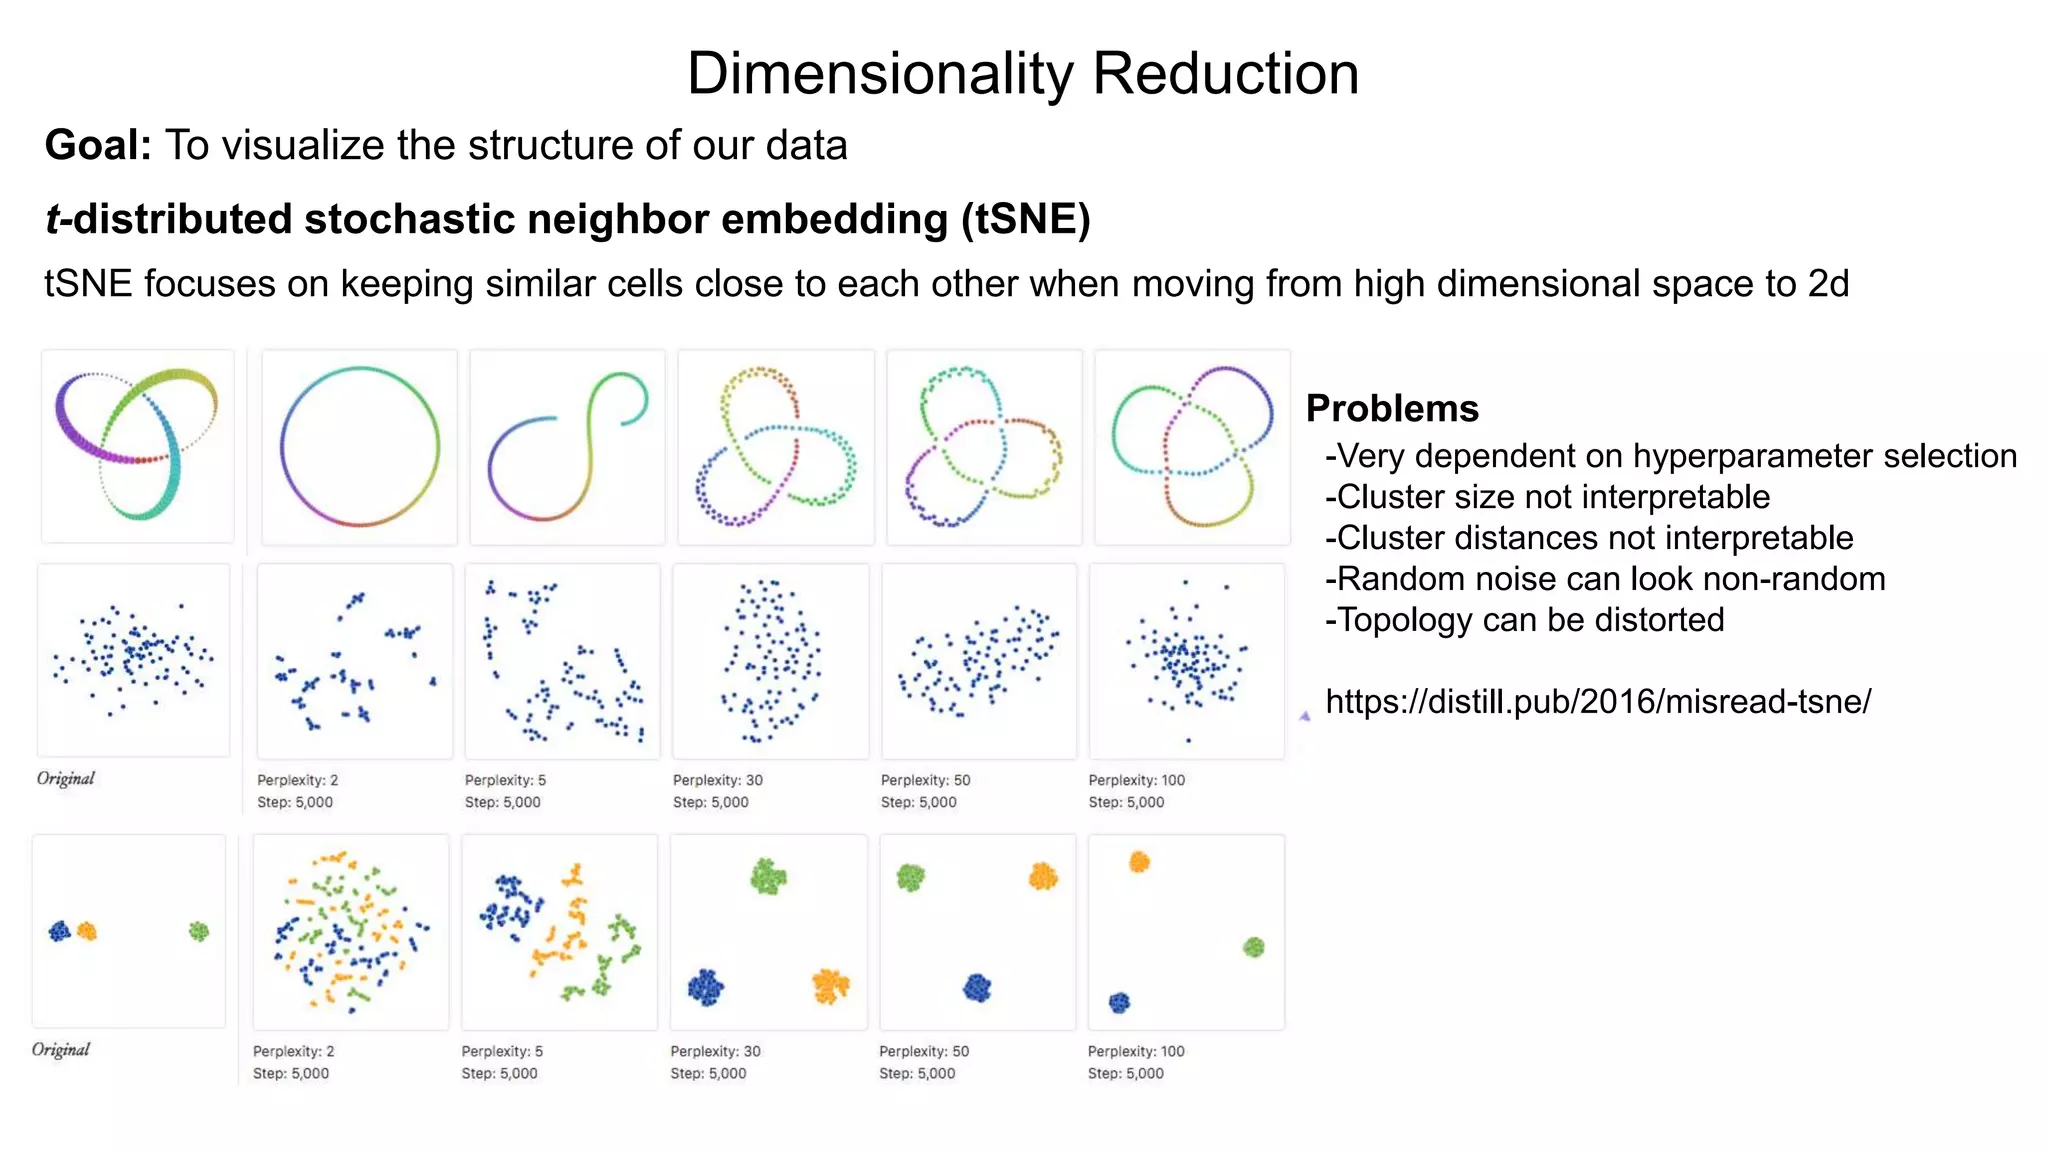
Goal: Tovisualize the structure of our data
t-distributed stochastic neighbor embedding (tSNE)
tSNE focuses on keeping similar cells close to each other when moving from high dimensional space to 2d
Han et al., Cell, 2018
“The Mouse Cell Atlas”
Problems
-Very dependent on hyperparameter selection
-Cluster size not interpretable
-Cluster distances not interpretable
-Random noise can look non-random
-Topology can be distorted
https://distill.pub/2016/misread-tsne/
28.
Dimensionality Reduction
Goal: Tovisualize the structure of our data
Diffusion maps
Dimensionality reduction based on diffusion distances through the data. Can identify non-linear, continuous structures
Eigenvectors = Diffusion components
Diffusion map
29.
Dimensionality Reduction
Goal: Tovisualize the structure of our data
Force-directed graphs
Visualize cells based on nearest neighbor structures
Wagner et al., Science, 2018
Repulsion between nodes
Attractive forces added
to edges connecting
nodes (spring functions)
30.
Clustering
Goal: Assign cellsto groups of similar cells
Louvain clustering
Takes a nearest neighbor graph and identifies “communities” of nodes (ie. Clusters of cells) by optimizing a
modularity score, defined by the density of edges within the groupings (a tight cluster would have a lot of edges
connecting the cells of the cluster, but relatively few projecting to nodes outside the cluster—therefore, high edge
density)
31.
Differential Expression /Marker Identification
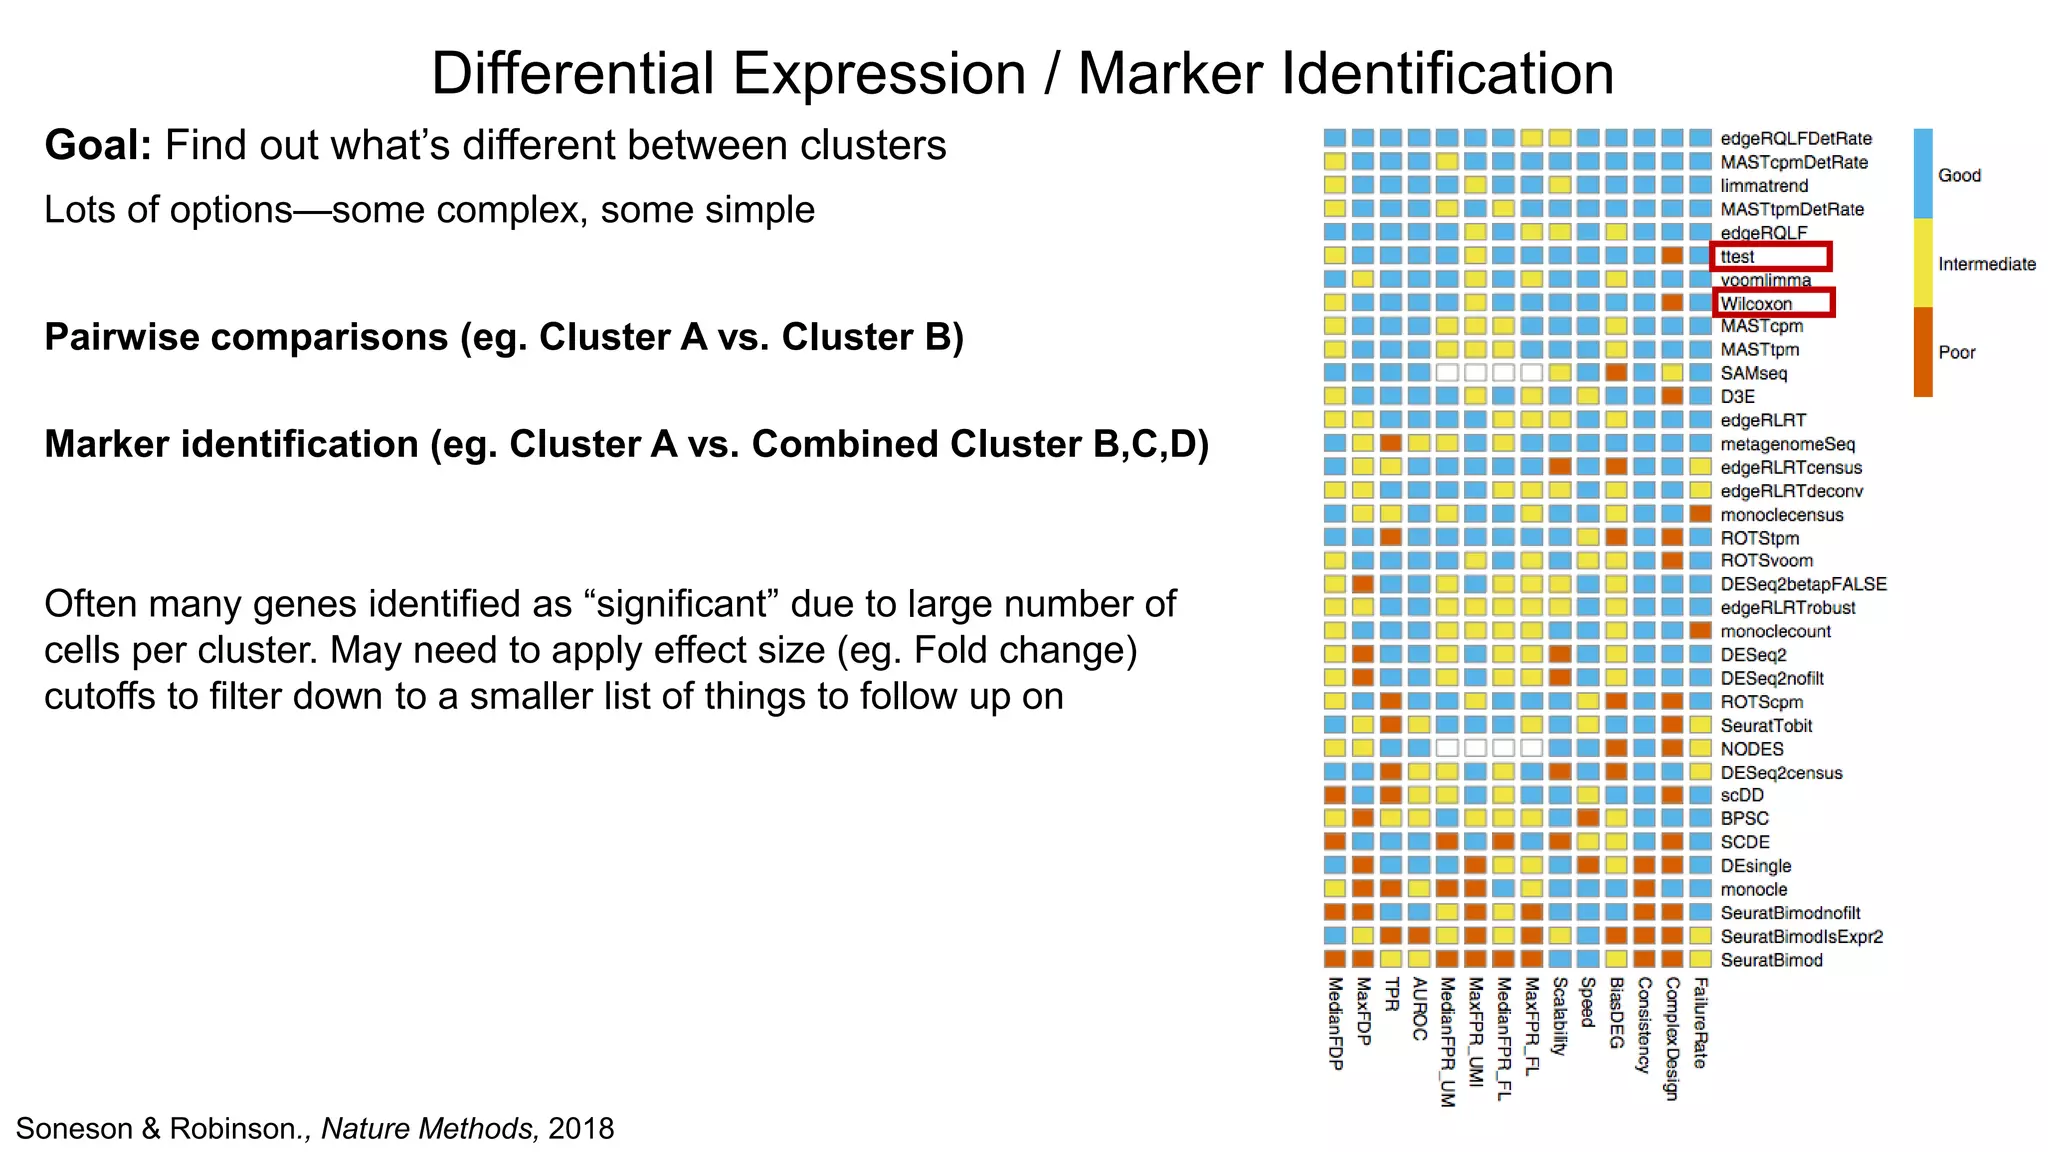
Goal: Find out what’s different between clusters
Lots of options—some complex, some simple
Pairwise comparisons (eg. Cluster A vs. Cluster B)
Marker identification (eg. Cluster A vs. Combined Cluster B,C,D)
Often many genes identified as “significant” due to large number of
cells per cluster. May need to apply effect size (eg. Fold change)
cutoffs to filter down to a smaller list of things to follow up on
Soneson & Robinson., Nature Methods, 2018
Analysis of continuoustranscriptional dynamics
Yi = Pseudotimei + Branchi + (Pseudotimei*Branchi)
Differential expression model for branched trajectories
36.
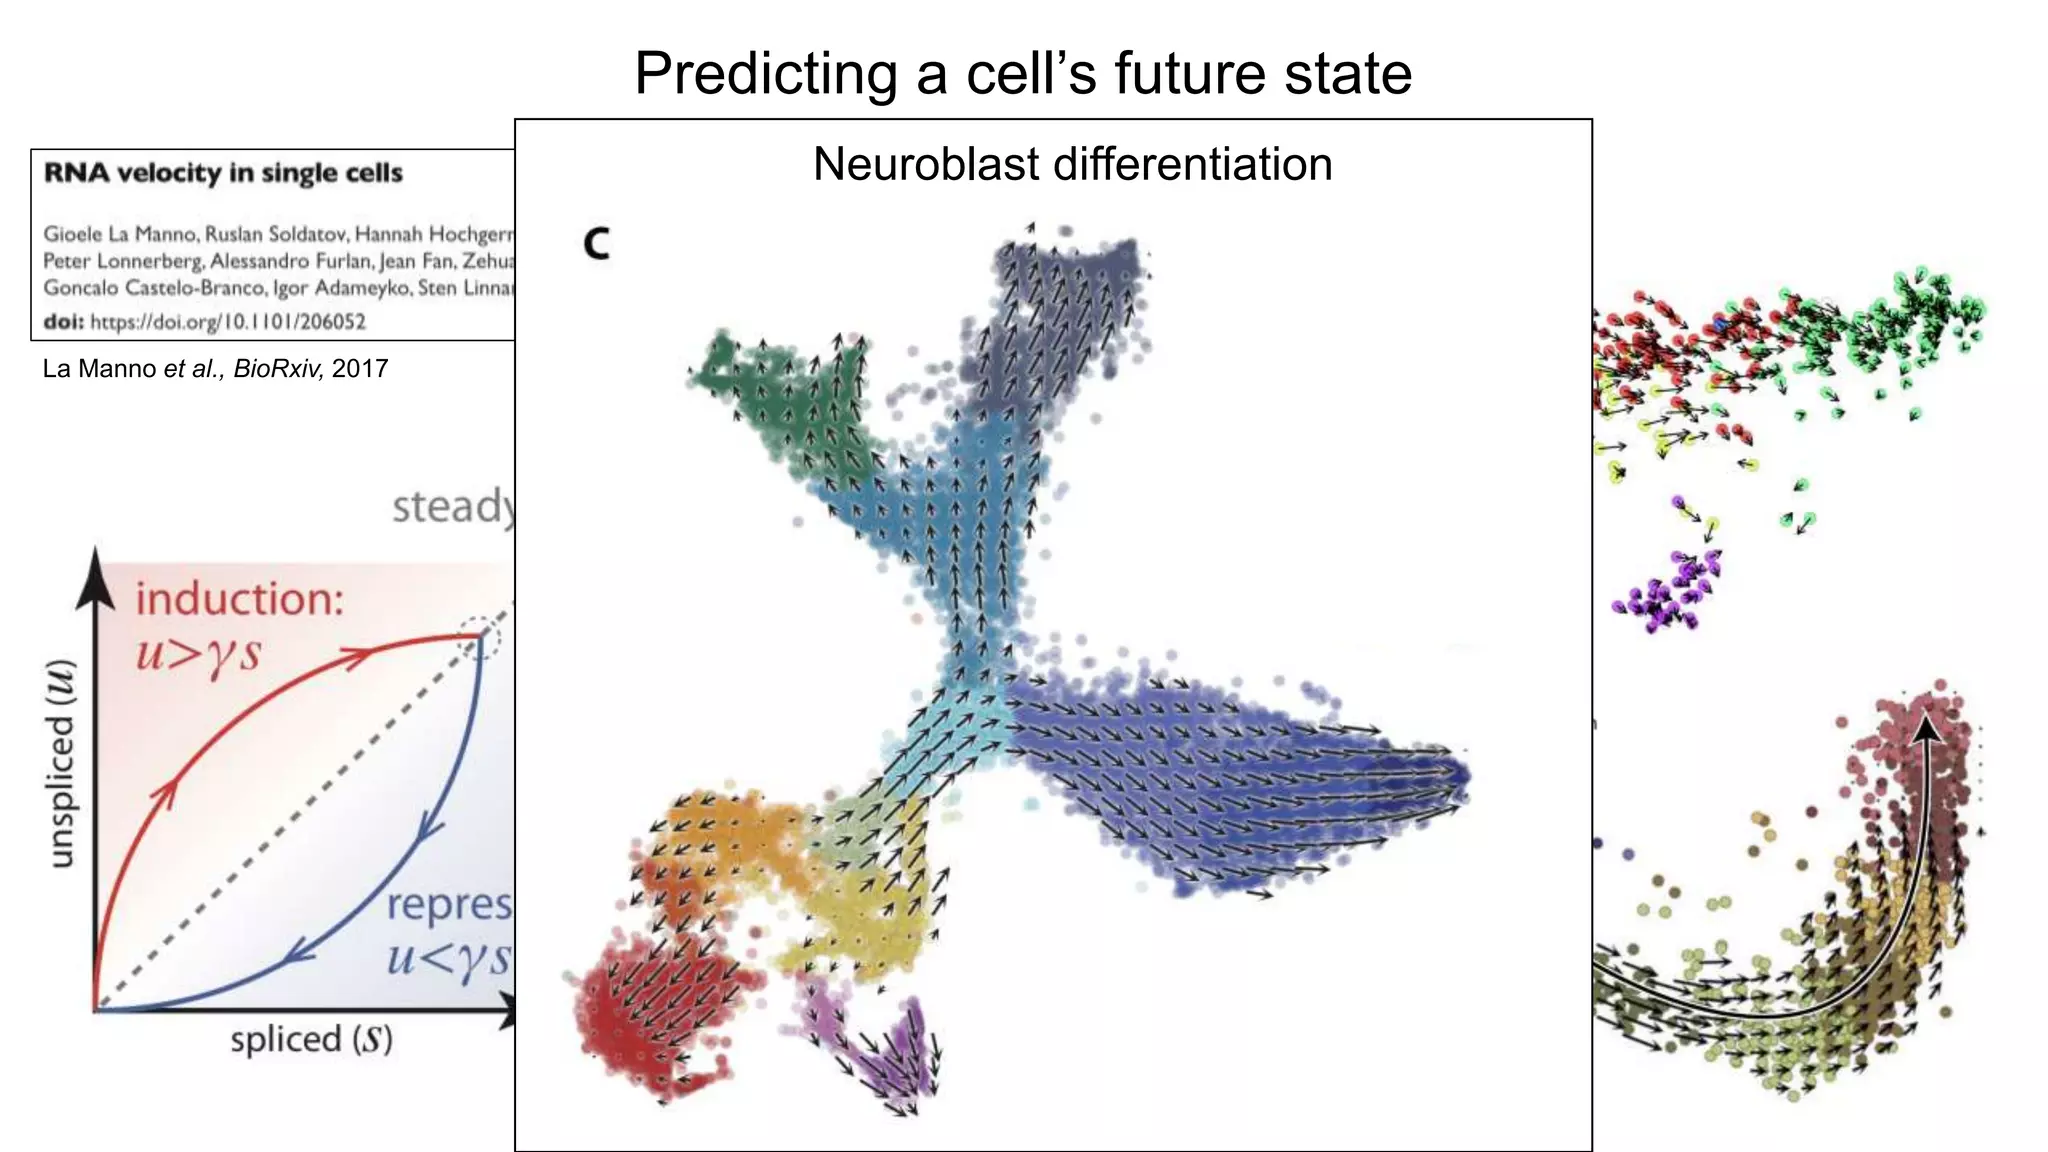
Predicting a cell’sfuture state
La Manno et al., BioRxiv, 2017
Glutaminergic neuronal development
(Forebrain from 10wk human embryo)
Neuroblast differentiation


![[DSC Europe 24] Vladimir Kovacevic - AI Algorithms in Spatial transcriptomics...](https://cdn.slidesharecdn.com/ss_thumbnails/dsceurope24vladimirkovacevic-aialgorithmsinspatialtranscriptomics-dsc2024-241210182247-e6c693ac-thumbnail.jpg?width=640&height=640&fit=bounds)


