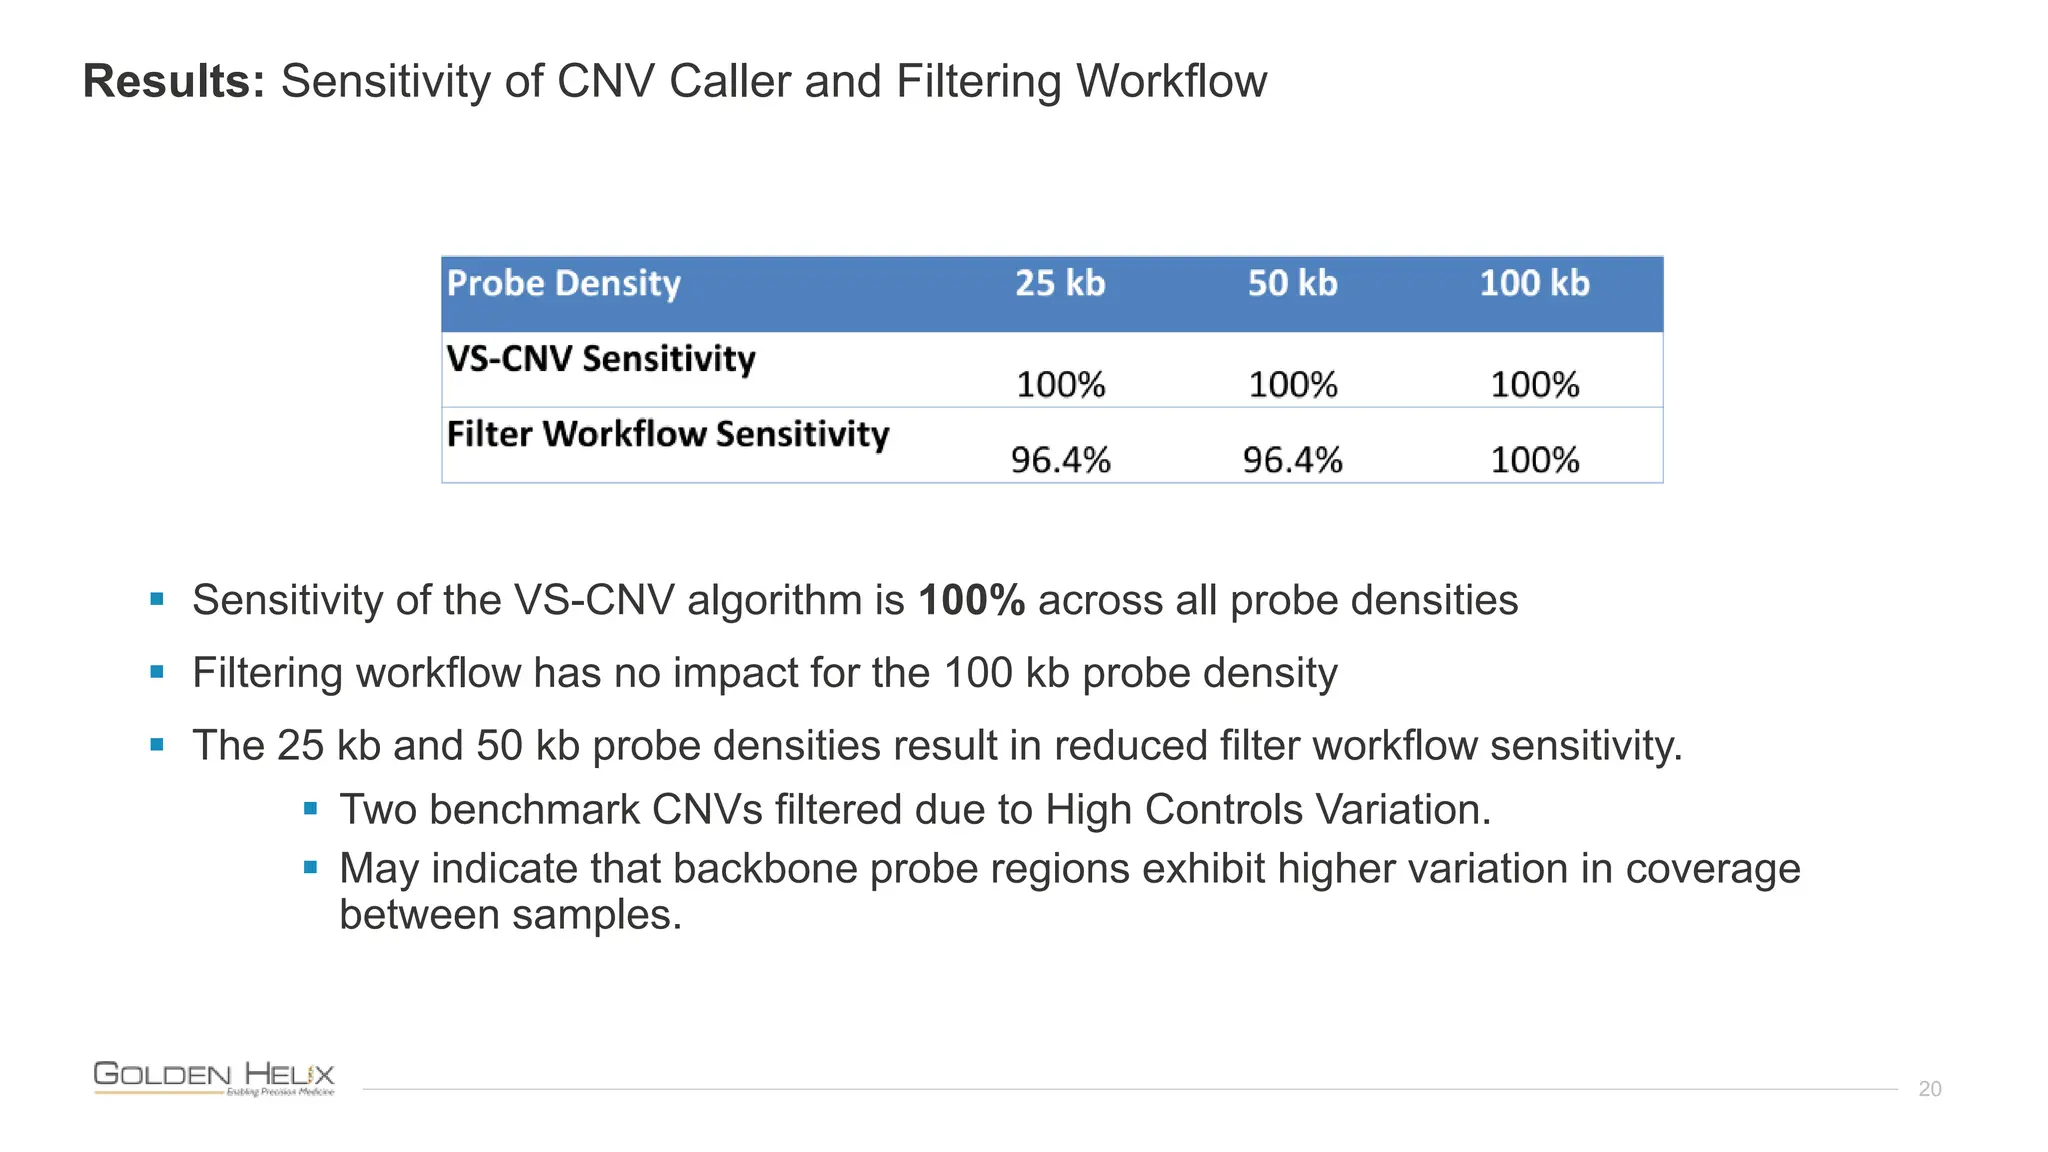
Analyzing Performance of the Twist Exome
with CNV Backbone at Various Probe Densities
Leveraging Golden Helix VS-CNV
February 21, 2024
Presented by Nathan Fortier, Director of Research
2
Analyzing Performance of the Twist Exome
with CNV Backbone at Various Probe Densities
Leveraging Golden Helix VS-CNV
February 21, 2024
Presented by Nathan Fortier, Director of Research
NIH Grant Funding Acknowledgments
4
• Research reported in this publication was supported by the National Institute Of General Medical Sciences of the
National Institutes of Health under:
o Award Number R43GM128485-01
o Award Number R43GM128485-02
o Award Number 2R44 GM125432-01
o Award Number 2R44 GM125432-02
o Montana SMIR/STTR Matching Funds Program Grant Agreement Number 19-51-RCSBIR-005
o NIH SBIR Grant 1R43HG013456-01
• PI is Dr. Andreas Scherer, CEO of Golden Helix.
• The content is solely the responsibility of the authors and does not necessarily represent the official views of the National
Institutes of Health.
ISO Certification 13485:2016
5
• ISO 13485:2016 from TÜV SÜD
• ISO 13485:2016 is an international standard that specifies requirements for a
quality management system (QMS) for organizations involved in the design,
development, production, and servicing of medical devices.
o maintain a quality management system
o demonstrate sufficient risk management
o show consistent tracking of customer satisfaction and safety in the
market
o demonstrate continued improvement efforts on the product and system
level.
• ISO 13485:2016 is designed to objectively document that we are holding
ourselves to the highest quality standards as we are providing innovative
solutions to hospitals, testing labs, and research institutions globally.
Who Are We?
6
Golden Helix is a global bioinformatics company founded in 1998
Filtering and Annotation
ACMG & AMP Guidelines
Clinical Reports
CNV Analysis
CNV Analysis
GWAS | Genomic Prediction
Large-N Population Studies
RNA-Seq
Large-N CNV-Analysis
Variant Warehouse
Centralized Annotations
Hosted Reports
Sharing and Integration
Pipeline: Run Workflows
Cited in 1,000s of Peer-Reviewed Publications
7
Over 400 Customers Globally
8
The Golden Helix Difference
9
FLEXIBLE DEPLOYMENT
On premise or in a private
cloud
BUSINESS MODEL
Annual fee for software,
training and support
CLIENT CENTRIC
Unlimited support from the
very beginning
SINGLE SOLUTION
Comprehensive cancer and
germline diagnostics
SCALABILITY
Gene panels to whole
exomes or genomes
THROUGHPUT
Automated pipeline
capabilities
QUALITY
Clinical reports correct the
first time
Today’s Presenters
10
Rana Smalling, PhD
Field Application Scientist
Nathan Fortier
Director of Research
Analyzing Performance of the Twist Exome Kit Leveraging VS-CNV
11
 Critical evidence needed for many genetic tests
 Common driver specific cancers, causal hereditary variation
• EGFR Exon 19 deletion common in lung cancer
• PIK3CA Amplification in breast cancer
 Large events used heavily in diagnostics
• Chromosome 13 deletion common in melanoma
• Autism Spectrum Disorder (ASD)
• Developmental Delay (DD)
• Intellectual Delay (ID)
CNVs in Clinical Testing
12
Power of NGS CNV Detection
Small:1
50b+
Medium:
1 – 10Kb
Large:
10Kb+
Gene
panel
Whole
exome
Whole
genome
MLPA
 
CMA
 
VS-CNV
     
Detectable events Supported Data types
 One single testing paradigm
 True simplification of clinical workflow
 Saves time and money – all on site
13
Addressing Issues - CNV Detection via NGS
 CNVs detected from coverage data in
BAM
 Challenges
• Coverage varies between samples
• Coverage fluctuates between targets
• Systematic biases impact coverage
 Solutions
• Data Normalization
• Reference Sample Comparison
 Requirements
• ≥ 30 ref samples
• From same library prep method
• Ideally ≥100X coverage
14
CNV Detection: Ratio, Zscore, and VAF
 Metrics
• Ratio: sample coverage divided by
reference sample mean
• Z-score: standard deviations from
reference sample mean
• VAF: Variant Allele Frequency
 For Gene Panels and Exomes
• Probabilistic model used to call CNVs
• Segmentation identifies large cytogenetic
events
 For Whole Genome Data
• Targets segmented using Z-scores
• Events called based on Z-score and Ratio
thresholds
15
 Standard exome sequencing is limited to
targeting exons
 This leaves gaps in coverage between genes,
hindering comprehensive CNV detection
 This limitation is addressed by the Twist Exome
2.0 Plus Comprehensive Exome Spike-in capture
panel with added "backbone" probes
 Target common SNPs polymorphic in multiple
populations.
 Are evenly distributed in the intergenic and
intronic regions, with three varying densities:
 25kb
 50kb
 100kb
Twist Exome 2.0 Plus Comprehensive Exome Spike-in Capture Panel
16
 We evaluated the performance of the Twist Exome with CNV
Backbone at various probe densities when used conjunction with
VS-CNV.
 The sensitivity of both the VS-CNV algorithm and a best-practice
filtering workflow in VarSeq was measured.
 CNV calls in VarSeq were compared to a benchmark dataset of 55
confirmed CNVs across 42 samples
 Each sample was sequenced at three different levels of probe
density:
 25kb
 50kb
 100kb
Experimental Design
17
 We evaluated the performance of the VarSeq’s CNV
calling and filtering workflow using the following
benchmark data:
 42 samples in the Copy Number Variation Panel from the
Coriell Institute’s NIGMS Human Genetic Cell Repository
 13 samples from the Coriell Institute that are not known
to harbor large CNVs were included as supplementary
references
 55 confirmed CNVs used to quantify sensitivity
 Events range in size from 100,843 bp to 155,000,000 bp.
Experimental Design: Benchmark Data
18
 Each CNV in the benchmark dataset was categorized as either a True Positive or False
Negative as follows:
 True Positive: More than 75% of targets in the benchmark region have been
assigned the correct state by the CNV Caller.
 False Negative: Fewer than 75% of targets in the benchmark region have been
assigned the correct state by the CNV Caller.
Experimental Design: CNV Caller Sensitivity
19
 Each CNV in the benchmark dataset was categorized as either
a True Positive or False Negative as follows:
 True Positive: The benchmark CNV overlaps a called
CNV in the filtered results with the appropriate CNV
State.
 False Negative: The benchmark CNV does not overlap
any called CNV in the filtered results with a matching
CNV State.
Experimental Design: Filtering Workflow Sensitivity
20
Results: Sensitivity of CNV Caller and Filtering Workflow
 Sensitivity of the VS-CNV algorithm is 100% across all probe densities
 Filtering workflow has no impact for the 100 kb probe density
 The 25 kb and 50 kb probe densities result in reduced filter workflow sensitivity.
 Two benchmark CNVs filtered due to High Controls Variation.
 May indicate that backbone probe regions exhibit higher variation in coverage
between samples.
21
Results: CNV Count Statistics
 On average, there are between 73 and 121 high-quality CNVs per sample.
 This is a drastic reduction compared to the number of unfiltered CNV calls.
 Number of high-quality CNVs still presents a challenge for manual interpretation.
 VarSeq’s CNV annotation capabilities allow for additional filtering based on predicted
classification and effect.
22
Product Demo
NIH Grant Funding Acknowledgments
23
• Research reported in this publication was supported by the National Institute Of General Medical Sciences of the
National Institutes of Health under:
o Award Number R43GM128485-01
o Award Number R43GM128485-02
o Award Number 2R44 GM125432-01
o Award Number 2R44 GM125432-02
o Montana SMIR/STTR Matching Funds Program Grant Agreement Number 19-51-RCSBIR-005
o NIH SBIR Grant 1R43HG013456-01
• PI is Dr. Andreas Scherer, CEO of Golden Helix.
• The content is solely the responsibility of the authors and does not necessarily represent the official views of the
National Institutes of Health.
24
eBooks
25
Scan to download and read
Golden Helix User Meeting
26
Join us for an enlightening and engaging Golden Helix User Meeting at
ACMG 2024, where we dive deep into the latest advancements and updates
from Golden Helix. This is your chance to connect with fellow professionals,
explore cutting-edge genetic analysis tools, and get firsthand insights into
how our solutions are evolving to meet the future of genomic analysis. This
is an opportunity to ask questions on the fly and engage directly with the
Golden Helix team. Please note that there is limited availability for this
event.
Date & Time: March 12th, 8:00 am - 11:30 pm
Location: Toronto Marriott City Centre Hotel, One Blue Jays Way, Toronto,
ON M5V 1J4, Canada
Agenda:
• Presenting VSPGx
• Panels to Whole Genome Analysis with Long-Read Data
• NGS Enterprise Capabilities
• Golden Helix CancerKB Database Updates
Presented by:
Dr. Andreas Scherer,
President & CEO
Darby Kammeraad,
Director of Field
Application Services
Nathan Fortier,
Director of Research
27
Find us in Booth #1313
Come check out our exciting product demos
and meet with our team to discuss your needs
in Booth #1313. Plus, don't miss the chance
to score brand-new t-shirts designed
exclusively for ACMG demo attendees! See you
there!
UNLOCKING GENETIC MYSTERIES: MASTERING EXOME
ANALYSIS WITH VSCLINICAL & VS-CNV
Friday, March 15th, 11:20 am, Theater 2
Presented by: Nathan Fortier, PhD, Golden
Helix Director of Research
Innovation Awards
28
The competition will run from
Dec. 1st, 2023 - Feb. 29th, 2024
So if you answer YES to one or more of the questions below, or have
great examples of your workflows, then the 2024 Golden Helix
Innovation Awards are for you!
• Do you use Golden Helix software?
• Do you use NGS analysis to treat patients?
• Are you studying a particular disease category, or are you zeroing in
on a specific population?
• Have you incorporated the ACMG or AMP guidelines into your clinical
workflow?
• Do you leverage our research platform for plants, animals, or
humans?
• Do you work with CNVs?
29

Analyzing Performance of the Twist Exome with CNV Backbone at Various Probe Densities Leveraging Golden Helix VS-CNV

  • 1.
    Analyzing Performance ofthe Twist Exome with CNV Backbone at Various Probe Densities Leveraging Golden Helix VS-CNV February 21, 2024 Presented by Nathan Fortier, Director of Research
  • 2.
  • 3.
    Analyzing Performance ofthe Twist Exome with CNV Backbone at Various Probe Densities Leveraging Golden Helix VS-CNV February 21, 2024 Presented by Nathan Fortier, Director of Research
  • 4.
    NIH Grant FundingAcknowledgments 4 • Research reported in this publication was supported by the National Institute Of General Medical Sciences of the National Institutes of Health under: o Award Number R43GM128485-01 o Award Number R43GM128485-02 o Award Number 2R44 GM125432-01 o Award Number 2R44 GM125432-02 o Montana SMIR/STTR Matching Funds Program Grant Agreement Number 19-51-RCSBIR-005 o NIH SBIR Grant 1R43HG013456-01 • PI is Dr. Andreas Scherer, CEO of Golden Helix. • The content is solely the responsibility of the authors and does not necessarily represent the official views of the National Institutes of Health.
  • 5.
    ISO Certification 13485:2016 5 •ISO 13485:2016 from TÜV SÜD • ISO 13485:2016 is an international standard that specifies requirements for a quality management system (QMS) for organizations involved in the design, development, production, and servicing of medical devices. o maintain a quality management system o demonstrate sufficient risk management o show consistent tracking of customer satisfaction and safety in the market o demonstrate continued improvement efforts on the product and system level. • ISO 13485:2016 is designed to objectively document that we are holding ourselves to the highest quality standards as we are providing innovative solutions to hospitals, testing labs, and research institutions globally.
  • 6.
    Who Are We? 6 GoldenHelix is a global bioinformatics company founded in 1998 Filtering and Annotation ACMG & AMP Guidelines Clinical Reports CNV Analysis CNV Analysis GWAS | Genomic Prediction Large-N Population Studies RNA-Seq Large-N CNV-Analysis Variant Warehouse Centralized Annotations Hosted Reports Sharing and Integration Pipeline: Run Workflows
  • 7.
    Cited in 1,000sof Peer-Reviewed Publications 7
  • 8.
  • 9.
    The Golden HelixDifference 9 FLEXIBLE DEPLOYMENT On premise or in a private cloud BUSINESS MODEL Annual fee for software, training and support CLIENT CENTRIC Unlimited support from the very beginning SINGLE SOLUTION Comprehensive cancer and germline diagnostics SCALABILITY Gene panels to whole exomes or genomes THROUGHPUT Automated pipeline capabilities QUALITY Clinical reports correct the first time
  • 10.
    Today’s Presenters 10 Rana Smalling,PhD Field Application Scientist Nathan Fortier Director of Research Analyzing Performance of the Twist Exome Kit Leveraging VS-CNV
  • 11.
    11  Critical evidenceneeded for many genetic tests  Common driver specific cancers, causal hereditary variation • EGFR Exon 19 deletion common in lung cancer • PIK3CA Amplification in breast cancer  Large events used heavily in diagnostics • Chromosome 13 deletion common in melanoma • Autism Spectrum Disorder (ASD) • Developmental Delay (DD) • Intellectual Delay (ID) CNVs in Clinical Testing
  • 12.
    12 Power of NGSCNV Detection Small:1 50b+ Medium: 1 – 10Kb Large: 10Kb+ Gene panel Whole exome Whole genome MLPA   CMA   VS-CNV       Detectable events Supported Data types  One single testing paradigm  True simplification of clinical workflow  Saves time and money – all on site
  • 13.
    13 Addressing Issues -CNV Detection via NGS  CNVs detected from coverage data in BAM  Challenges • Coverage varies between samples • Coverage fluctuates between targets • Systematic biases impact coverage  Solutions • Data Normalization • Reference Sample Comparison  Requirements • ≥ 30 ref samples • From same library prep method • Ideally ≥100X coverage
  • 14.
    14 CNV Detection: Ratio,Zscore, and VAF  Metrics • Ratio: sample coverage divided by reference sample mean • Z-score: standard deviations from reference sample mean • VAF: Variant Allele Frequency  For Gene Panels and Exomes • Probabilistic model used to call CNVs • Segmentation identifies large cytogenetic events  For Whole Genome Data • Targets segmented using Z-scores • Events called based on Z-score and Ratio thresholds
  • 15.
    15  Standard exomesequencing is limited to targeting exons  This leaves gaps in coverage between genes, hindering comprehensive CNV detection  This limitation is addressed by the Twist Exome 2.0 Plus Comprehensive Exome Spike-in capture panel with added "backbone" probes  Target common SNPs polymorphic in multiple populations.  Are evenly distributed in the intergenic and intronic regions, with three varying densities:  25kb  50kb  100kb Twist Exome 2.0 Plus Comprehensive Exome Spike-in Capture Panel
  • 16.
    16  We evaluatedthe performance of the Twist Exome with CNV Backbone at various probe densities when used conjunction with VS-CNV.  The sensitivity of both the VS-CNV algorithm and a best-practice filtering workflow in VarSeq was measured.  CNV calls in VarSeq were compared to a benchmark dataset of 55 confirmed CNVs across 42 samples  Each sample was sequenced at three different levels of probe density:  25kb  50kb  100kb Experimental Design
  • 17.
    17  We evaluatedthe performance of the VarSeq’s CNV calling and filtering workflow using the following benchmark data:  42 samples in the Copy Number Variation Panel from the Coriell Institute’s NIGMS Human Genetic Cell Repository  13 samples from the Coriell Institute that are not known to harbor large CNVs were included as supplementary references  55 confirmed CNVs used to quantify sensitivity  Events range in size from 100,843 bp to 155,000,000 bp. Experimental Design: Benchmark Data
  • 18.
    18  Each CNVin the benchmark dataset was categorized as either a True Positive or False Negative as follows:  True Positive: More than 75% of targets in the benchmark region have been assigned the correct state by the CNV Caller.  False Negative: Fewer than 75% of targets in the benchmark region have been assigned the correct state by the CNV Caller. Experimental Design: CNV Caller Sensitivity
  • 19.
    19  Each CNVin the benchmark dataset was categorized as either a True Positive or False Negative as follows:  True Positive: The benchmark CNV overlaps a called CNV in the filtered results with the appropriate CNV State.  False Negative: The benchmark CNV does not overlap any called CNV in the filtered results with a matching CNV State. Experimental Design: Filtering Workflow Sensitivity
  • 20.
    20 Results: Sensitivity ofCNV Caller and Filtering Workflow  Sensitivity of the VS-CNV algorithm is 100% across all probe densities  Filtering workflow has no impact for the 100 kb probe density  The 25 kb and 50 kb probe densities result in reduced filter workflow sensitivity.  Two benchmark CNVs filtered due to High Controls Variation.  May indicate that backbone probe regions exhibit higher variation in coverage between samples.
  • 21.
    21 Results: CNV CountStatistics  On average, there are between 73 and 121 high-quality CNVs per sample.  This is a drastic reduction compared to the number of unfiltered CNV calls.  Number of high-quality CNVs still presents a challenge for manual interpretation.  VarSeq’s CNV annotation capabilities allow for additional filtering based on predicted classification and effect.
  • 22.
  • 23.
    NIH Grant FundingAcknowledgments 23 • Research reported in this publication was supported by the National Institute Of General Medical Sciences of the National Institutes of Health under: o Award Number R43GM128485-01 o Award Number R43GM128485-02 o Award Number 2R44 GM125432-01 o Award Number 2R44 GM125432-02 o Montana SMIR/STTR Matching Funds Program Grant Agreement Number 19-51-RCSBIR-005 o NIH SBIR Grant 1R43HG013456-01 • PI is Dr. Andreas Scherer, CEO of Golden Helix. • The content is solely the responsibility of the authors and does not necessarily represent the official views of the National Institutes of Health.
  • 24.
  • 25.
  • 26.
    Golden Helix UserMeeting 26 Join us for an enlightening and engaging Golden Helix User Meeting at ACMG 2024, where we dive deep into the latest advancements and updates from Golden Helix. This is your chance to connect with fellow professionals, explore cutting-edge genetic analysis tools, and get firsthand insights into how our solutions are evolving to meet the future of genomic analysis. This is an opportunity to ask questions on the fly and engage directly with the Golden Helix team. Please note that there is limited availability for this event. Date & Time: March 12th, 8:00 am - 11:30 pm Location: Toronto Marriott City Centre Hotel, One Blue Jays Way, Toronto, ON M5V 1J4, Canada Agenda: • Presenting VSPGx • Panels to Whole Genome Analysis with Long-Read Data • NGS Enterprise Capabilities • Golden Helix CancerKB Database Updates Presented by: Dr. Andreas Scherer, President & CEO Darby Kammeraad, Director of Field Application Services Nathan Fortier, Director of Research
  • 27.
    27 Find us inBooth #1313 Come check out our exciting product demos and meet with our team to discuss your needs in Booth #1313. Plus, don't miss the chance to score brand-new t-shirts designed exclusively for ACMG demo attendees! See you there! UNLOCKING GENETIC MYSTERIES: MASTERING EXOME ANALYSIS WITH VSCLINICAL & VS-CNV Friday, March 15th, 11:20 am, Theater 2 Presented by: Nathan Fortier, PhD, Golden Helix Director of Research
  • 28.
    Innovation Awards 28 The competitionwill run from Dec. 1st, 2023 - Feb. 29th, 2024 So if you answer YES to one or more of the questions below, or have great examples of your workflows, then the 2024 Golden Helix Innovation Awards are for you! • Do you use Golden Helix software? • Do you use NGS analysis to treat patients? • Are you studying a particular disease category, or are you zeroing in on a specific population? • Have you incorporated the ACMG or AMP guidelines into your clinical workflow? • Do you leverage our research platform for plants, animals, or humans? • Do you work with CNVs?
  • 29.

Editor's Notes

  • #2 Thanks Casey! We can’t wait to dive in to this subject
  • #4 Thanks Casey! We can’t wait to dive in to this subject
  • #5 Before we start diving into the subject, I wanted mention our appreciation for our grant funding from NIH. The research reported in this publication was supported by the National institute of general medical sciences of the national institutes of health under the listed awards. We are also grateful to have received local grant funding from the state of Montana. Our PI is Dr. Andreas Scherer who is also the CEO at Golden Helix and the content described today is the responsibility of the authors and does not officially represent the views of the NIH. So with that covered, lets take just a few minutes to talk a little bit about our company Golden Helix.
  • #6 Golden Helix is proud to announce that we have received the certification for ISO 13485:2016 from TUV SUD.
  • #7 Golden Helix is  a global bioinformatics software and analytics company that enables research and clinical practices to analyze large genomic datasets. We were originally founded in 1998 based off pharmacogenomics work performed at GlaxoSmithKline, who is still a primary investor in our company.  VarSeq, our flagship product, serves as a clinical tertiary analysis tool. At its core, it serves as a variant annotation and filtration engine. Additionally, users have access to automated AMP or ACMG variant guidelines. VarSeq also has the capability to detect copy number variations scaling from single exome to large aneuploidy events. Lastly, the finalization of variant interpretation and classification is further optimized with VarSeq’s clinical reporting capability. Users can integrate all of these features into a standardized workflow. Paired with VarSeq are VSWarehouse and VSPipeline. VSWarehouse serves as a repository for the large amount of useful genomic data wrangled by our customers. Warehouse not only solves the issue of data storage for ever-increasing genomic content, but also is fully queryable and auditable and allows for the definability of user access for project managers or collaborators. In tandem with this, VSPipeline, allows for the ​automated execution of routine workflows, further optimizing users' abilities to handle large amounts of data. Lastly, our research platform, SVS, enables researchers to perform complex analysis and visualizations on genomic and phenotypic data. SVS has a range of tools to perform GWAS, genomic prediction, and RNA-Seq analysis, among other common research applications.
  • #8 Our software has been very well received by the industry. We have been cited in thousands of peer-reviewed publications, and that’s a testament to our customer base.
  • #9 We work with over 400 organizations all over the globe. This includes top-tier institutions, like Stanford and yale, government organizations like the NCI and NIH,  clinics such as Sick Kids, and many other genetic testing labs.  We now have well over 20,000 installs of our products and with 1,000’s of unique users. 
  • #10 At Golden Helix, we focus on the seven pillars of customer success. Golden Helix offers a single software solution that encompasses germline, somatic, and CNV analysis. Our software is also highly scalable, supporting gene panel to whole genome sequencing workflows. With our automation capabilities, we now offer a complete FASTQ or VCF to report pipeline. Our software can be locally deployed, or installed in the cloud, and our business model of annual subscription per user means you are able to increase your workload without increasing analysis fees. And it goes without saying, that our FAS team is here to support you on every step of your analysis journey. 
  • #11 Thank you to everyone who is in attendance today. My name is Nathan Fortier, I’m the director of research here at Golden Helix and I work with the development team that has helped develop the capabilities we are highlighting today.
  • #12 Today we will be talking about our VSCNV algorithm which allows users to call CNV events from NGS gene panel, whole exome, and whole genome data. Accurately detecting CNV’s can provide necessary clinical evidence for any given genetic test. As many of you know CNV’s can be drivers in many specific cancers and act as casual agents in hereditary variation. For example, the deletion of exon 19 in EGFR is very common in- non-small cell lung cancer. while duplications of PIK3CA are often associated with breast cancer Today what we will be looking at VS-CNV in the context of the Twist Exome 2.0 Plus Comprehensive Exome Spike-in capture panel with added "backbone" probes. Specifically, we will examine the combined efficacy of the backbone-probe enhanced exome capture panel and VS-CNV in identifying confirmed CNVs in a set of samples from the Coriell Institute.
  • #13 To best explain the value of VS-CNV’s detection capabilities, we can compare against traditional best-practice methods. One traditional methods is MLPA which is ideally tailored for detecting smaller CNVs across a small number of pre-defined genes. In addition to being expensive, one additional disadvantage of MLPA is the inability to detect larger events, which chromosomal microarrays can handle. The large aneuploidy level of CMA event detection is typically from 10 kb or larger. When used in conjunction with Whole Exome Sequencing data VS-CNV accurately detects not only the 10kb and larger events but can detect events down to a single gene and even exon. VarSeq breaks down the barriers of the limitations across CMA and MLPA methods and gives the user the full-scale capability to analyze both small variants and CNVs in a single software suite while saving you a fortune on assays. Another value here is that the CNV detection is performed by you, eliminating the need to outsource this process which only adds time and inefficiency in both producing and understanding the results. Each of these approaches have their nuances, and NGS is no exception, lets discuss some of the associated challenges and how they can be addressed.
  • #14 NGS based detection of CNVs starts with the coverage data in the BAM file. This is not a straightforward task and our development team has worked extremely hard to develop an algorithm that addresses the associated challenges with coverage data. One challenge is that coverage can vary wildly both between samples and between targets, with the vast majority of these fluctuations being unrelated to any CNV events but rather the product of systematic biases in the data. To account for this bias and variability, we perform within-sample normalization of the coverage data across all targets. The normalized coverage for each target is then compared a pool of reference samples to compute metrics that can be used for CNV detection. It’s important to keep in mind that the reference set does not need to be solely control samples with no CNV events. The benefit of having multiple reference samples and averaging the normalized coverage is that this prevents any event in a single reference sample from skewing the reference based normal region overall. For this approach to work effectively, there are some requirements which include having an adequate number of references, no less than 30, and making sure they come from the same platform and prep methods though not necessarily the same run and also having adequate coverage ideally 100x or greater. This image is a great example of the need for reference samples. When looking at the 3 samples on the right and each of their coverage data across BRCA2, we may guess that sample 11 possibly has a heterozygous deletion since the coverage is nearly half as much as samples 12 and 13. Unfortunately it isn’t this simple and detecting any CNV is essentially impossible to tell from the naked eye since a single samples coverage doesn't provide enough information alone to detect these events. This is apparent in the next slide when after running these samples through VarSeq, where no deletion is detected in sample 11, we do find a duplication in sample 13.
  • #15 Here is another snapshot of the detected duplication in sample 13 spanning 4 exons in BRCA2. While this event was completely undetectable from the coverage data alone, the presence of the event becomes clear when we look at the derived metrics computed from the normalized coverage data. Ratio: which is simply the samples normalized coverage divided by the reference set normalized coverage at a given target. A ratio ~1 means the region can be interpreted as having equal normalized coverage between your sample and reference set, whereas a ratio of 0.5 is indicative of heterozygous deletion and a ratio of 1.5 indicates a possible duplication. The other critical metric is Z-score, which measure how many standard deviations away the sample of interest is from the controls in terms of normalized coverage. In addition to these coverage-based metrics, the algorithm also incorporates Variant Allele Frequency. While this is a secondary metric, it does allow us to reduce our rate of false positives and exclude problematic regions from the algorithm. Now the computational process used by the algorithm depends on the size of the events. If you are performing CNV analysis on gene panels or exomes, these metrics are fed into a probabilistic model used to call CNVs. This model is combined with a segmentation approach for the detection of large cytogenetic events.
  • #16 Now let’s discuss some of the problems with calling CNVs from traditional exome sequencing data. Unfortunately, standard commercial exome kits are limited to targeting exon coding regions, leaving significant gaps in coverage between genes which could hinder comprehensive CNV detection. To address this need for comprehensive coverage, Twist Bioscience has developed an enhanced Twist Exome 2.0 Plus Comprehensive Exome Spike-in capture panel with added "backbone" probes. These probes target common SNPs polymorphic in multiple populations and are evenly distributed in the intergenic and intronic regions, with three varying densities at 25kb, 50kb, and 100kb intervals. This backone enables the genome-wide detection of CNVs and loss of heterozygosity (LOH), on top of single nucleotide variations (SNVs) and small insertions and deletions (InDels) that come with Twist Exome 2.0 product offering.
  • #17 We evaluated the performance of VarSeq’s CNV calling and quality filtering capabilities in conjunction with the backbone-probe enhanced exome capture technology developed by Twist Bioscience. Our experiments quantify the sensitivity of both the VS-CNV algorithm and a best-practice tertiary filtering workflow in VarSeq which leverages a combination of quality metrics using VarSeq’s filtering tools to eliminate low-quality CNV calls. CNV calls in VarSeq were compared to a benchmark dataset of 55 confirmed CNVs across 42 samples from the Coriell Institute’s Copy Number Variation Panel. These benchmark samples were sequenced using the Twist Exome 2.0 Plus Comprehensive Exome Spike-in and Twist CNV Backbone Panel. Each sample was sequenced at three different levels of probe density to assess how changes in probe density affect the performance of the CNV analysis workflow.
  • #18 To evaluate the performance of the VarSeq CNV calling and filtering workflow, we have called CNVs from NGS data for 42 of the samples in the Copy Number Variation Panel from the Coriell Institute’s NIGMS Human Genetic Cell Repository [6]. Each sample in the panel harbors at least one clinically significant chromosomal aberration. The Coriell Institute also provides a dataset of confirmed CNV events associated with these samples. While this dataset does not provide a comprehensive list of all detectable CNVs that may be present in each sample, all events in this dataset have been confirmed through G-banded karyotyping analysis and, in many cases, fluorescence in situ hybridization. This benchmark dataset is the basis for establishing the sensitivity of the VarSeq CNV calling and filtering workflow. These events range in size from 100,843 bp to 155,000,000 bp. An additional 13 samples from the Coriell Institute that are not known to harbor any large CNVs were also included as supplementary reference samples. All 55 samples were included in the refence set for CNV calling. Because there is little overlap between the location of the various CNVs across the CNV panel samples, the inclusion of the 42 non-normal benchmark samples as refences is unlikely to skew the results.
  • #19 Due to the granular nature of CNV calling on NGS coverage data, large cytogenetic events may be called as several distinct smaller events overlapping the region. Additionally, the targets used to call the CNV may not perfectly overlap with the region defined in the Coriell Institute’s benchmark dataset. Based on these considerations, each analyzed CNV in the benchmark dataset was be categorized as a True Positive if more than 75% of targets in the benchmark region were assigned the correct state by the CNV Caller, otherwise the CNV is classified as a false negative.
  • #20 It must be noted that CNV detection is only the first step of the CNV analysis workflow. Performing CNV calling on a single whole exome or whole genome sample will typically result in hundreds of CNV calls, making the task of manually interpreting each event virtually impossible. Thus, a robust filtering strategy is essential to eliminate false positives while preserving high-quality events. To assist in this process, VS-CNV provides several QC fields that can be used in conjunction with VarSeq’s filtering capabilities to eliminate low-quality CNV calls. We have evaluated the sensitivity of a best-practice filtering workflow in VarSeq that leverages this metrics. To evaluate the sensitivity of the filtering workflow, each CNV in the benchmark dataset was categorized as a true positive if it overlapped a called CNV in the filtered results with the appropriate CNV State.
  • #21 The sensitivity of the VS-CNV algorithm is 100% across all probe densities, with all events in the benchmark dataset being called over at least 75% of overlapping targets. The filtering workflow does not have any impact on sensitivity for the 100 kb probe density, with no true positive events being filtered out at this probe density. However, the 25 kb and 50 kb probe densities do result in a slightly reduced sensitivity for the filtering workflow, with two benchmark CNVs filtered out due to being flagged has having High Controls Variation. This flag indicates a high degree of variation between the reference samples for the region of interest. When examined, the normalized coverage of the targets in these regions appears to have much more variation across samples for the higher probe densities, which results in these CNVs being flagged. This may be an indication that the backbone probe regions exhibit higher variation in coverage between samples resulting in increased coverage variably at higher probe densities. Based on these results, a conclusion can be made on the question of probe density. For the samples in this experiment, the probe density does not impact the sensitivity of the VS-CNV algorithm. However, the higher probe densities of 25 kb and 50kb do result in reduced sensitivity for the quality filtering workflow due to increased variation in normalized coverage between reference samples.
  • #22 In addition to sensitivity, we also evaluated the total number of called and high-quality CNVs falling into two different size categories: < 10kb and > 10kb. Notice that both the total number of CNVs called by the algorithm and the number of high-quality filtered CNVs increase as the distance between the probes decreases. The majority of the called events across all probe densities are below the 10 kb size threshold, but most of these events are low-quality. This is unsurprising as events spanning more than 10 kb generally span large numbers of targets resulting in more reliable calls. On average, there are between 73 and 121 high-quality filtered CNVs per sample. While this is a drastic reduction compared to the hundreds of unfiltered CNV calls per sample, this large number of high-quality filtered CNVs still presents a challenge for manual interpretation. Fortunately, VarSeq provides possible solutions to this problem in the form of automated effect prediction and classification for CNVs based on the ACMG Guidelines.
  • #24 Before wrapping up, we'd like to again state our appreciation for the grants included here. And with that, I'll hand things back to Casey to talk about some exciting marketing updates and take us through a Q&A session.
  • #29 Before wrapping up, we'd like to again state our appreciation for the grants included here. And with that, I'll hand things back to Casey to talk about some exciting marketing updates and take us through a Q&A session.
  • #30 Questions: Are we limited to TSO500 data for somatic analysis or can we build our own panel and include any number of customer genomic signatures? Answer: No limitations at all. User can build any somatic panel or workflow overall and include any specific sample level data either in the variant tables or from the sample manifest. TSO data is just one example among any physical or virtual panel your lab would run 2. Can the CNV calling in the whole exome example be automated with pipeline too? A: Yes! When you build the original workflow template, you can include CNV calling, or importing externally called CNVs and SVs. These will also go through the annotation process. 3. How to save time and effort in variant interpretation if you or a teammate need to sequence the whole genome for a sample already analyzed in VarSeq as a gene panel?A: You can save already assessed variant interpretations to assessment catalogs and reuse to avoid rework.