Download to read offline

![Assessment Of Water Quality In Imo River Estuary Using Multivariate Statistical Method
www.iosrjournals.org 37 | Page
IV. Conclusion
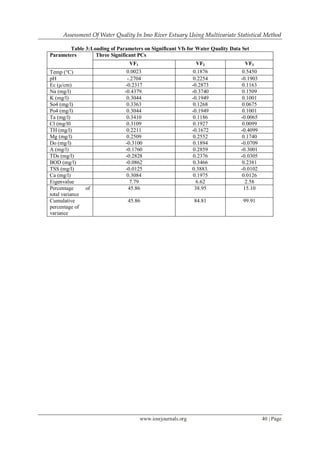
Water quality data collected from three monitoring stations located around Imo River estuary, Niger
Delta Area has been examined by display methods, that is principal component analysis and factor analysis to
yield correlations between variables and water quality similarity in the estuary. The PCA/FA assisted to extract
and recognize the factors responsible for water quality variations. PCA/FA established two latent factors that
explained 99.91% of total variance, namely: nutrient –pollution source and organic pollution source. This
explains that nutrient sources and organic pollutions source are the most important factors that contribute to
affect the water quality of Imo River Estuary. Therefore, this work underscore the important of multivariate
statistical methods for the analysis and explanation of complex array of data, water quality monitoring and
determination of pollution sources to the water bodies.
References
[1]. Akpan, I. I. (2012). Physico-chemical and Biological Studies of Imo River Estuary, Nigeria, Ph.D Thesis, Department of Fishery,
Michael Okpara University of Agriculture, umudike, 184.
[2]. Heikka, R. A. (2005). Multivariate Monitoring of Water Quality: A Case Study of Lake Simple, Finland. J. Chmonet, 22, 747-751.
[3]. Palma, P., Albarenga, P., Palma, V. L., Fernandes, R. M., Soares, A. M. V. M., Barbosa, I. R. (2010). Assessment of Anthropogenic
Sources of Water Pollution Using Multivariate Statistical Techniques. A Case Study of Alqueva’s Reservoir, Portugal, Environ.
Monit. Assess 165, 539-552.
[4]. Helena B., Pardo, B., Vega, M., Barrado, E., Fernandez, J. M., Fernandez, L. (2000). Temporal Evolution of Groundwater
Composition in an Alluvial Aquifer (Pisuerga River, Spain) by Principal Component Analysis. Water Res. 34, 807-816.
[5]. Brumelis, G., Lapina, L., Nikodemus, O., Tabors, G. (2000). Use of an Artificial Model of Monitoring Data to Aid Interpretation of
Principal Component Analysis. Environ. Modell. Softw. 2000, 15, 755-763.
[6]. Singh, K. P., Malik, A., Mohan, D., Sinha, S. (2004). Multivariate Statistical Techniques for the Evaluation of Spatial and Temporal
Variations in Water Quality of Gomti River (India): A Case Study: Water Res. 38, 3980 – 3992.
[7]. Abdul-Wahab, S. A., Bakheit, C. S., Al-Alawi, S. M. (2005). Principal Component and Multiple Regression Analysis in Modelling of
Ground-level Ozone and Factors Affecting its Concentration. Environ. Modell. Softw. 20, 1263-1271.](https://image.slidesharecdn.com/h0453540-150425003428-conversion-gate02/85/Assessment-of-Water-Quality-in-Imo-River-Estuary-Using-Multivariate-Statistical-Method-3-320.jpg)

The study assesses water quality in the Imo River estuary over a 12-month period using multivariate statistical methods, specifically principal component analysis and factor analysis, to identify the main factors affecting water quality. Results indicate that nutrient sources and organic pollution are the primary contributors to water quality variations, explaining 99.91% of the total variance. This research emphasizes the importance of multivariate techniques in monitoring and managing water quality in affected ecosystems.


![11.[40 49]an application of multivariate techniques in plankton study of a fr...](https://cdn.slidesharecdn.com/ss_thumbnails/11-40-49anapplicationofmultivariatetechniquesinplanktonstudyofafreshwaterbodyinthenigerdelta-120512235818-phpapp01-thumbnail.jpg?width=640&height=640&fit=bounds)


![Polymer [ बहुलक ] Chemistry Notes PDF - Irfanullah Mehar - JJ Sir Chemistry.pdf](https://cdn.slidesharecdn.com/ss_thumbnails/polymerchemistrynotespdf-irfanullahmehar-jjsirchemistry-260210172118-3f9b37f7-thumbnail.jpg?width=640&height=640&fit=bounds)


