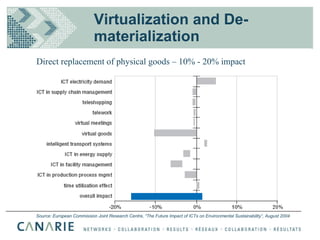
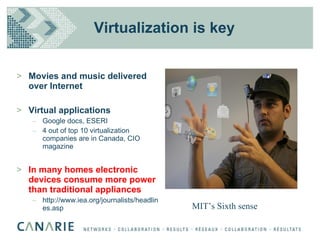
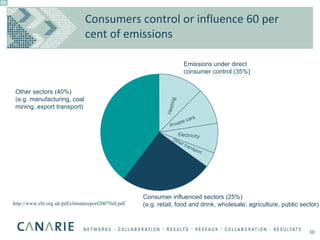
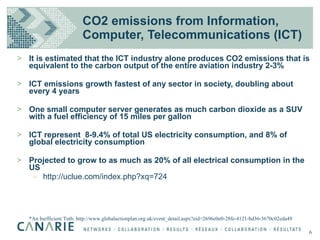
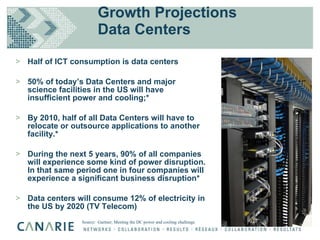
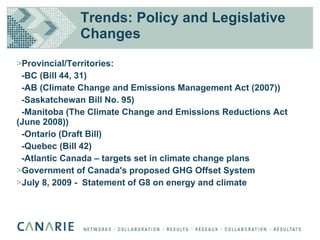
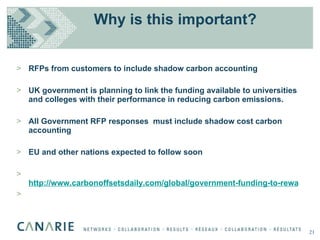
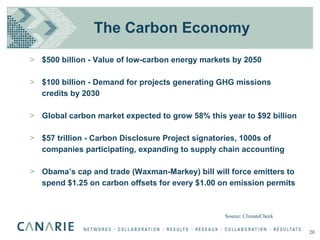
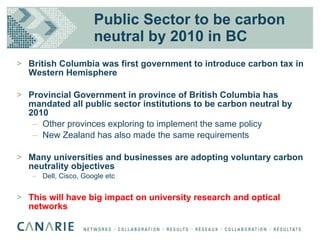
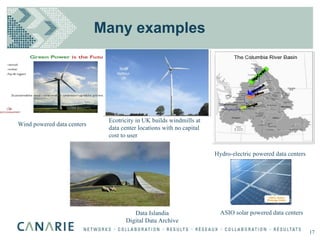
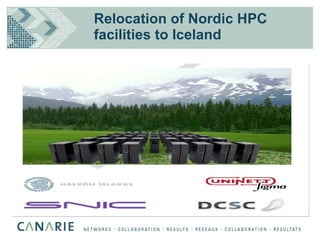
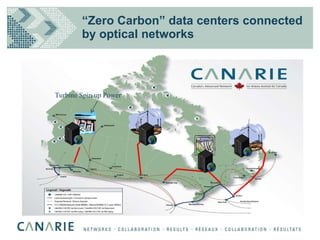
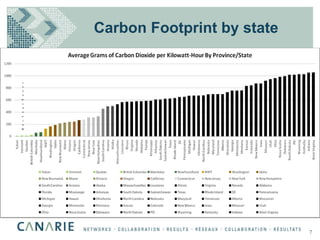
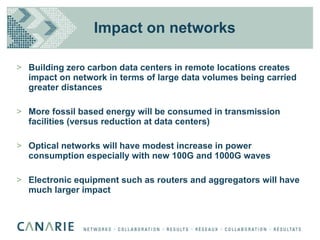
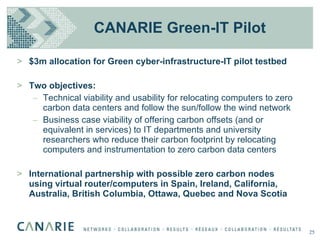
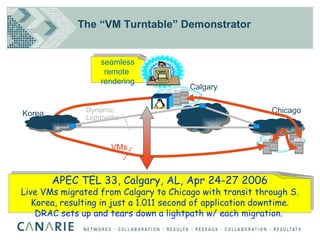
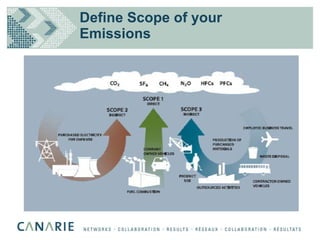
The document discusses how information and communication technologies (ICT) both contribute to climate change through their own emissions but also have potential to help reduce emissions in other sectors. While ICT emissions are growing rapidly, ICT also has the potential to deliver much larger carbon reductions through applications that improve energy efficiency and reduce transportation emissions. The document argues that relocating ICT infrastructure like data centers to renewable energy sites connected by optical networks could allow "zero carbon" computing that is independent from the electrical grid.
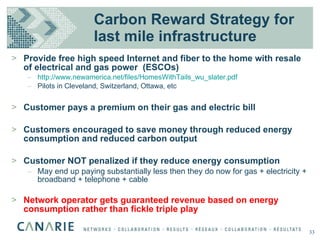
![ICT and Climate Change Benefits to Canada Bill St. Arnaud CANARIE Inc – www.canarie.ca [email_address] Unless otherwise noted all material in this slide deck may be reproduced, modified or distributed without prior permission of the author](https://image.slidesharecdn.com/canariegreenitpresentation-12519101345009-phpapp03/85/Canarie-Green-It-Presentation-1-320.jpg)
![ICT and Climate Change Benefits to Canada Bill St. Arnaud CANARIE Inc – www.canarie.ca [email_address] Unless otherwise noted all material in this slide deck may be reproduced, modified or distributed without prior permission of the author](https://image.slidesharecdn.com/canariegreenitpresentation-12519101345009-phpapp03/75/Canarie-Green-It-Presentation-1-2048.jpg)
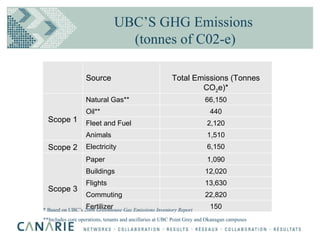
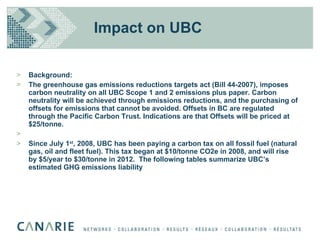
![Impact on UBC 2007 GHG Inventory Summary Table (Tonnes CO2-e) [1] UBC Vancouver Campus [2] UBC Okanagan Campus [3] Natural Gas 54 595 2 283 Oil 0 0 Electricity 3 865 254 Fleet 2 096 23 Paper 994 Cost of GHG emissions for UBC 2010 – 2012 (/tonne CO2-e) 2010 2011 2012 Carbon Offset $25 $25 $25 Carbon Tax $20 $25 $30 Total $45 $50 $55 UBC’s GHG Emissions Liability 2010-2012 [4] 2010 2011 2012 Carbon Offset [5] $ 1 602 750 $ 1 602 750 $ 1 602 750 Carbon Tax [6] $ 1 179 940 $ 1 474 925 $ 1 769 910 Total: $ 2 782 690 $ 3 077 675 $ 3 372 660](https://image.slidesharecdn.com/canariegreenitpresentation-12519101345009-phpapp03/85/Canarie-Green-It-Presentation-36-320.jpg)