Downloaded 89 times

Graphic and visual aids are used to summarize information for readers. They include graphs, diagrams, charts, tables and other pictorial forms that consolidate and clarify written material. Visual aids allow complex ideas to be explained concretely and abstract concepts to be visualized. They can also present new information alongside text. Effective interpretation of visual aids involves understanding what is being measured, looking for trends or patterns, and drawing important conclusions. Common types are line graphs, bar graphs, pie charts, organizational charts, flowcharts, diagrams and tables.
Introduction to graphic and visual aids emphasizing their role in presenting information effectively.
Introduction to graphic and visual aids emphasizing their role in presenting information effectively.
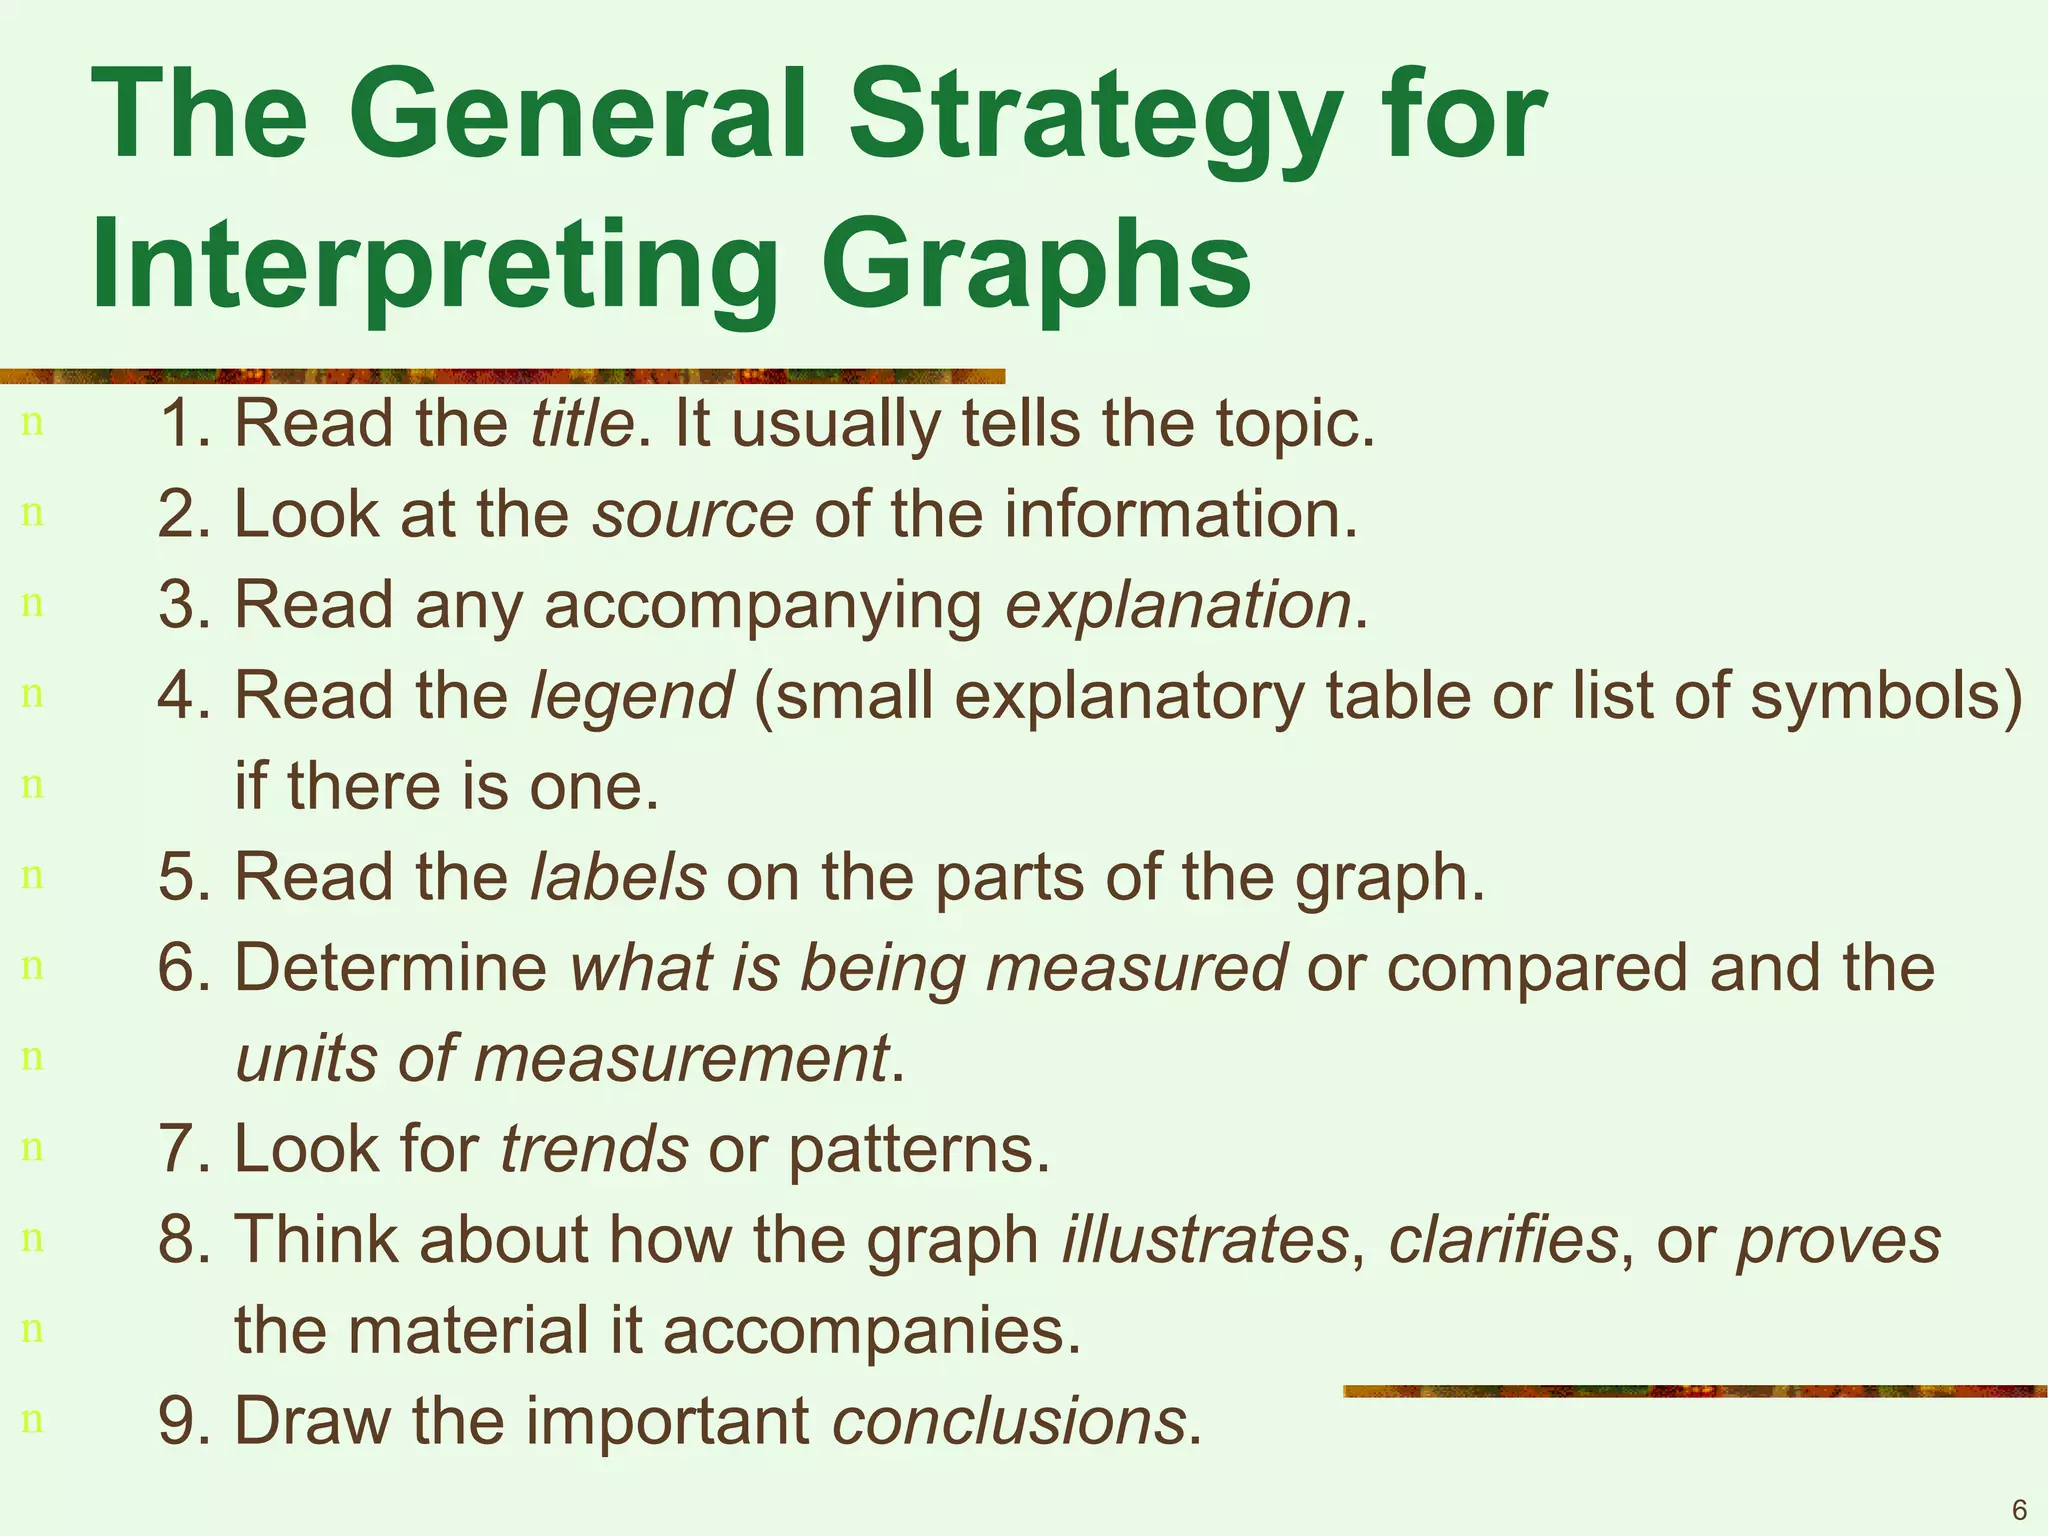
Steps for interpreting graphs, including understanding titles, sources, and trends.
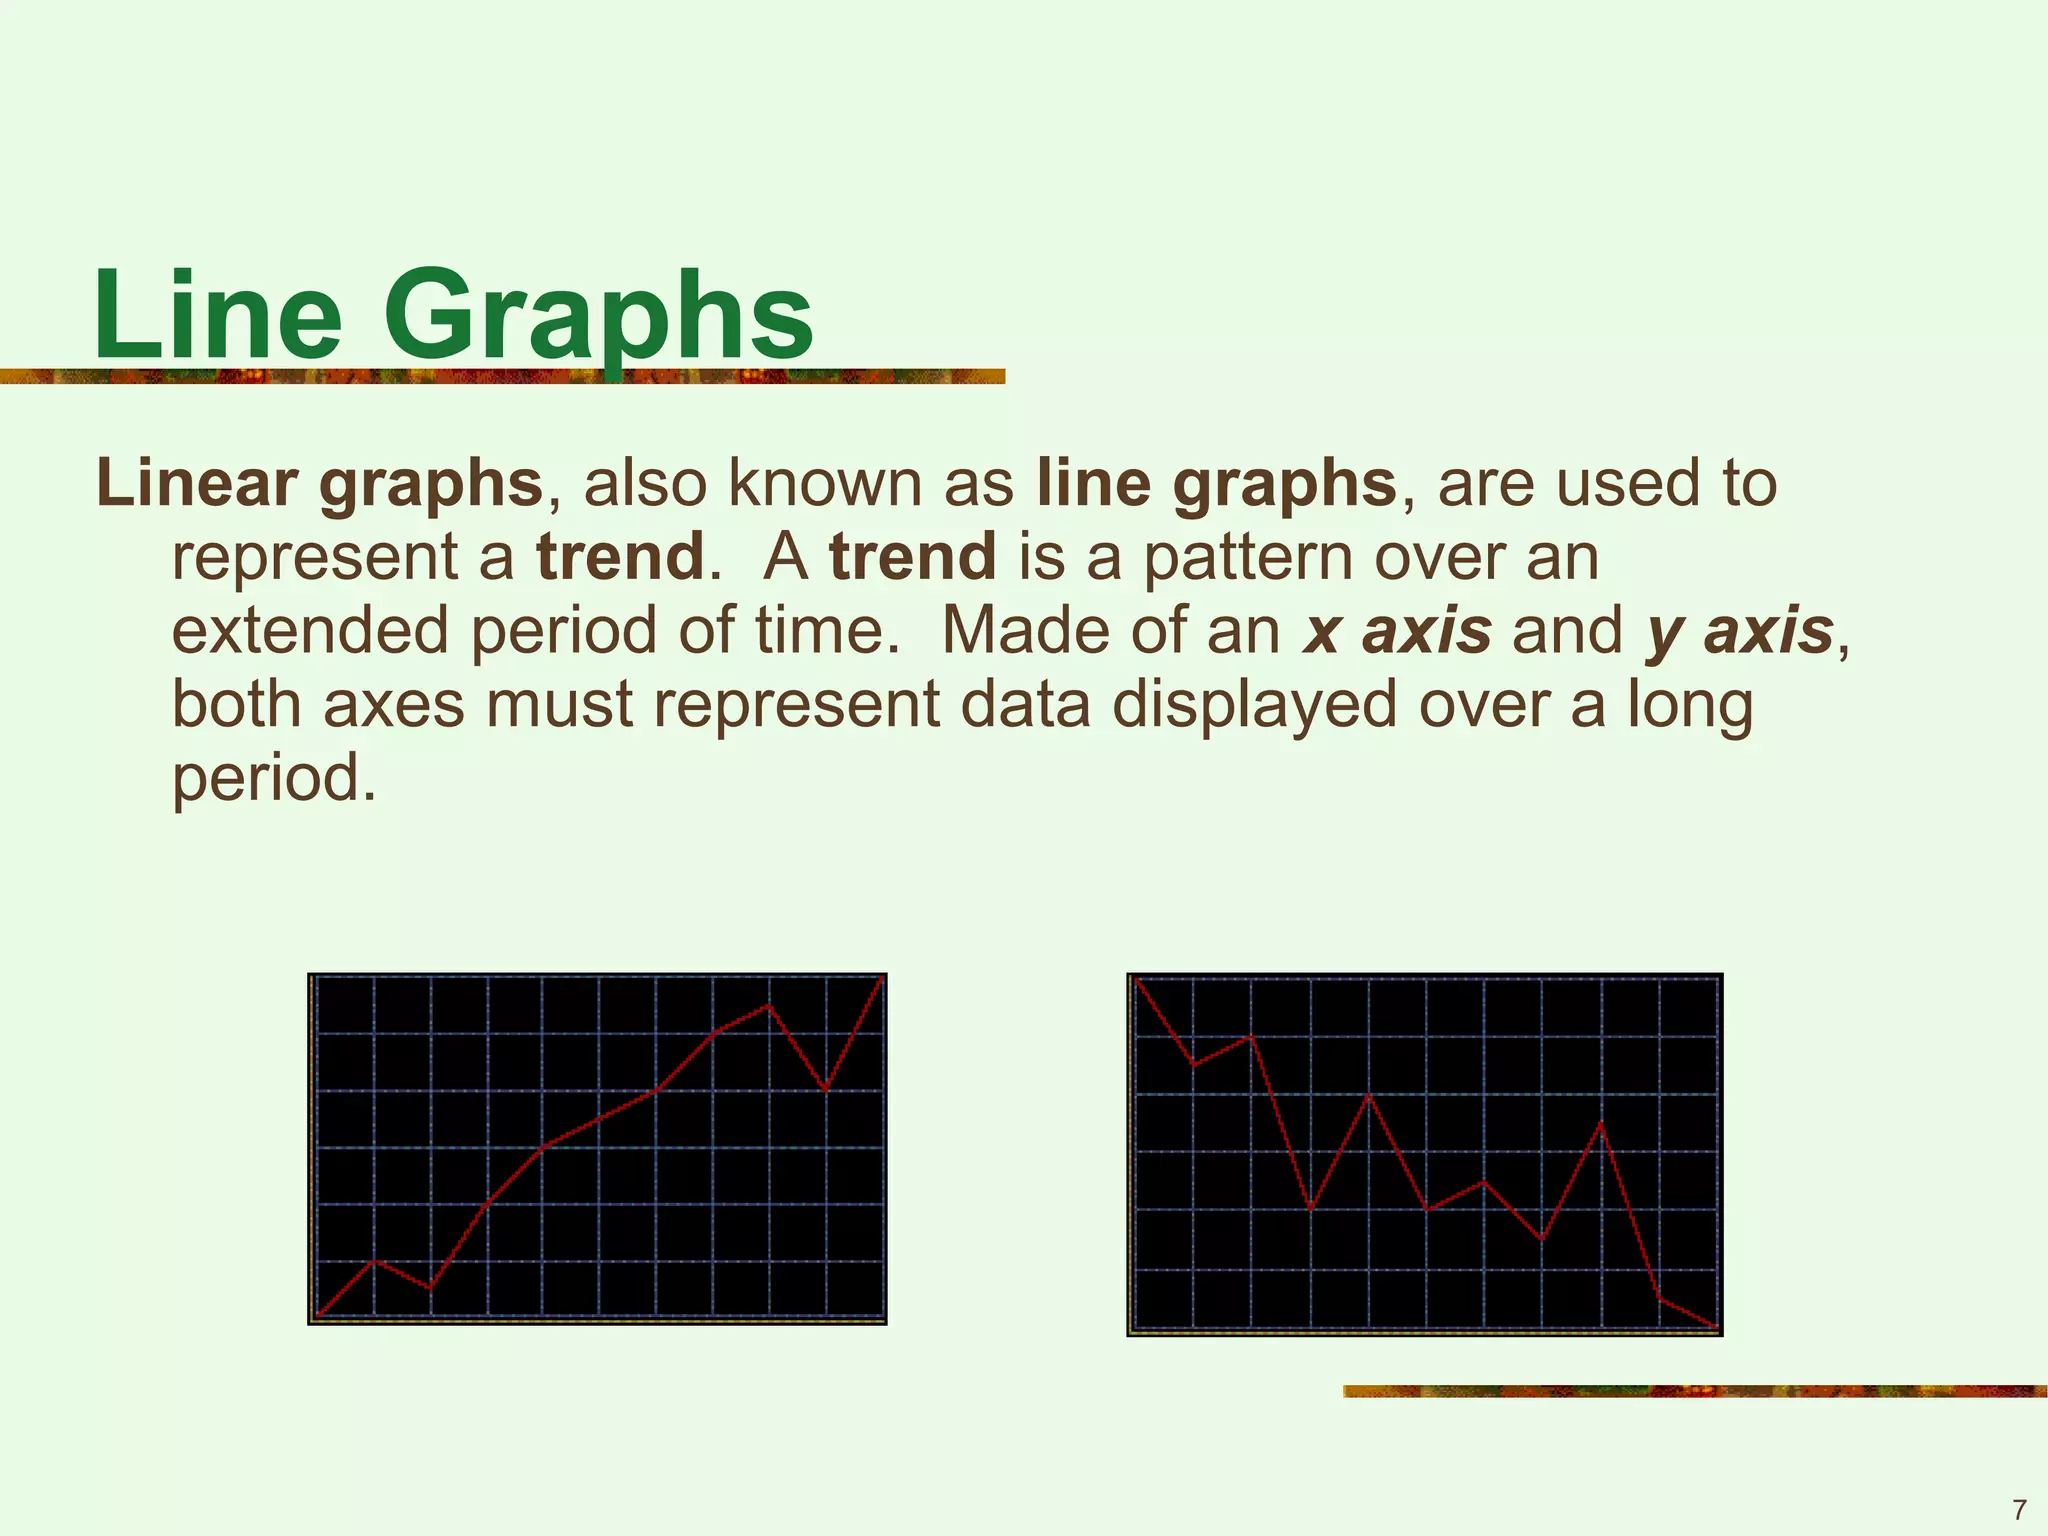
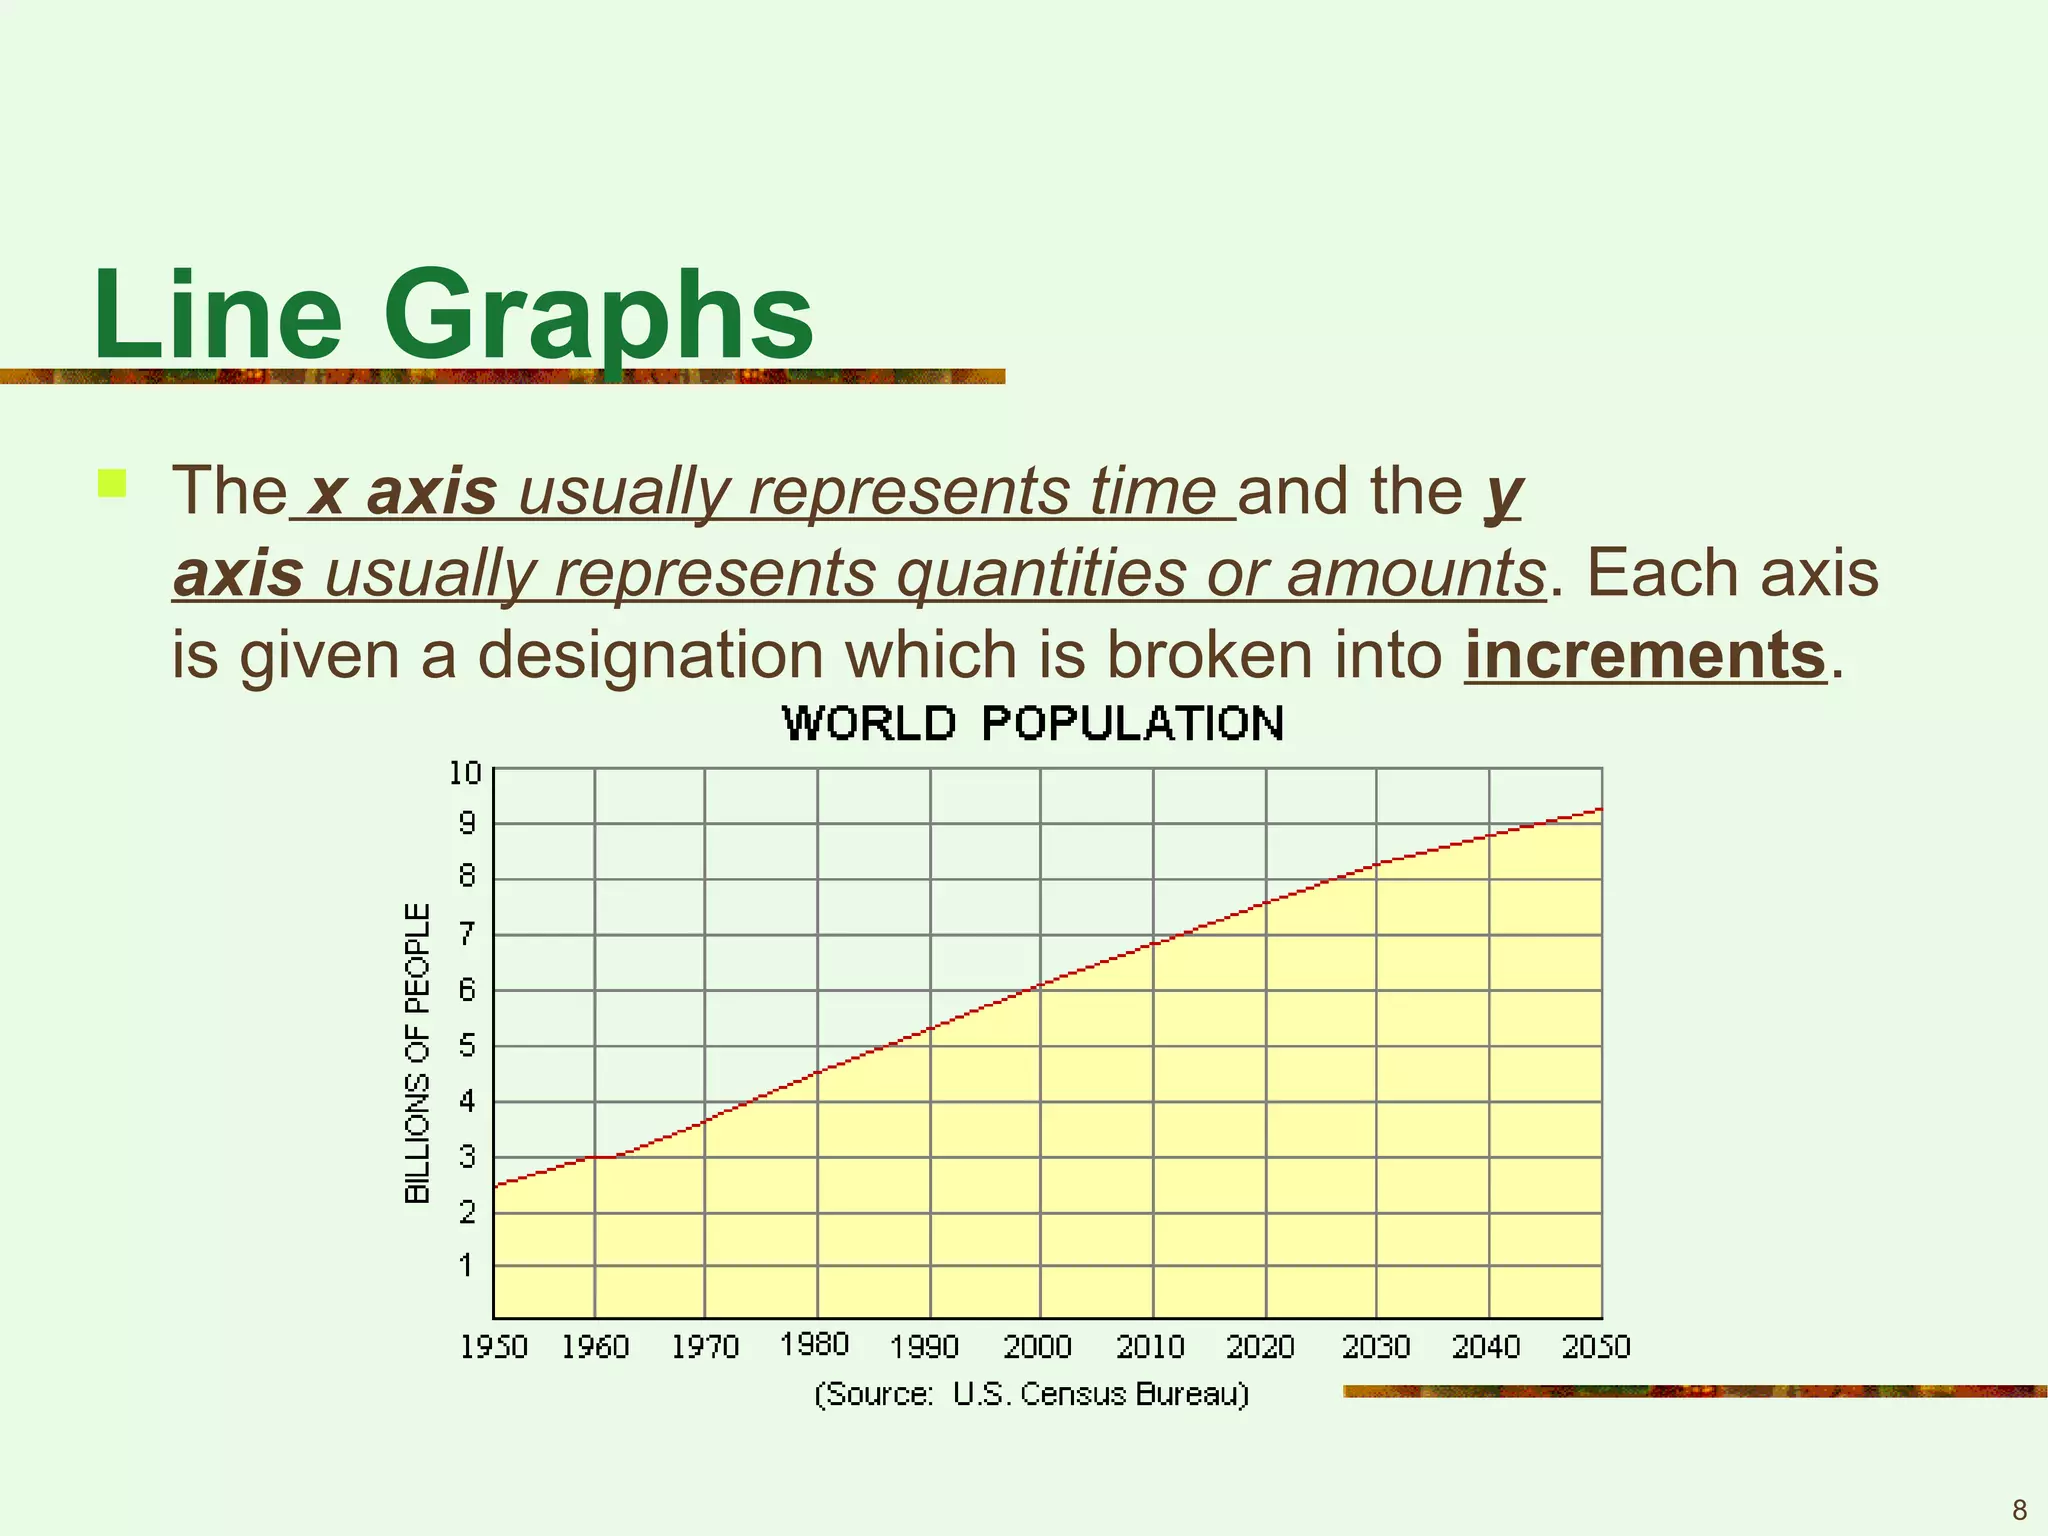
Description of line graphs for showing trends over time, with axes representing time and quantities.
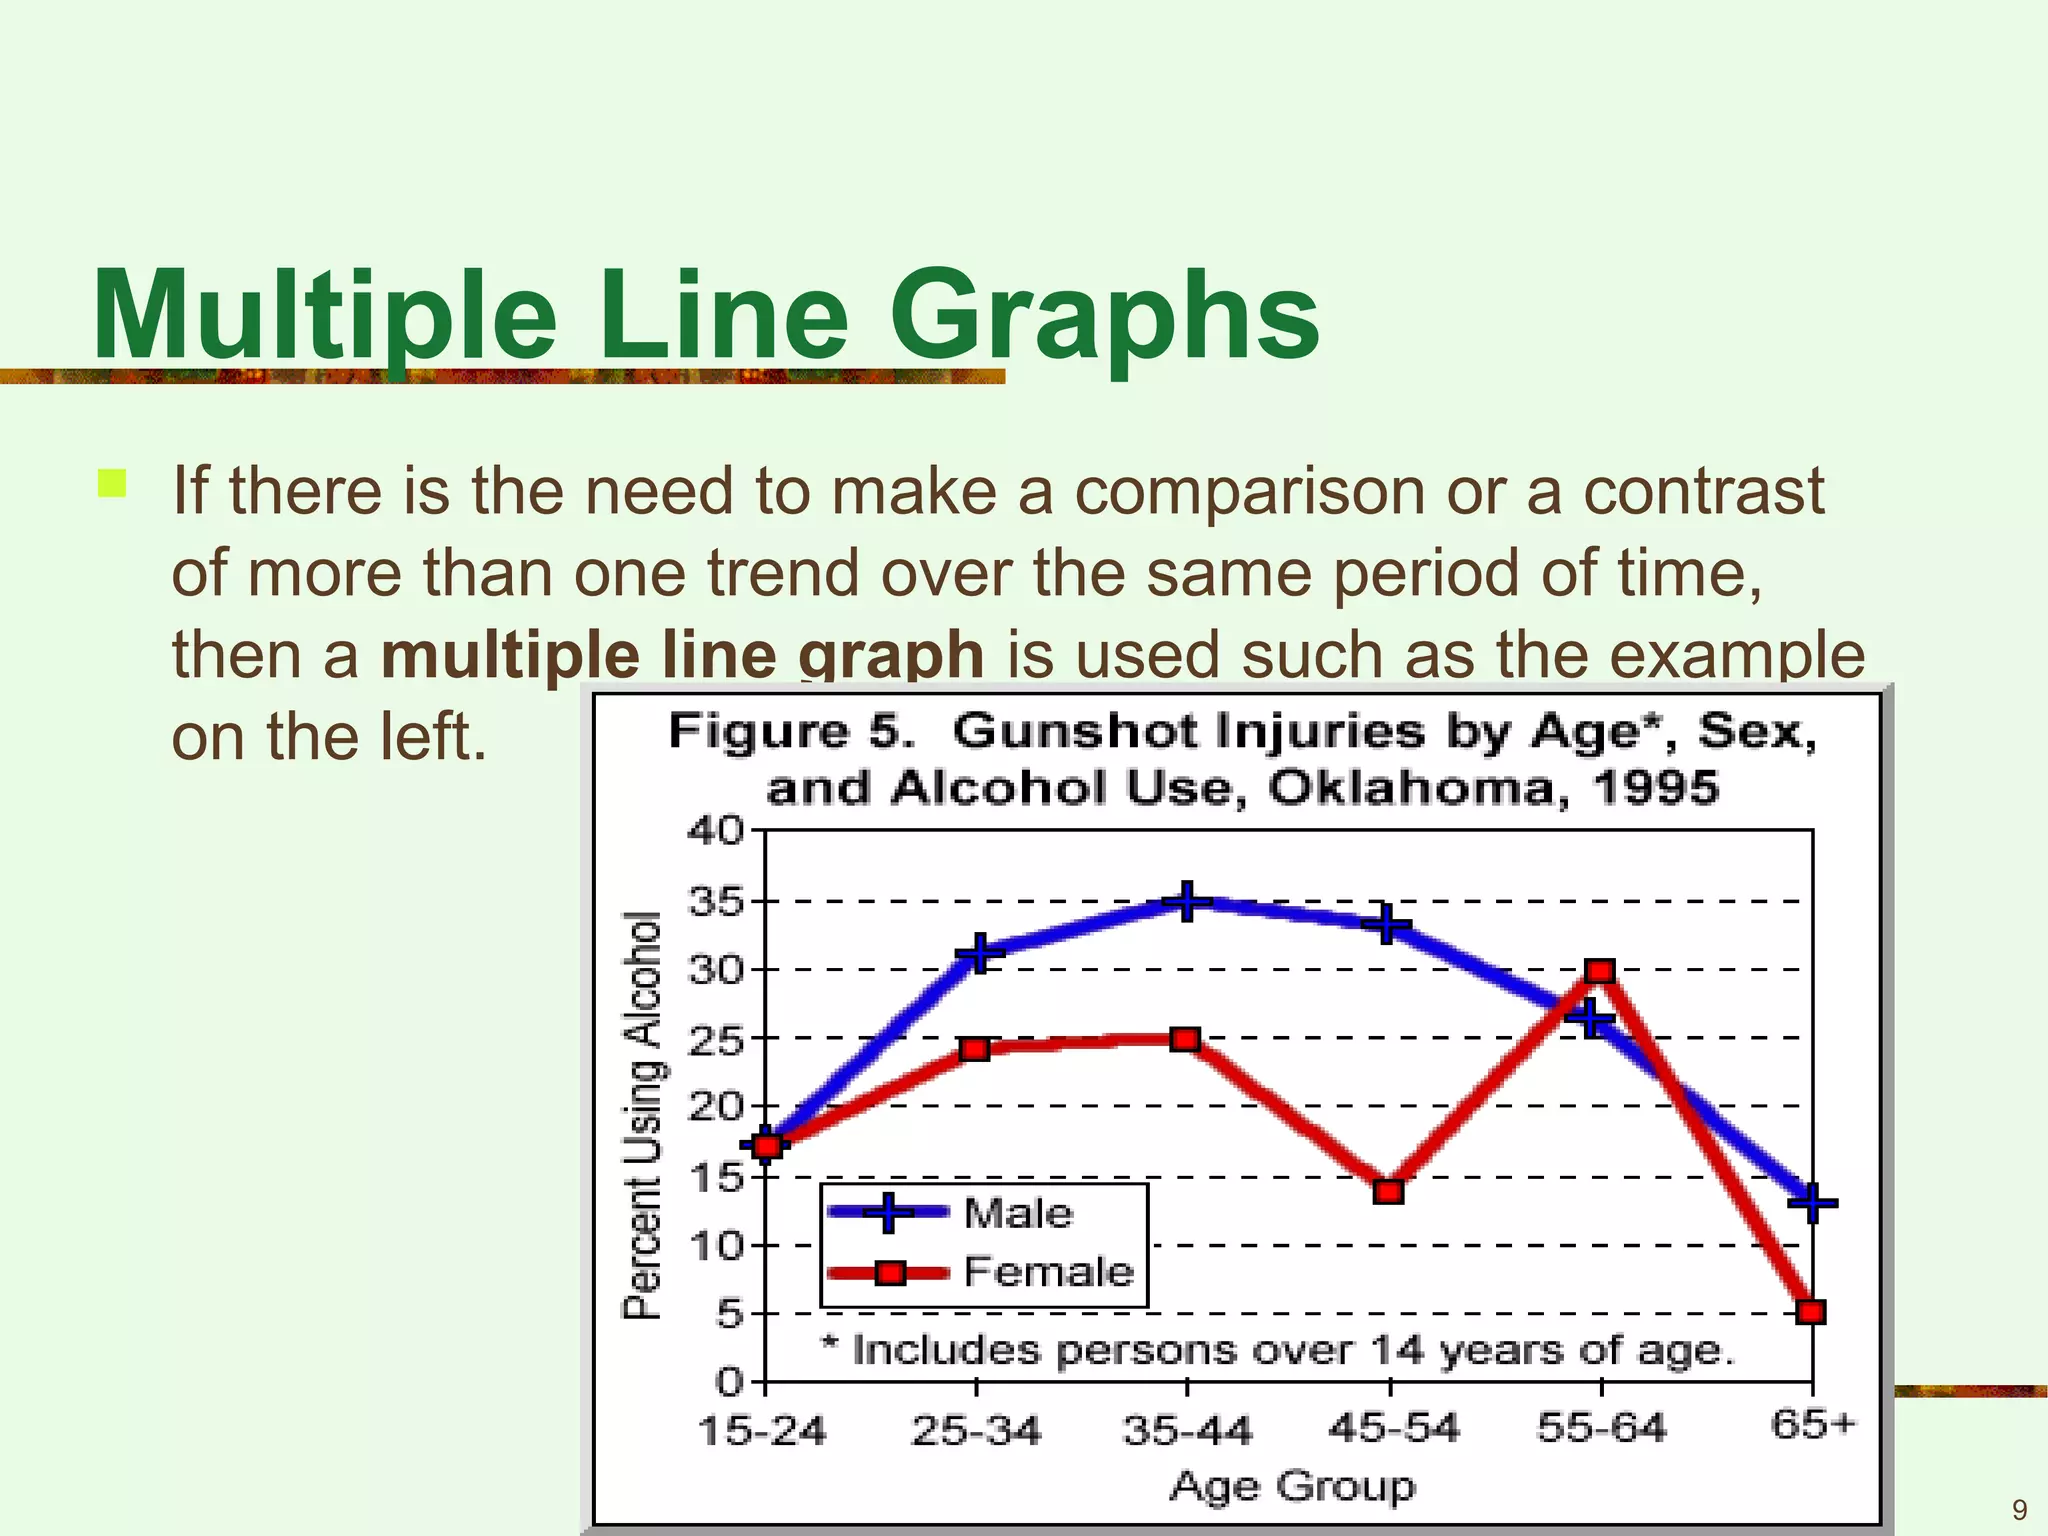
Explanation of multiple line graphs for comparing different trends across a time period.
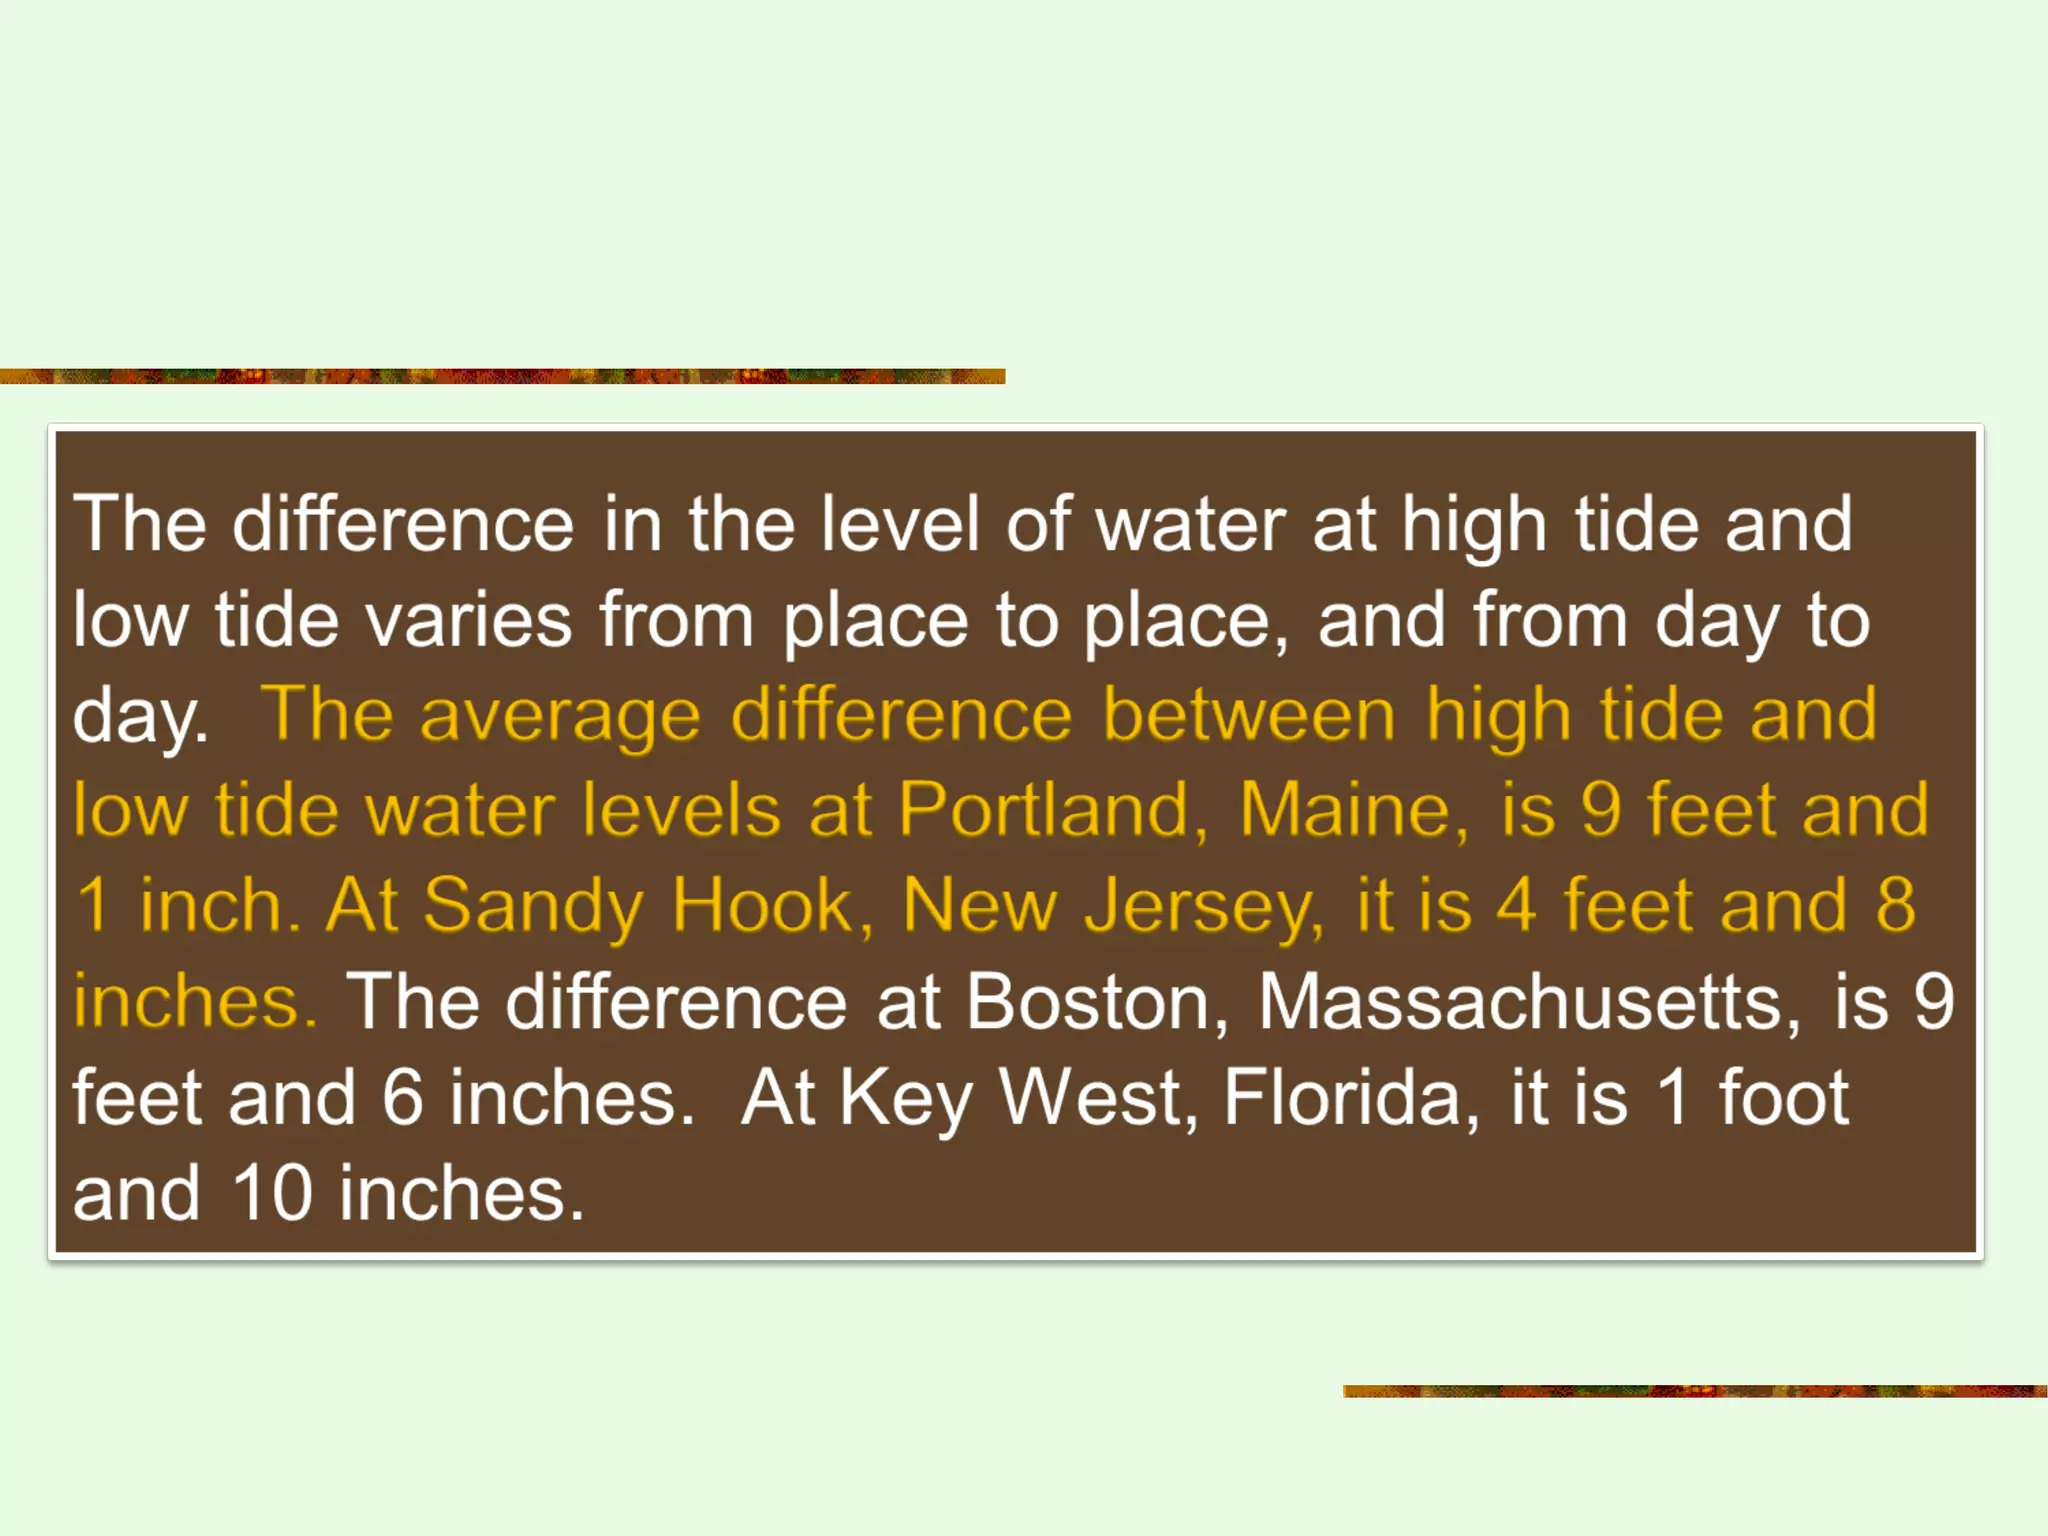
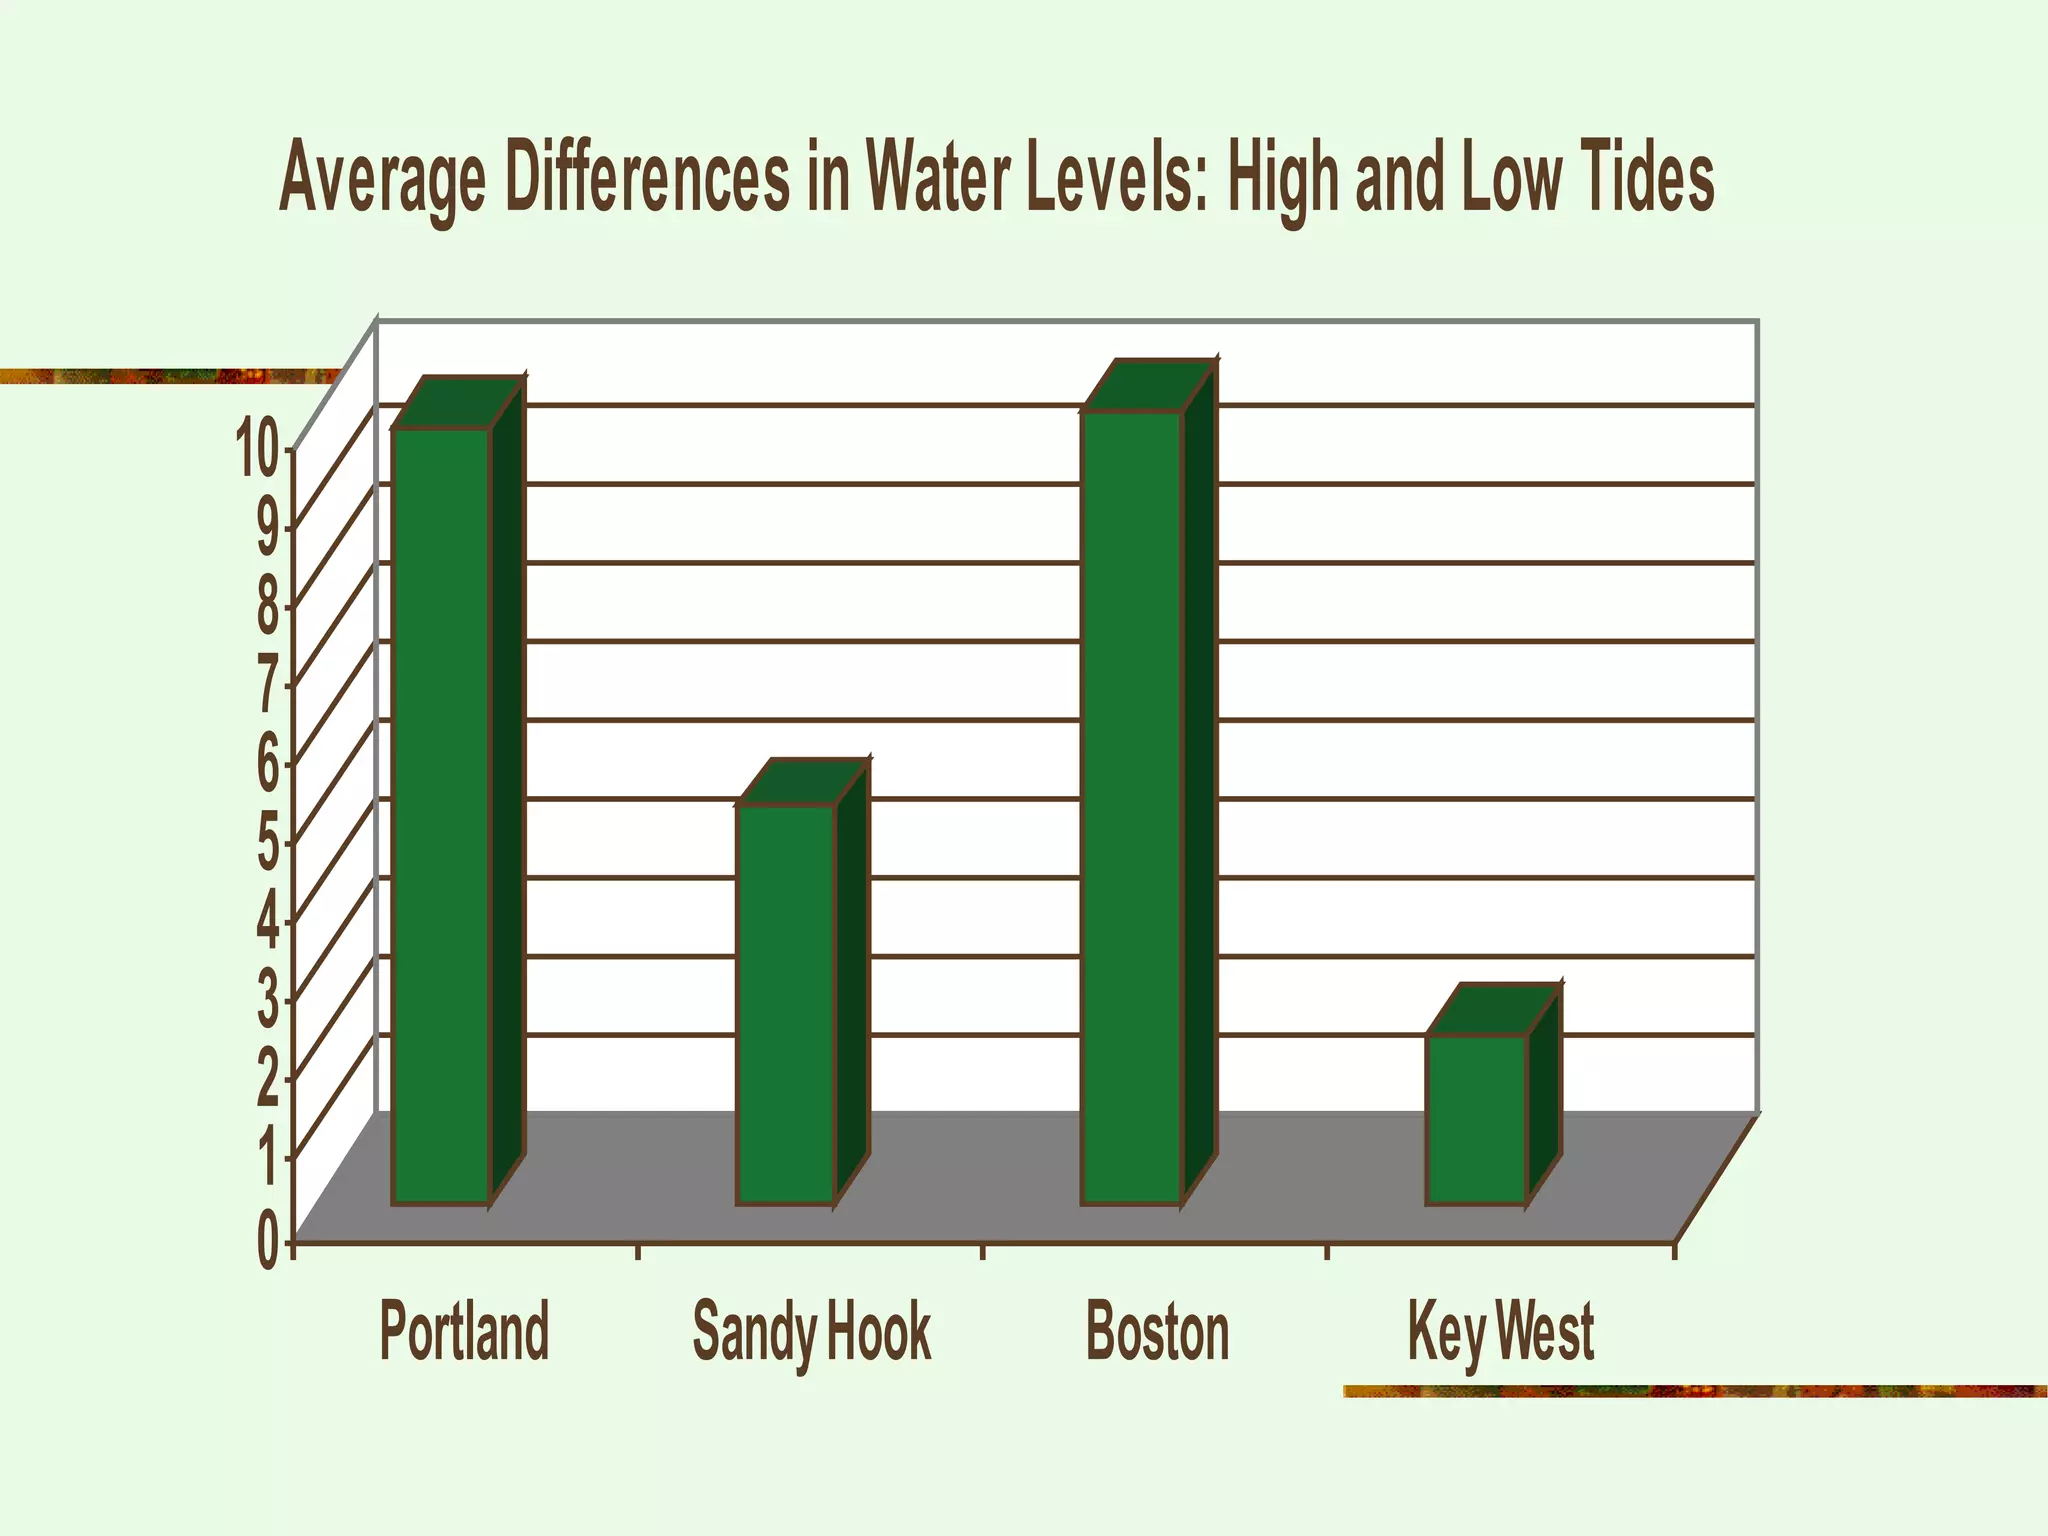
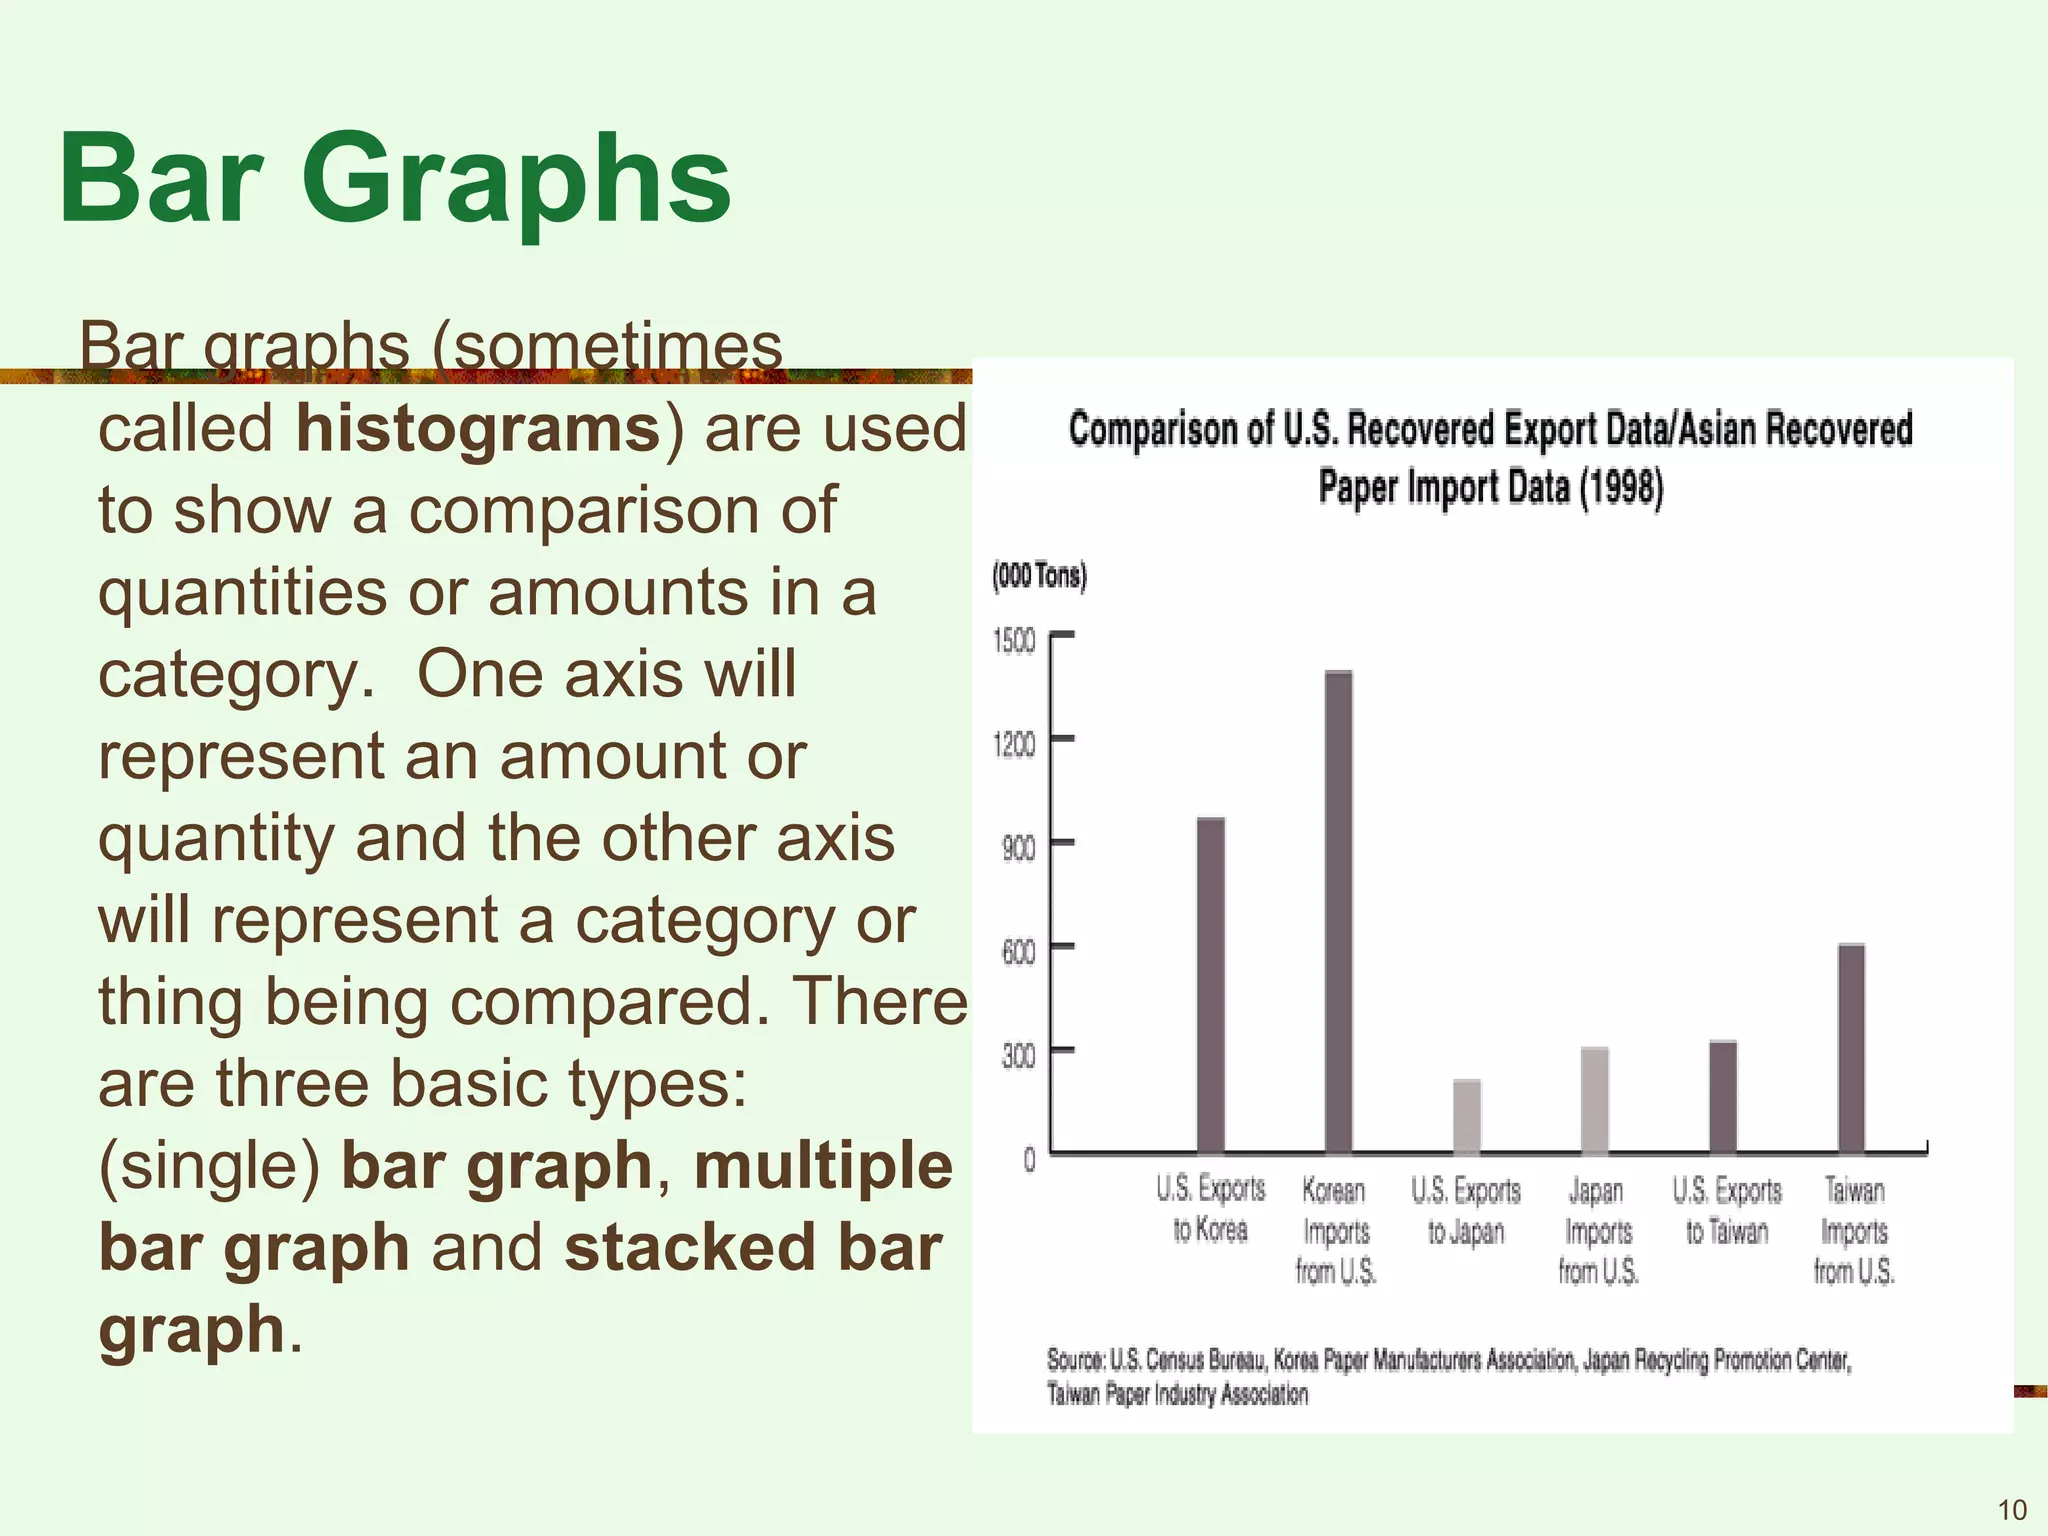
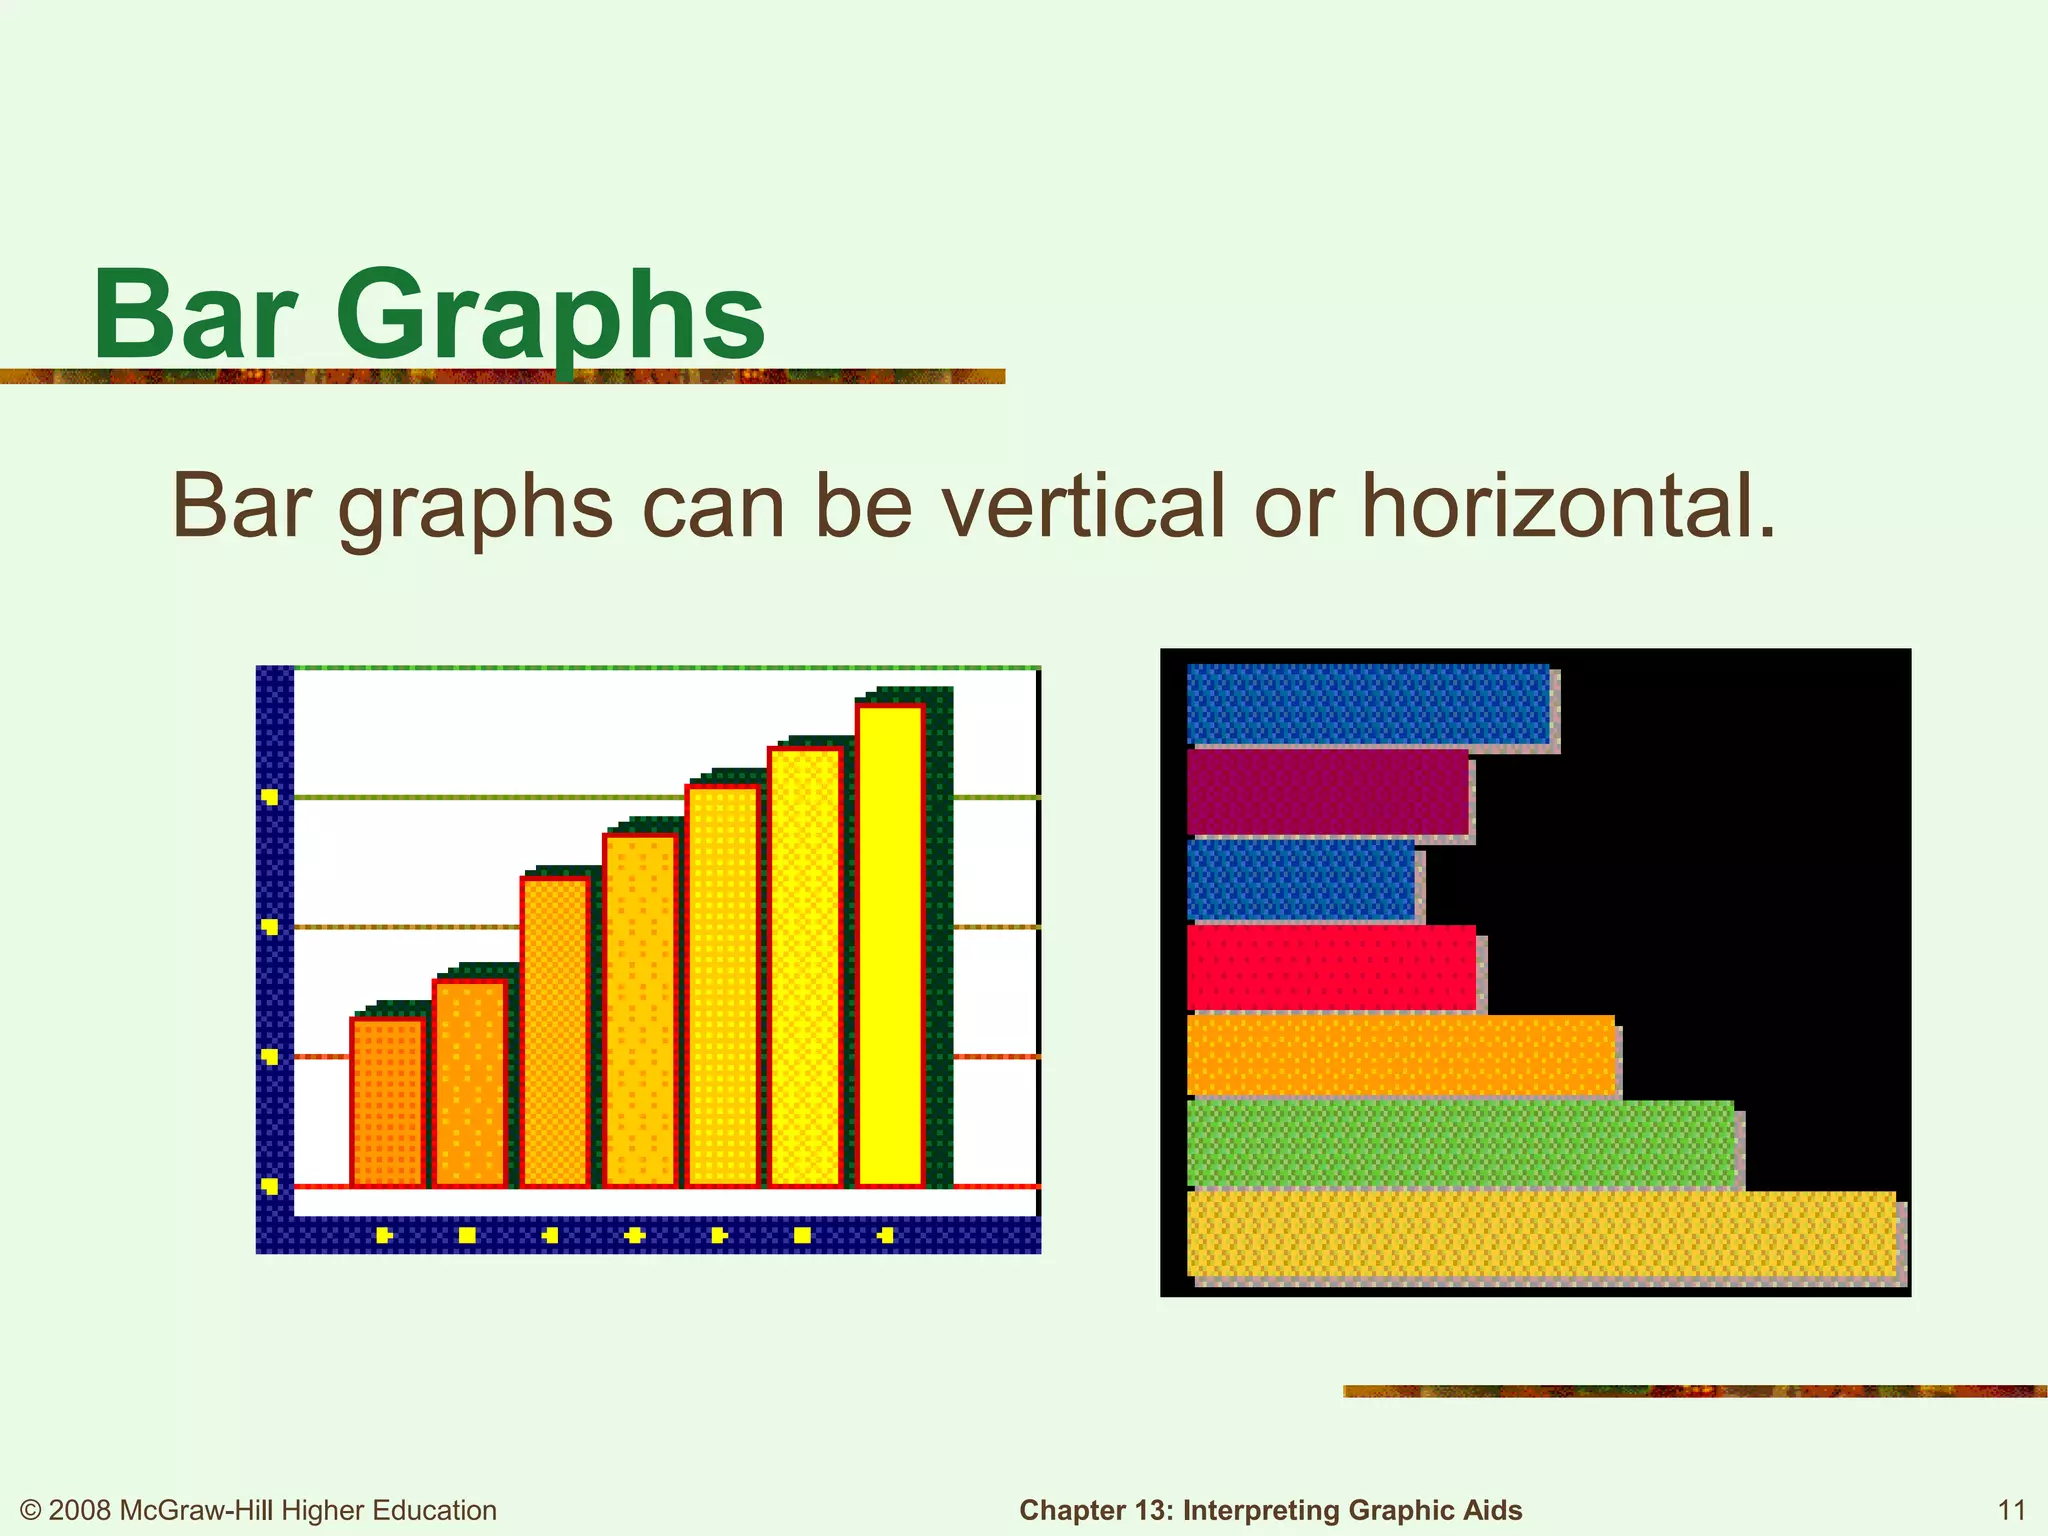
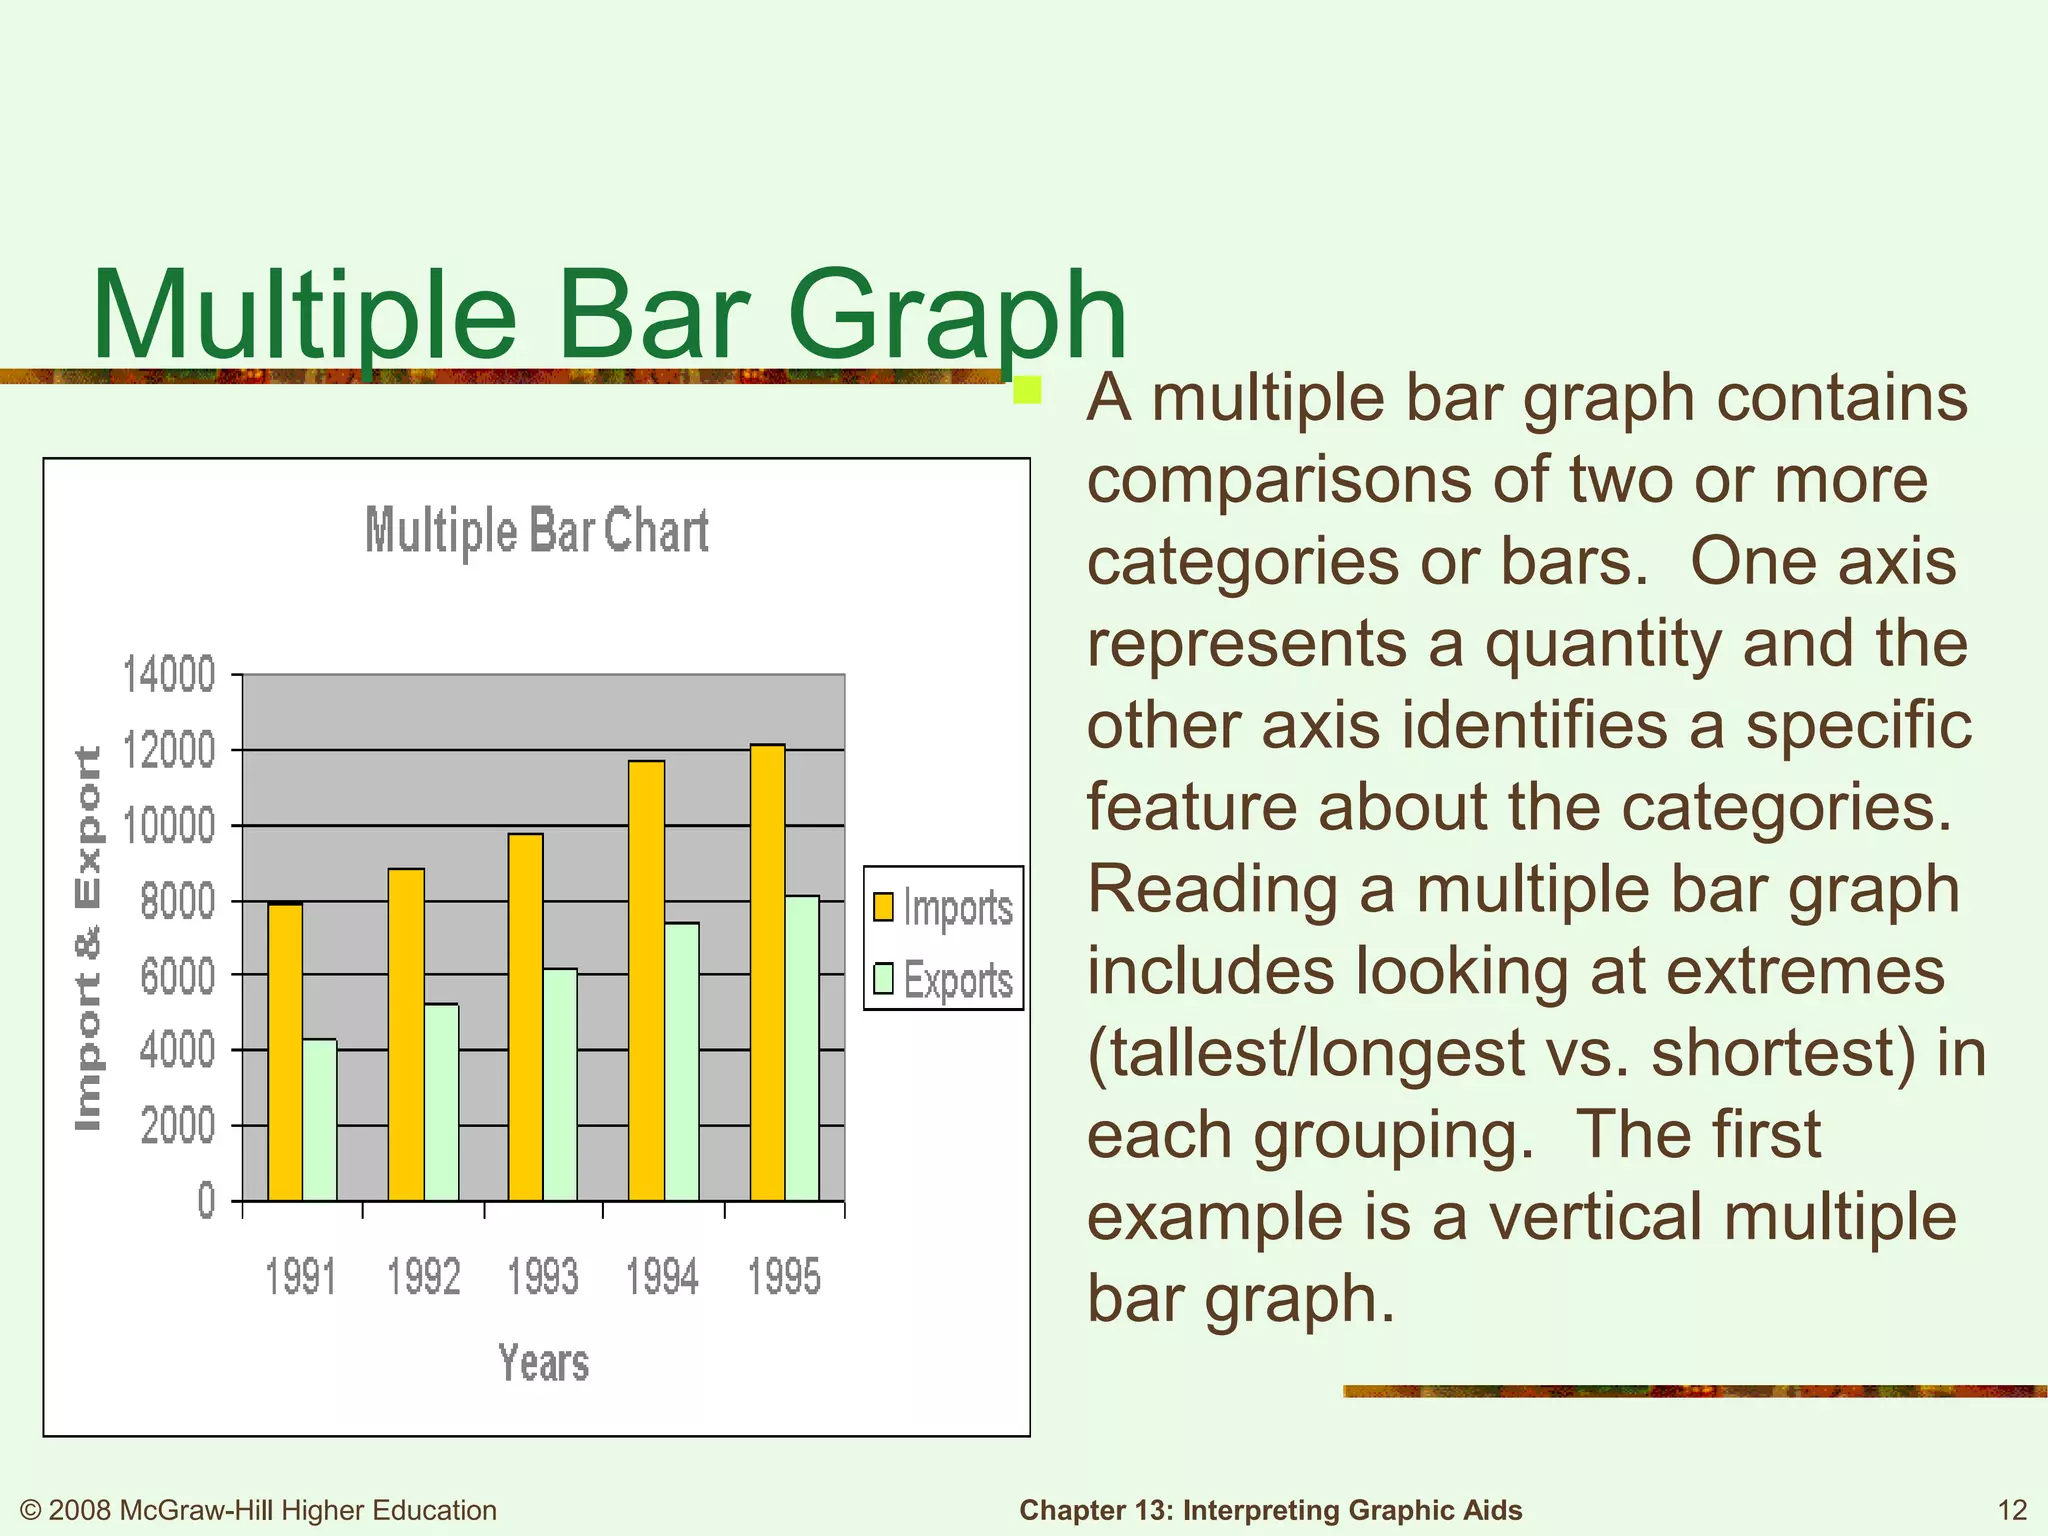
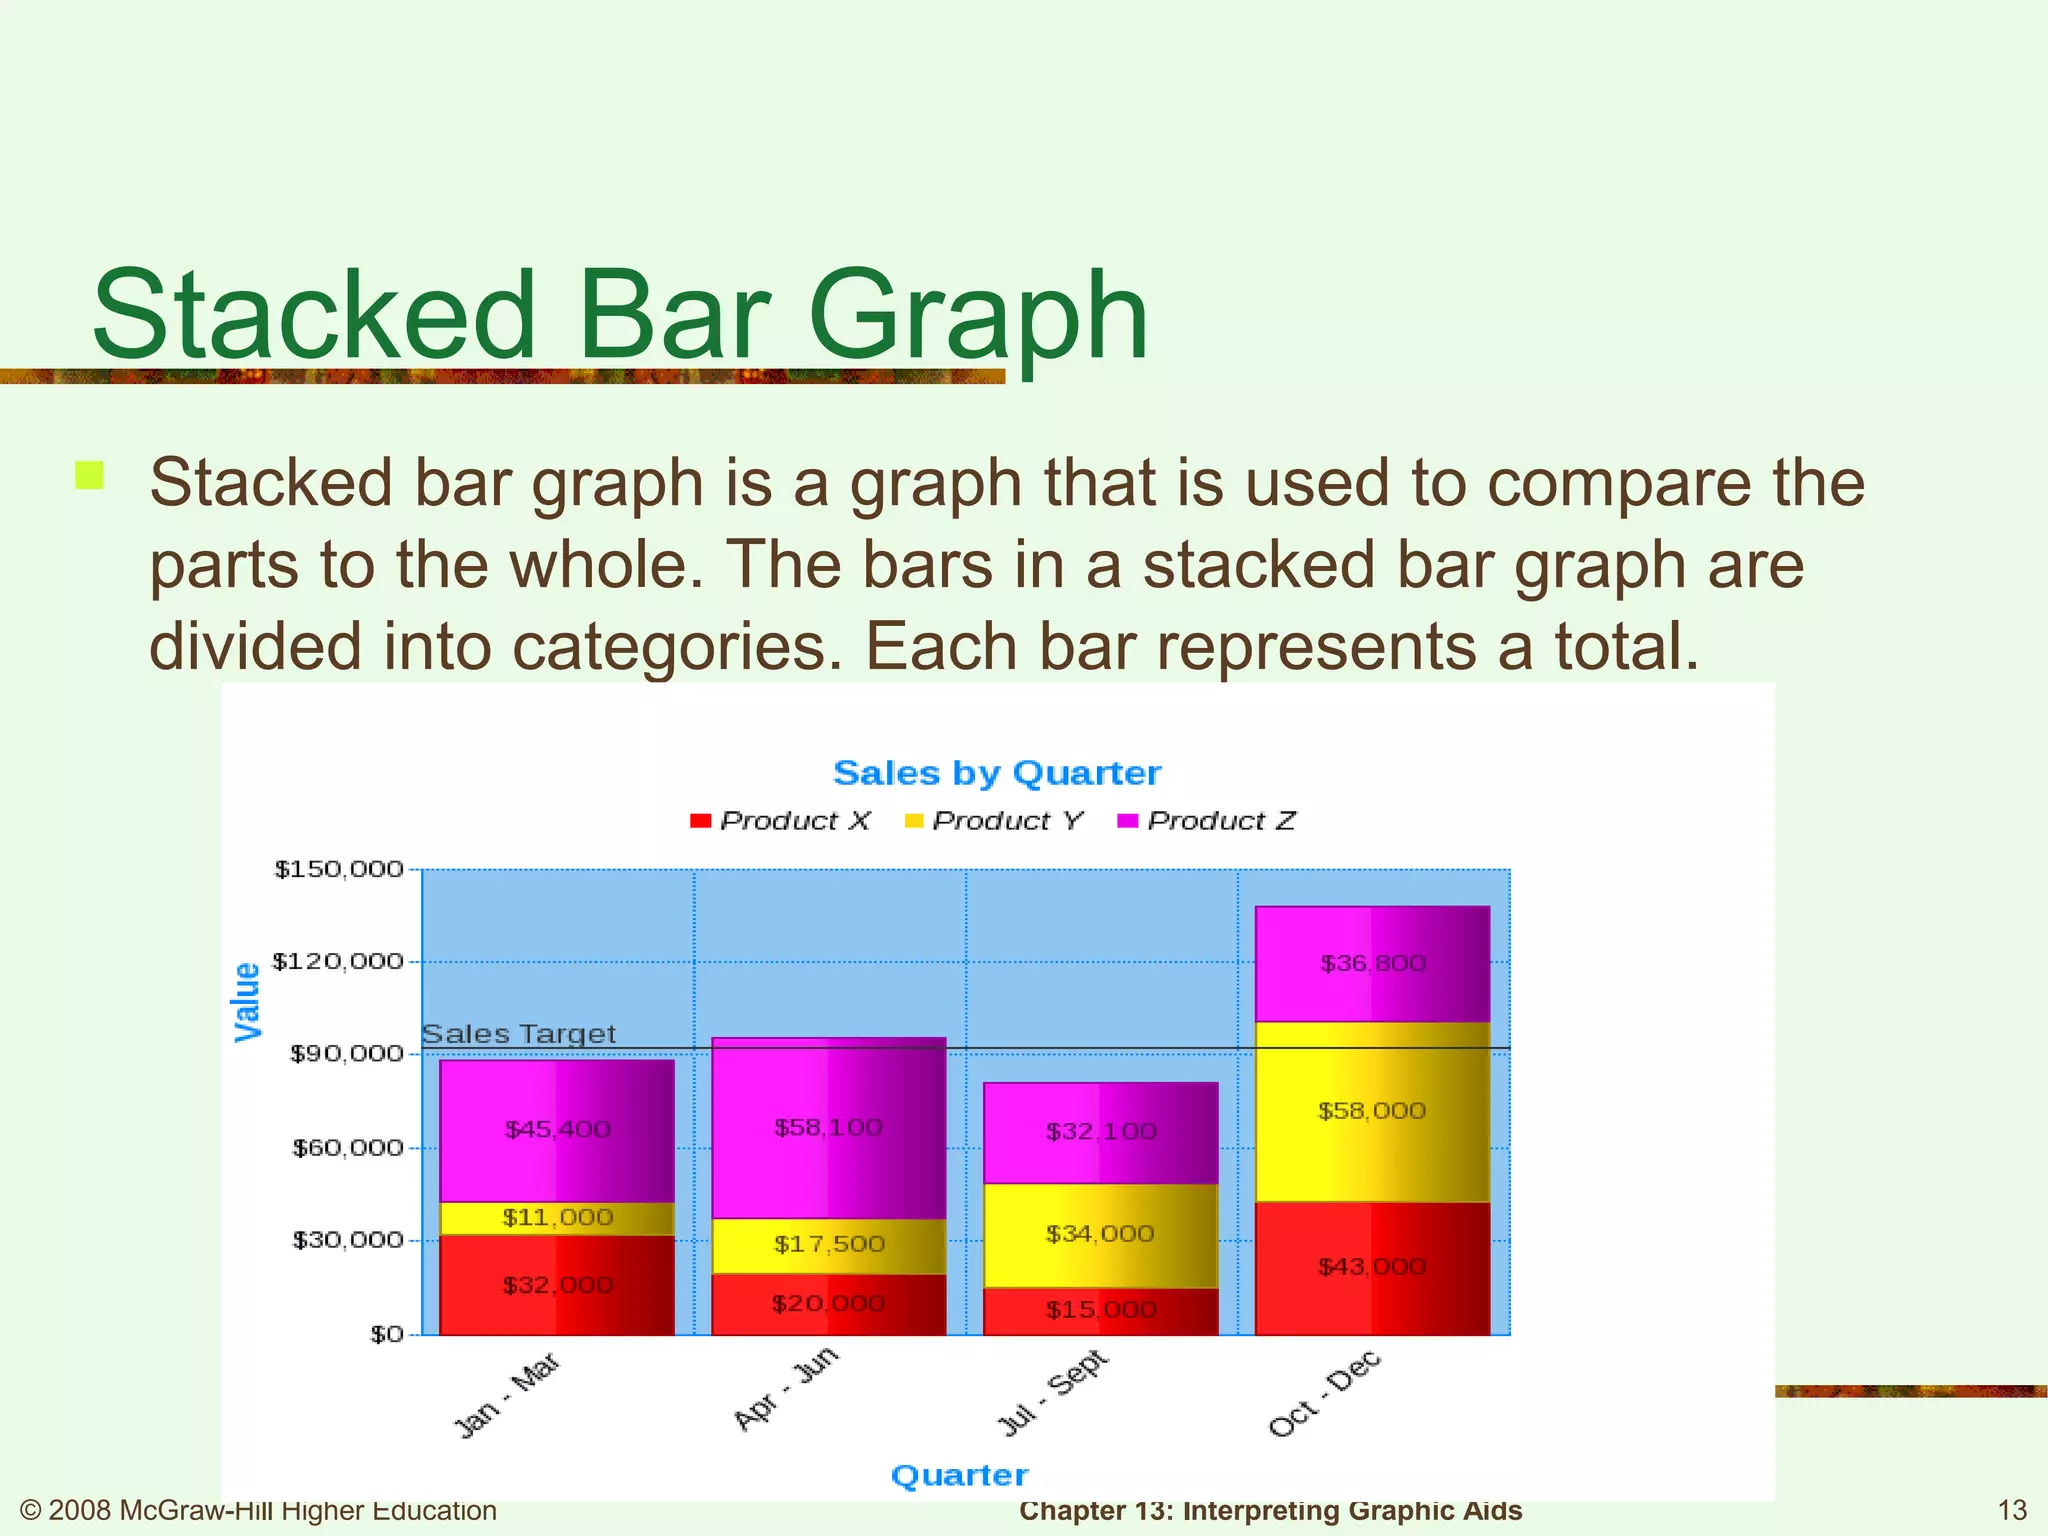
Introduction to bar graphs and their types; method for comparing quantities or categories.
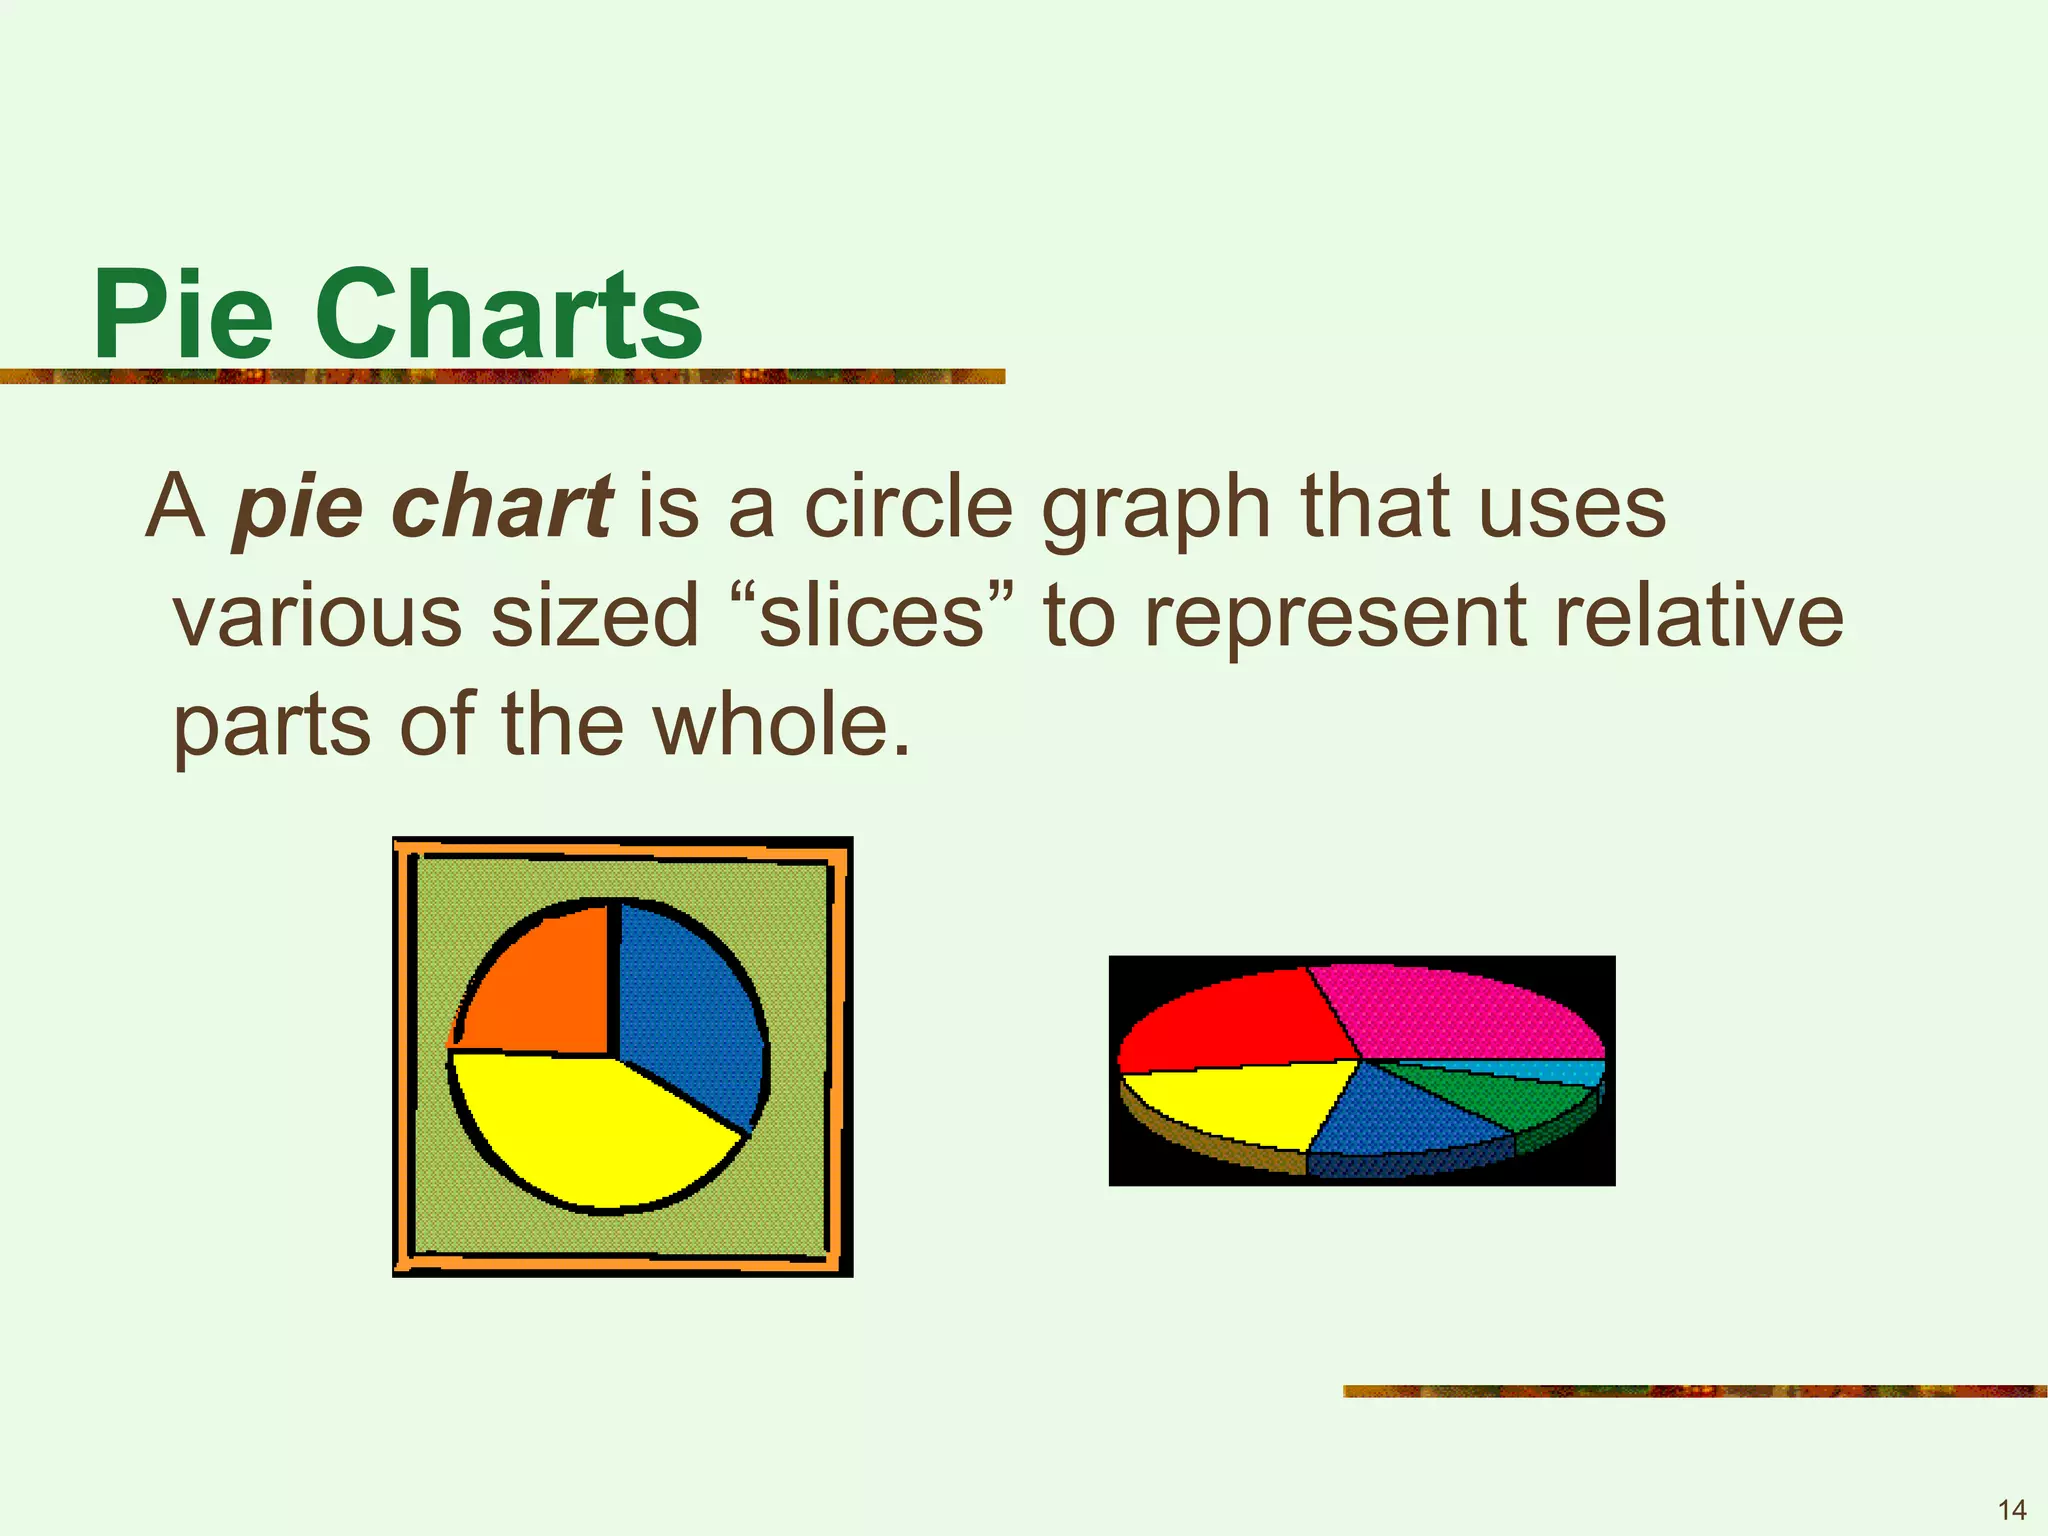
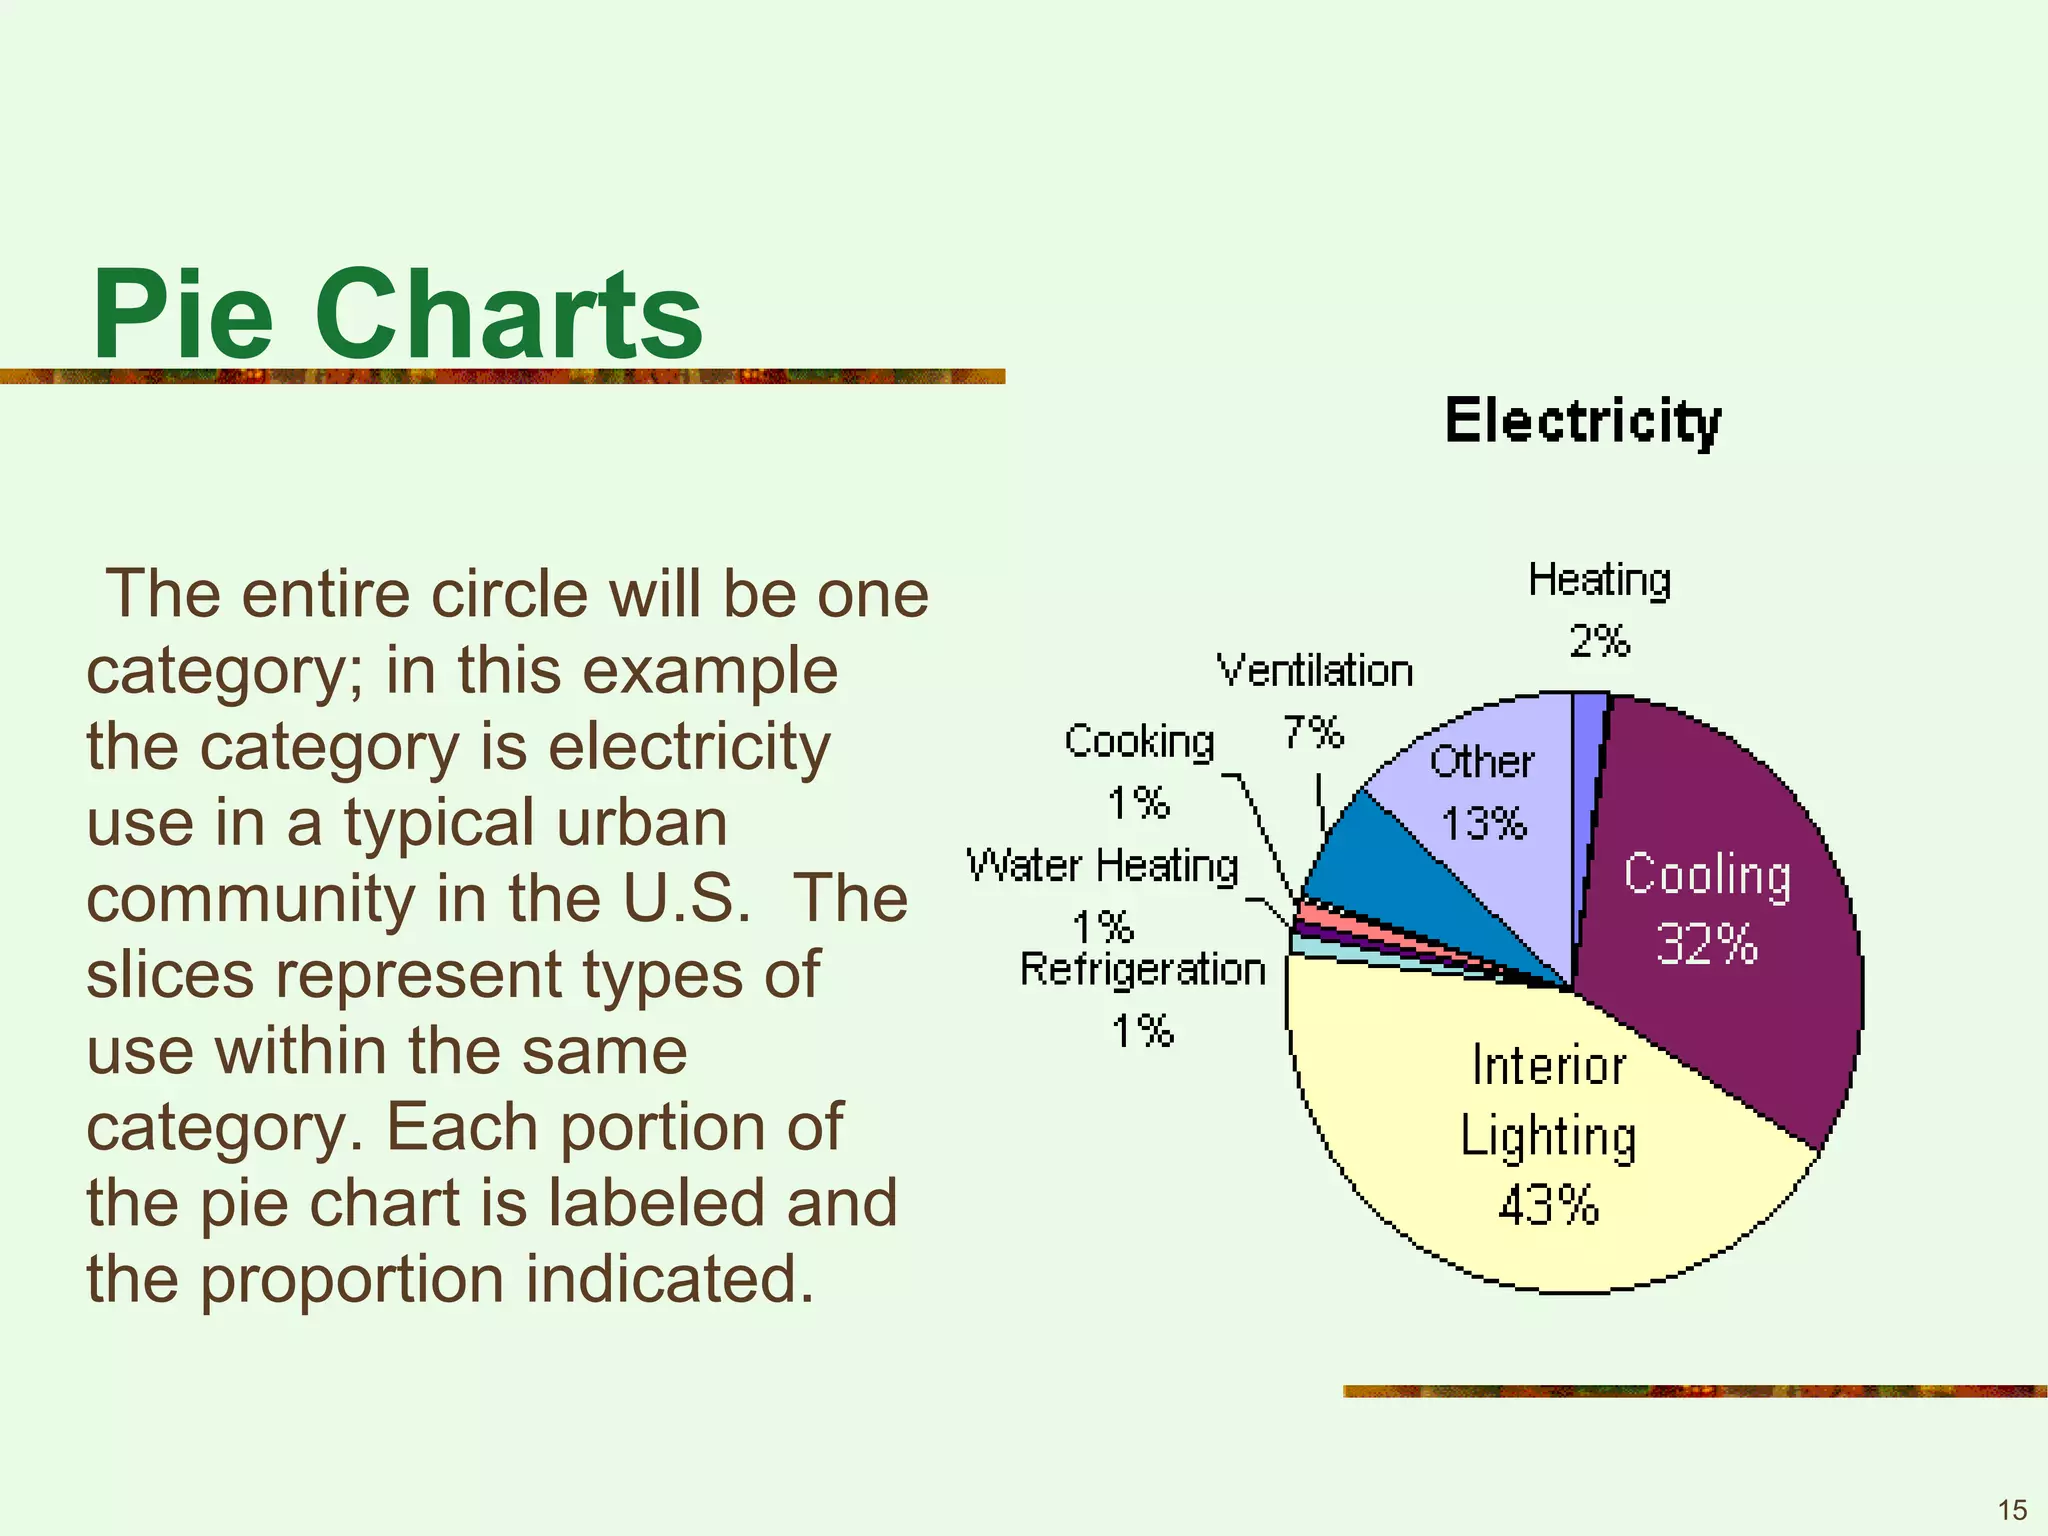
Overview of pie charts, illustrating parts of a whole with various sized slices representing categories.
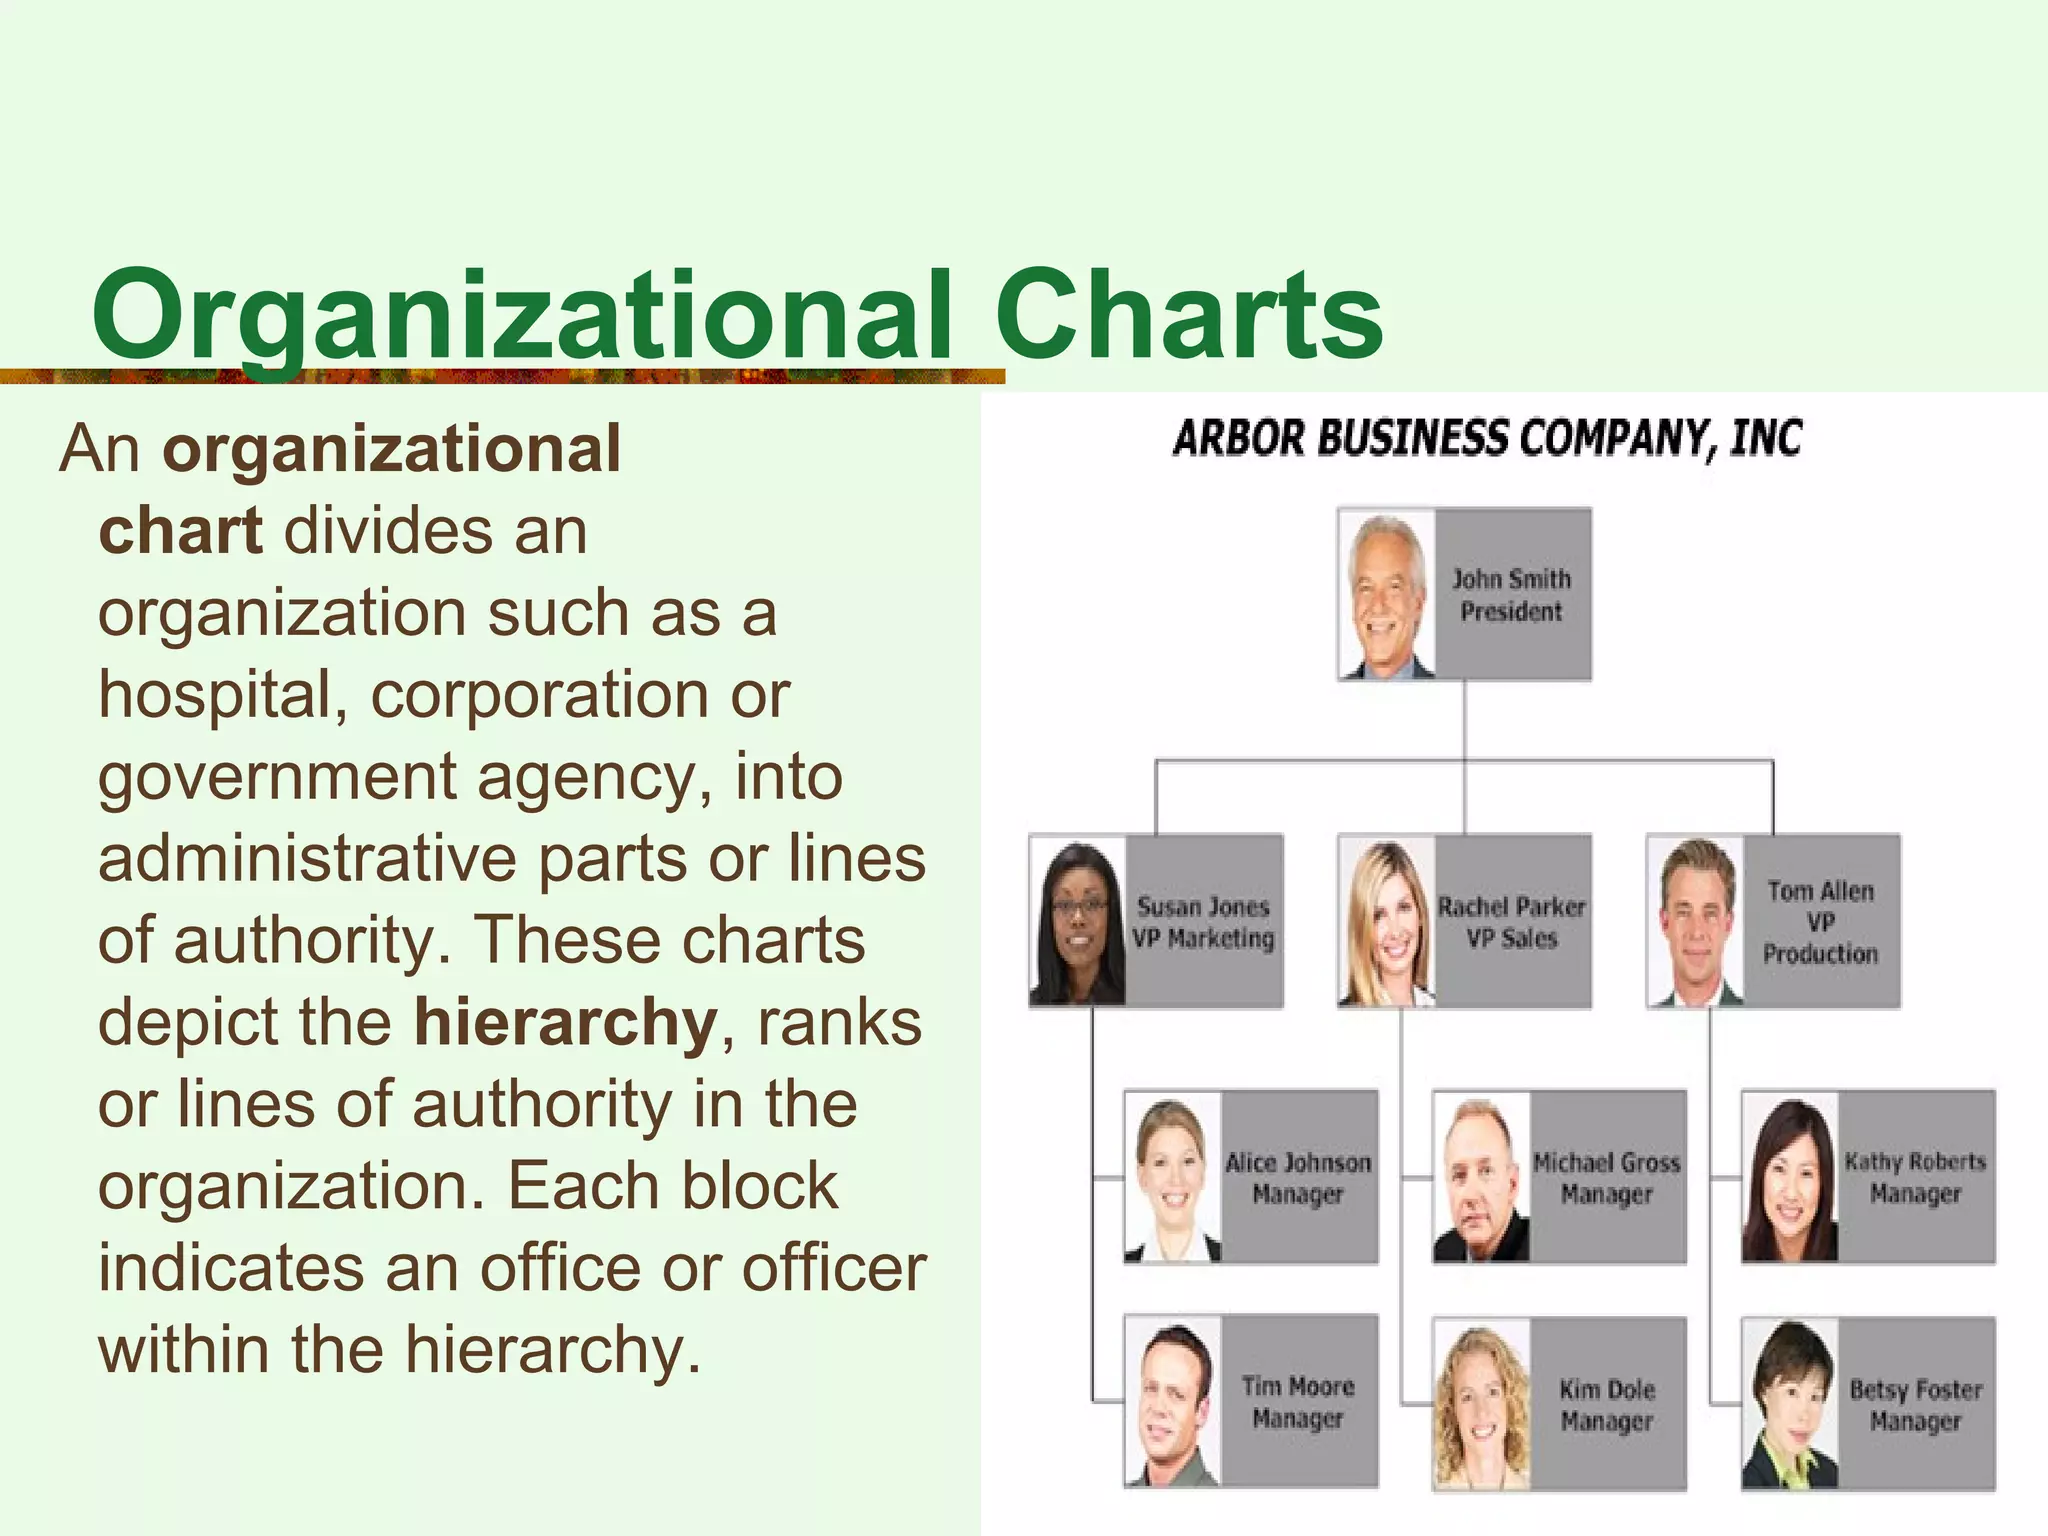
Description of organizational charts depicting hierarchy and relationships within organizations.
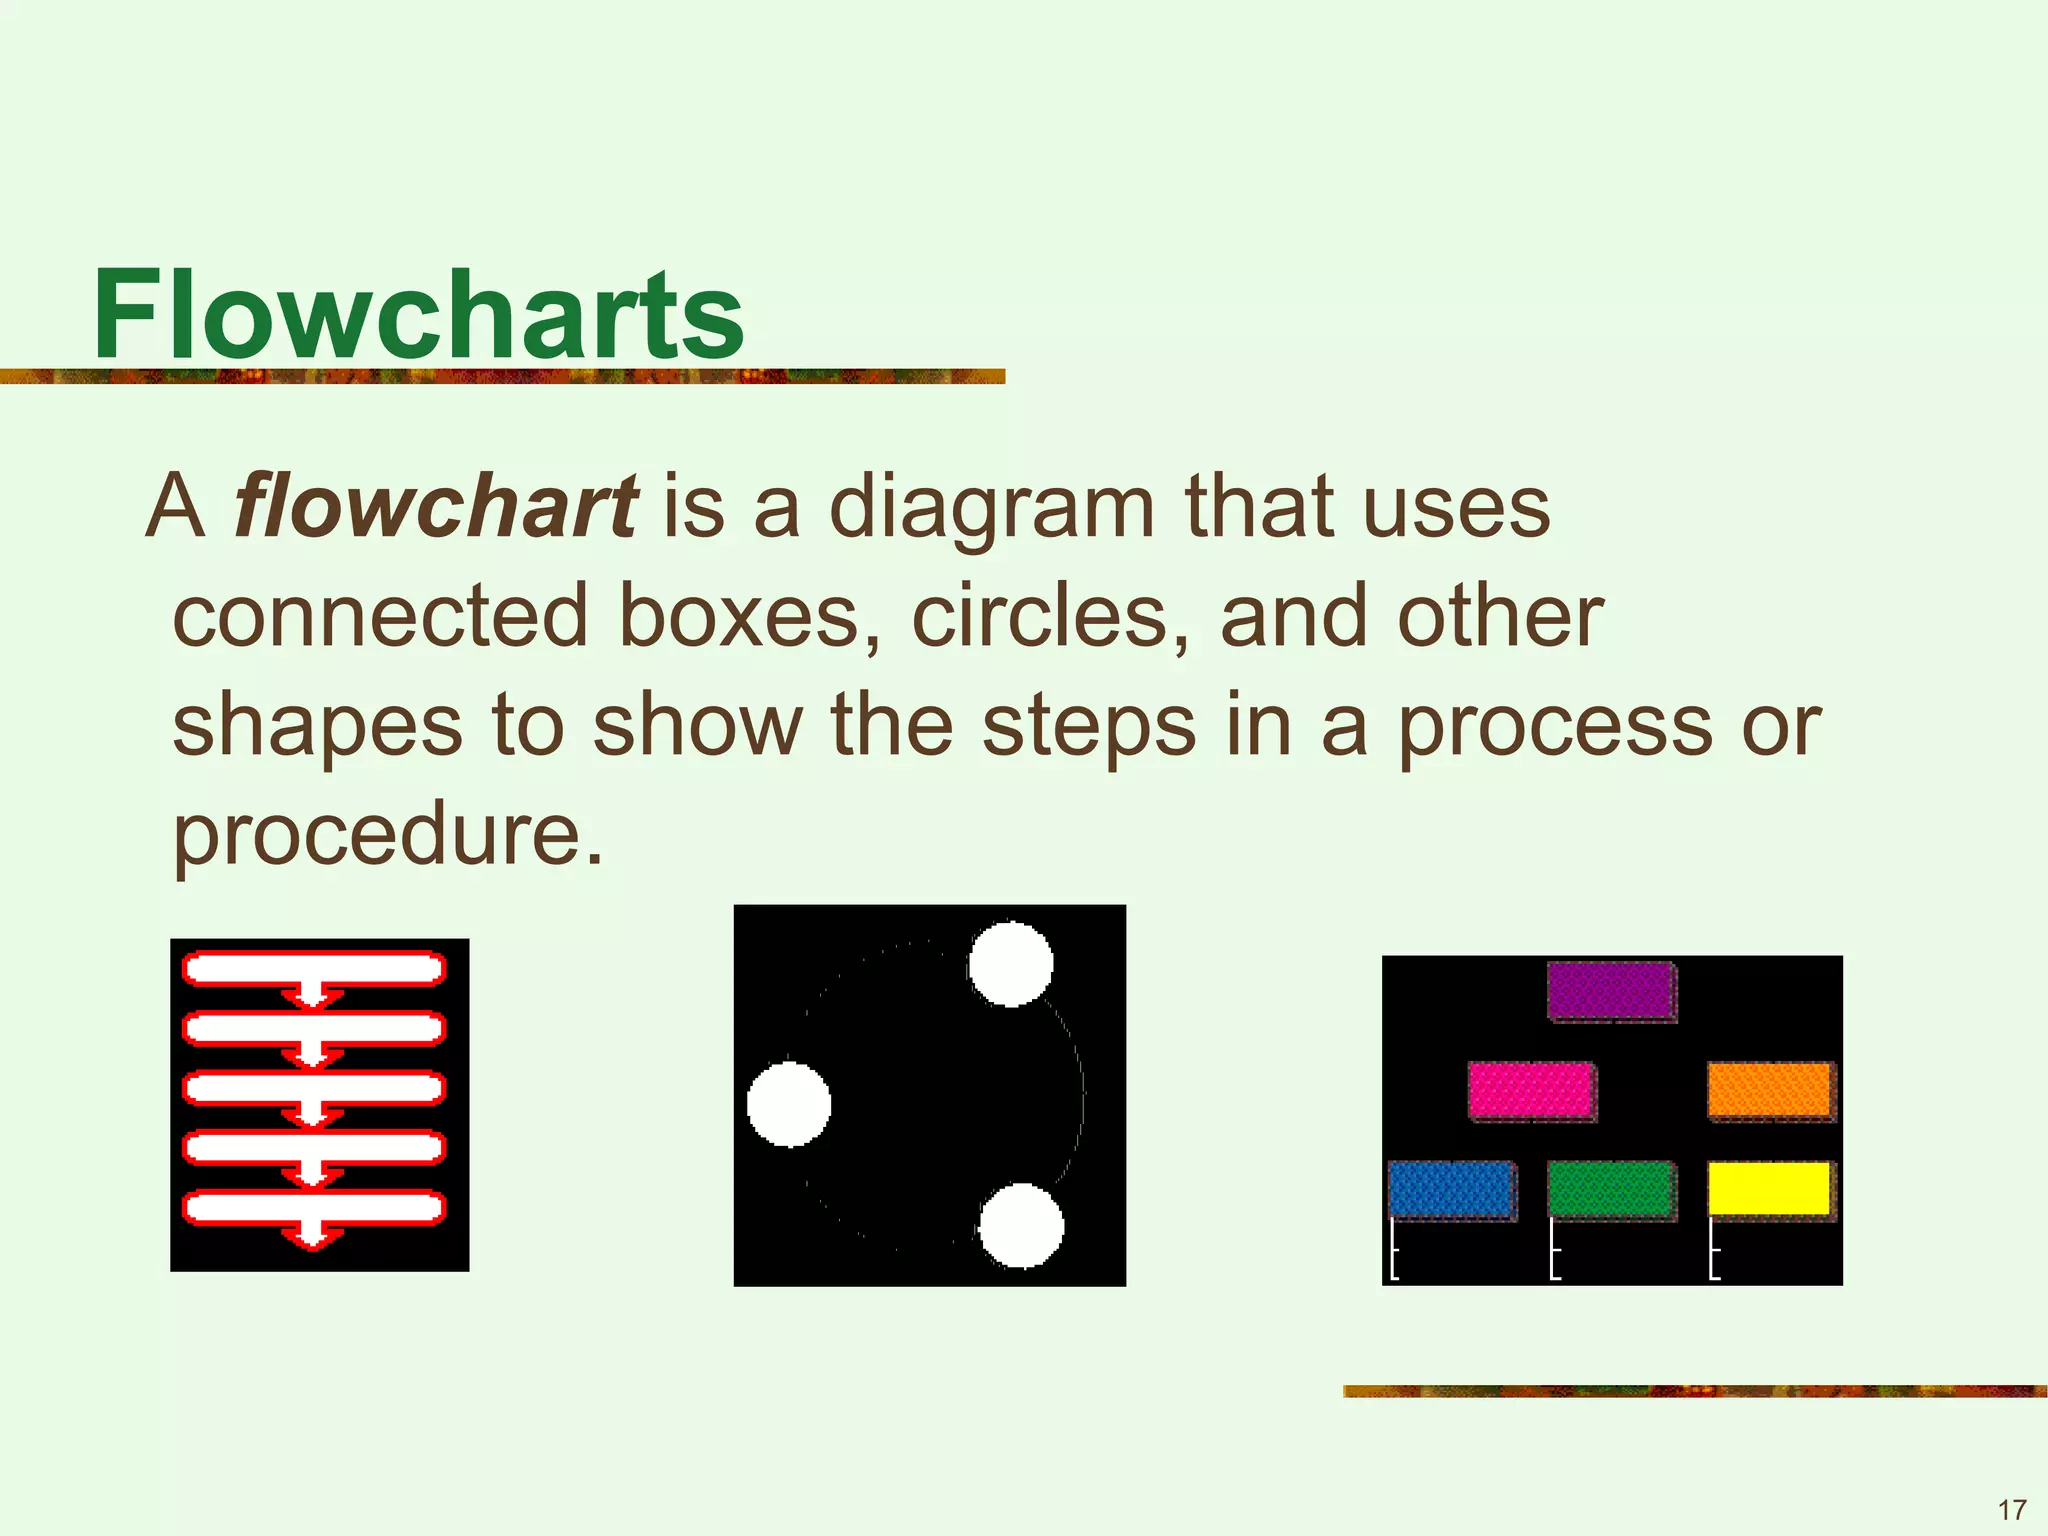
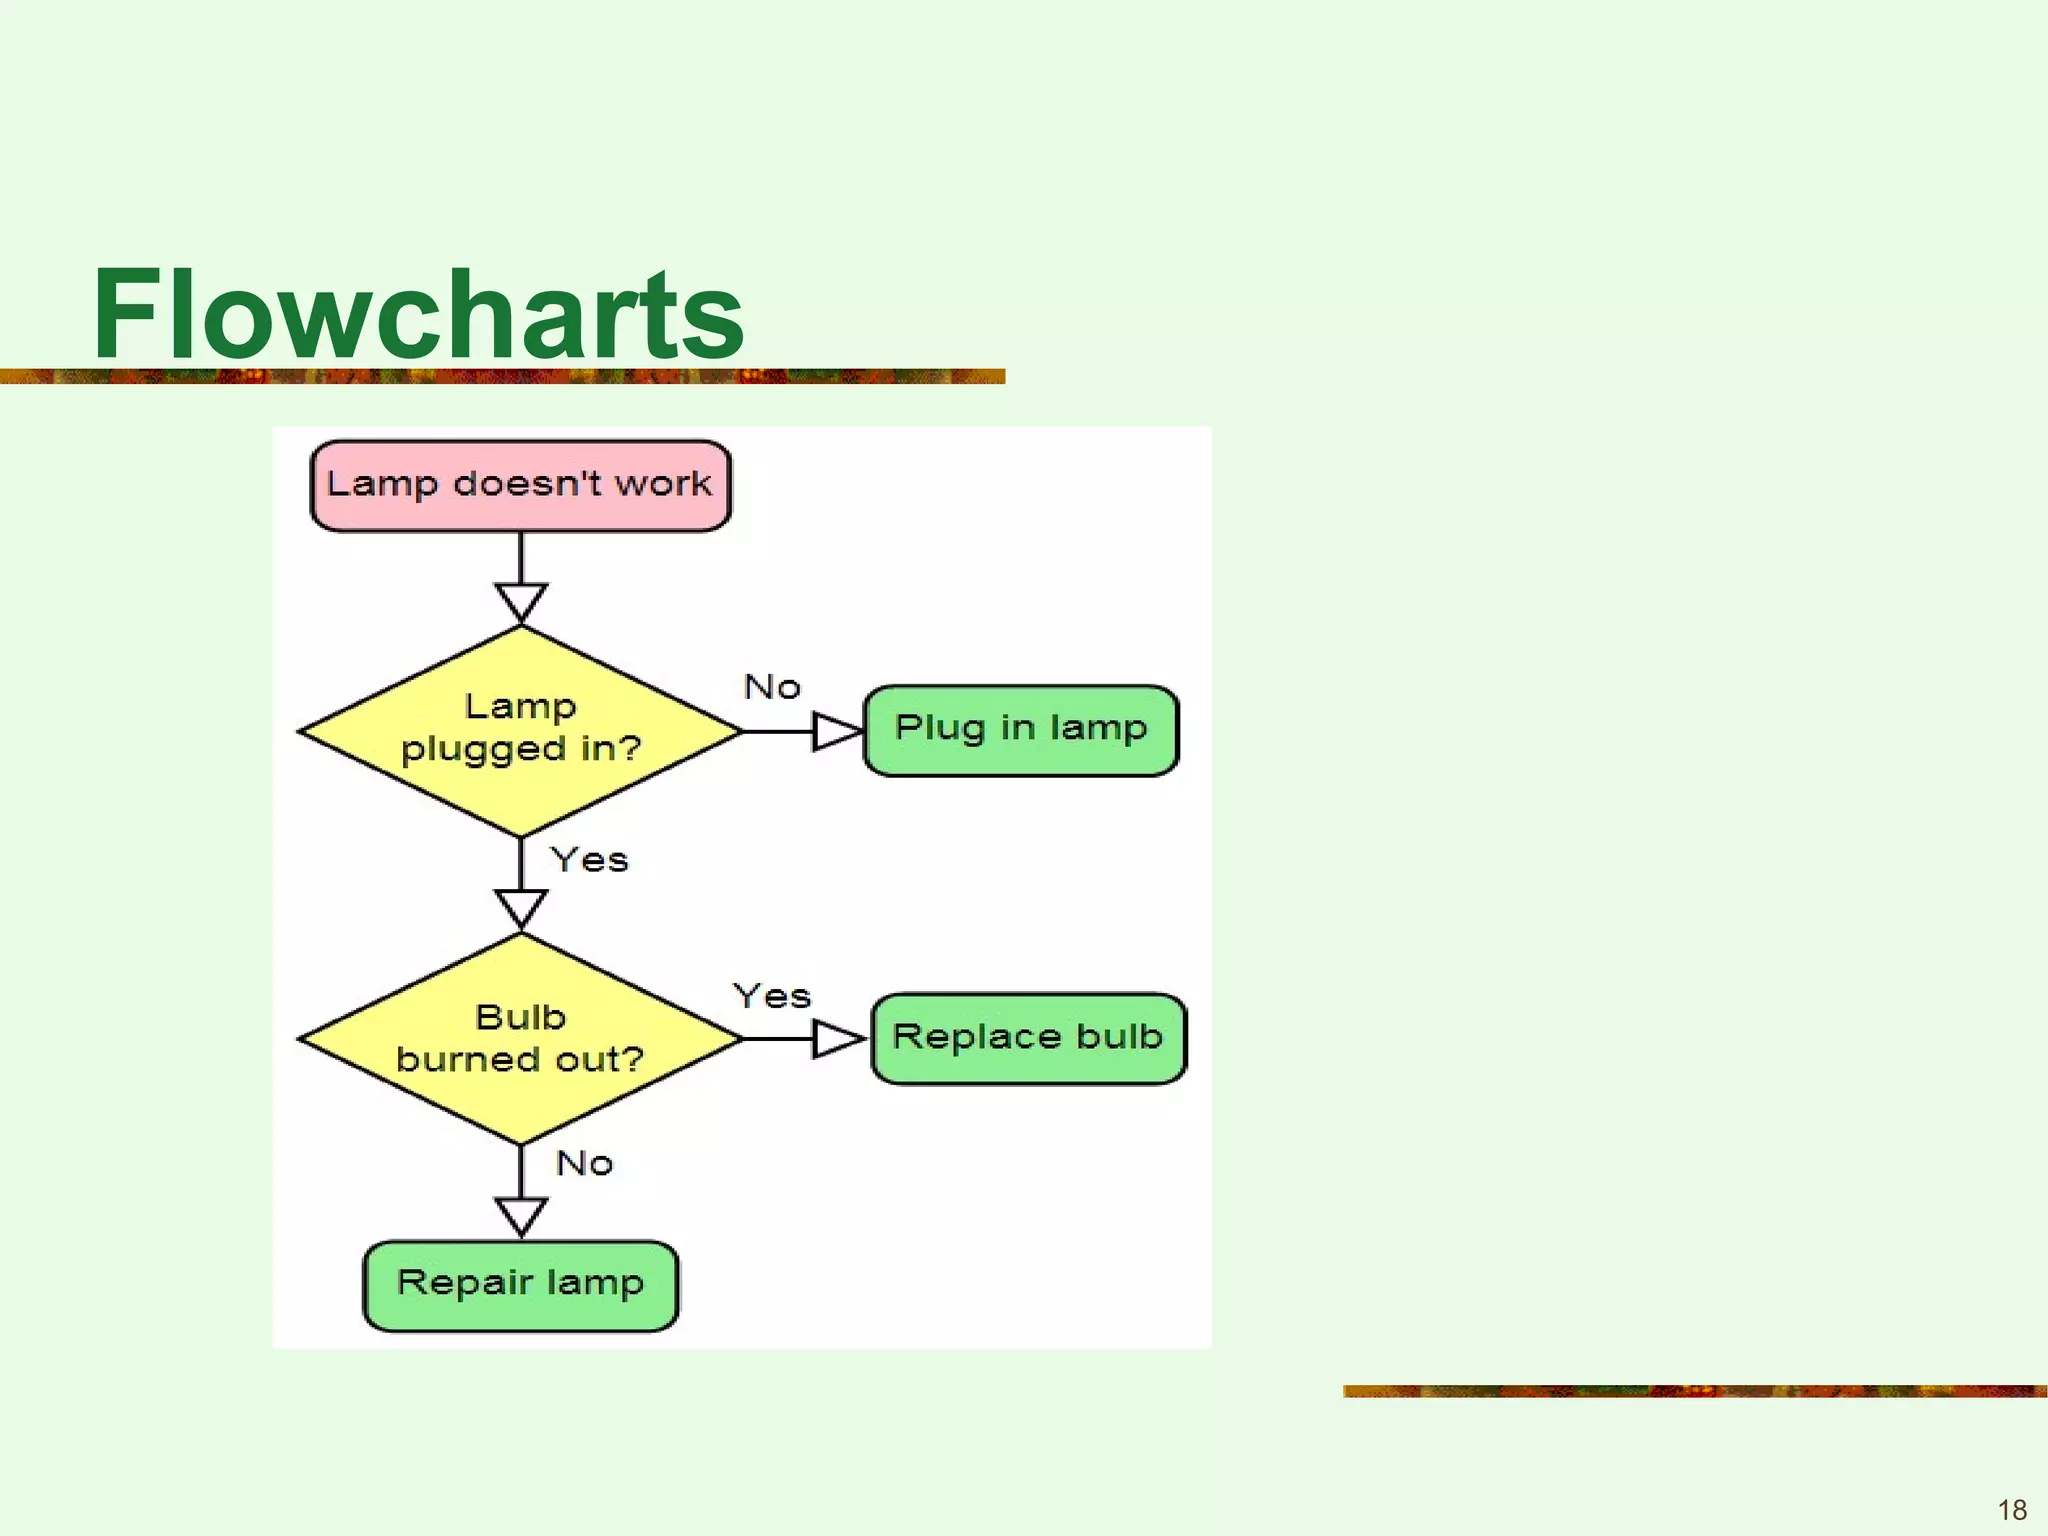
Explanation of flowcharts as diagrams illustrating steps in processes or procedures.
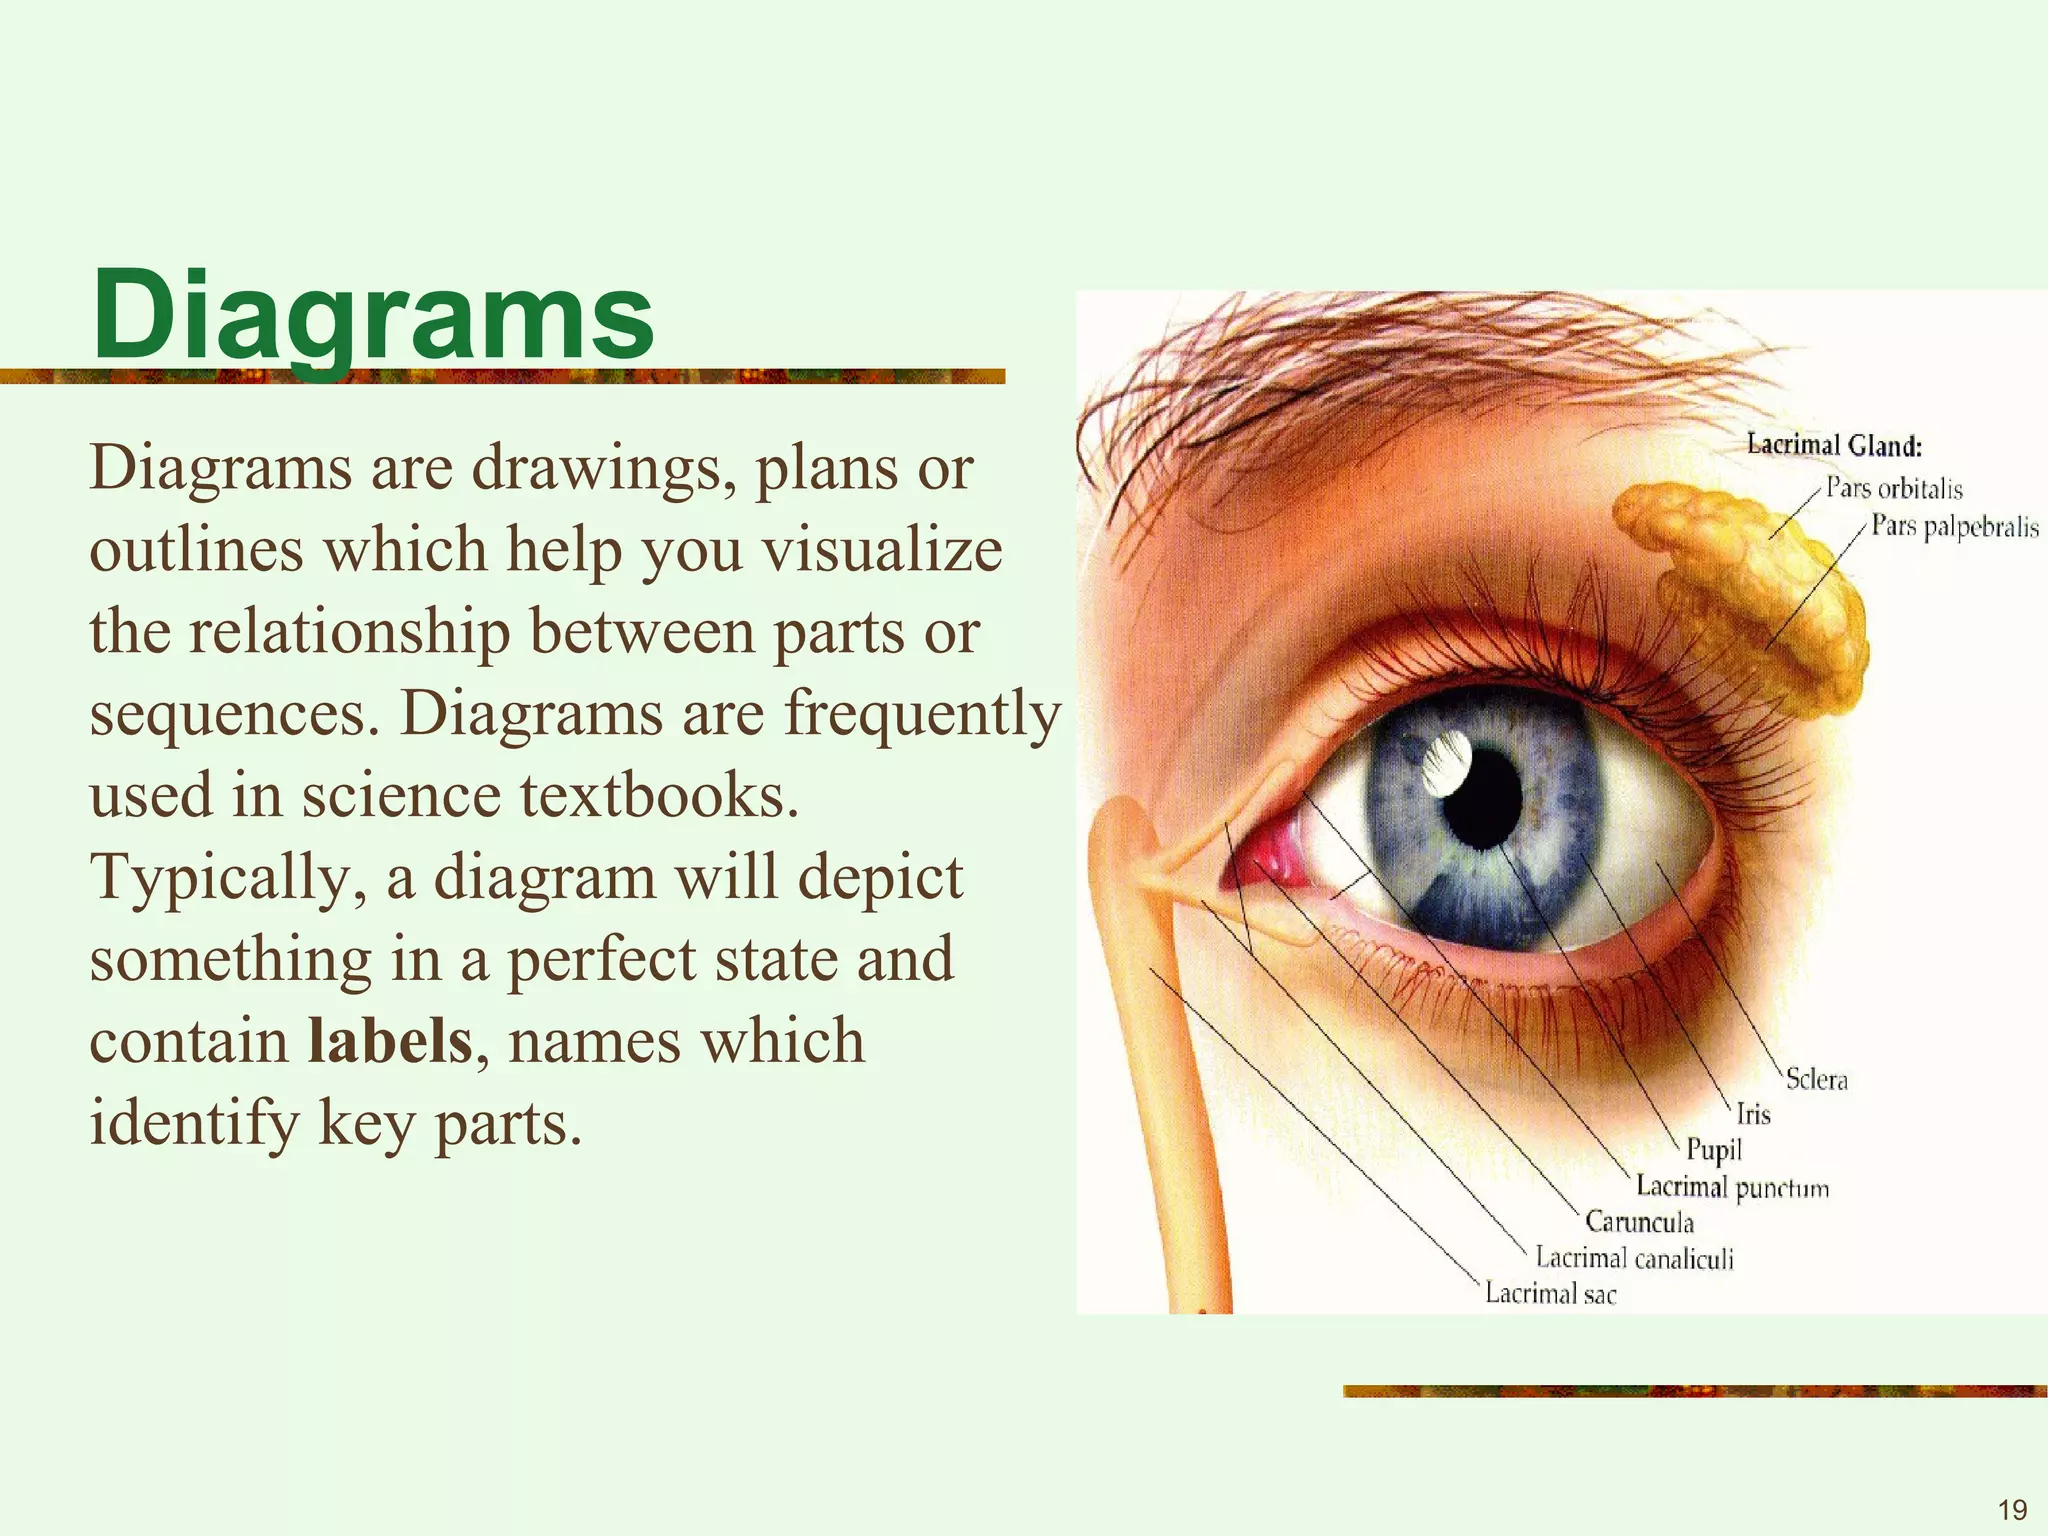
Diagrams help visualize relationships and sequences, often used in educational contexts.
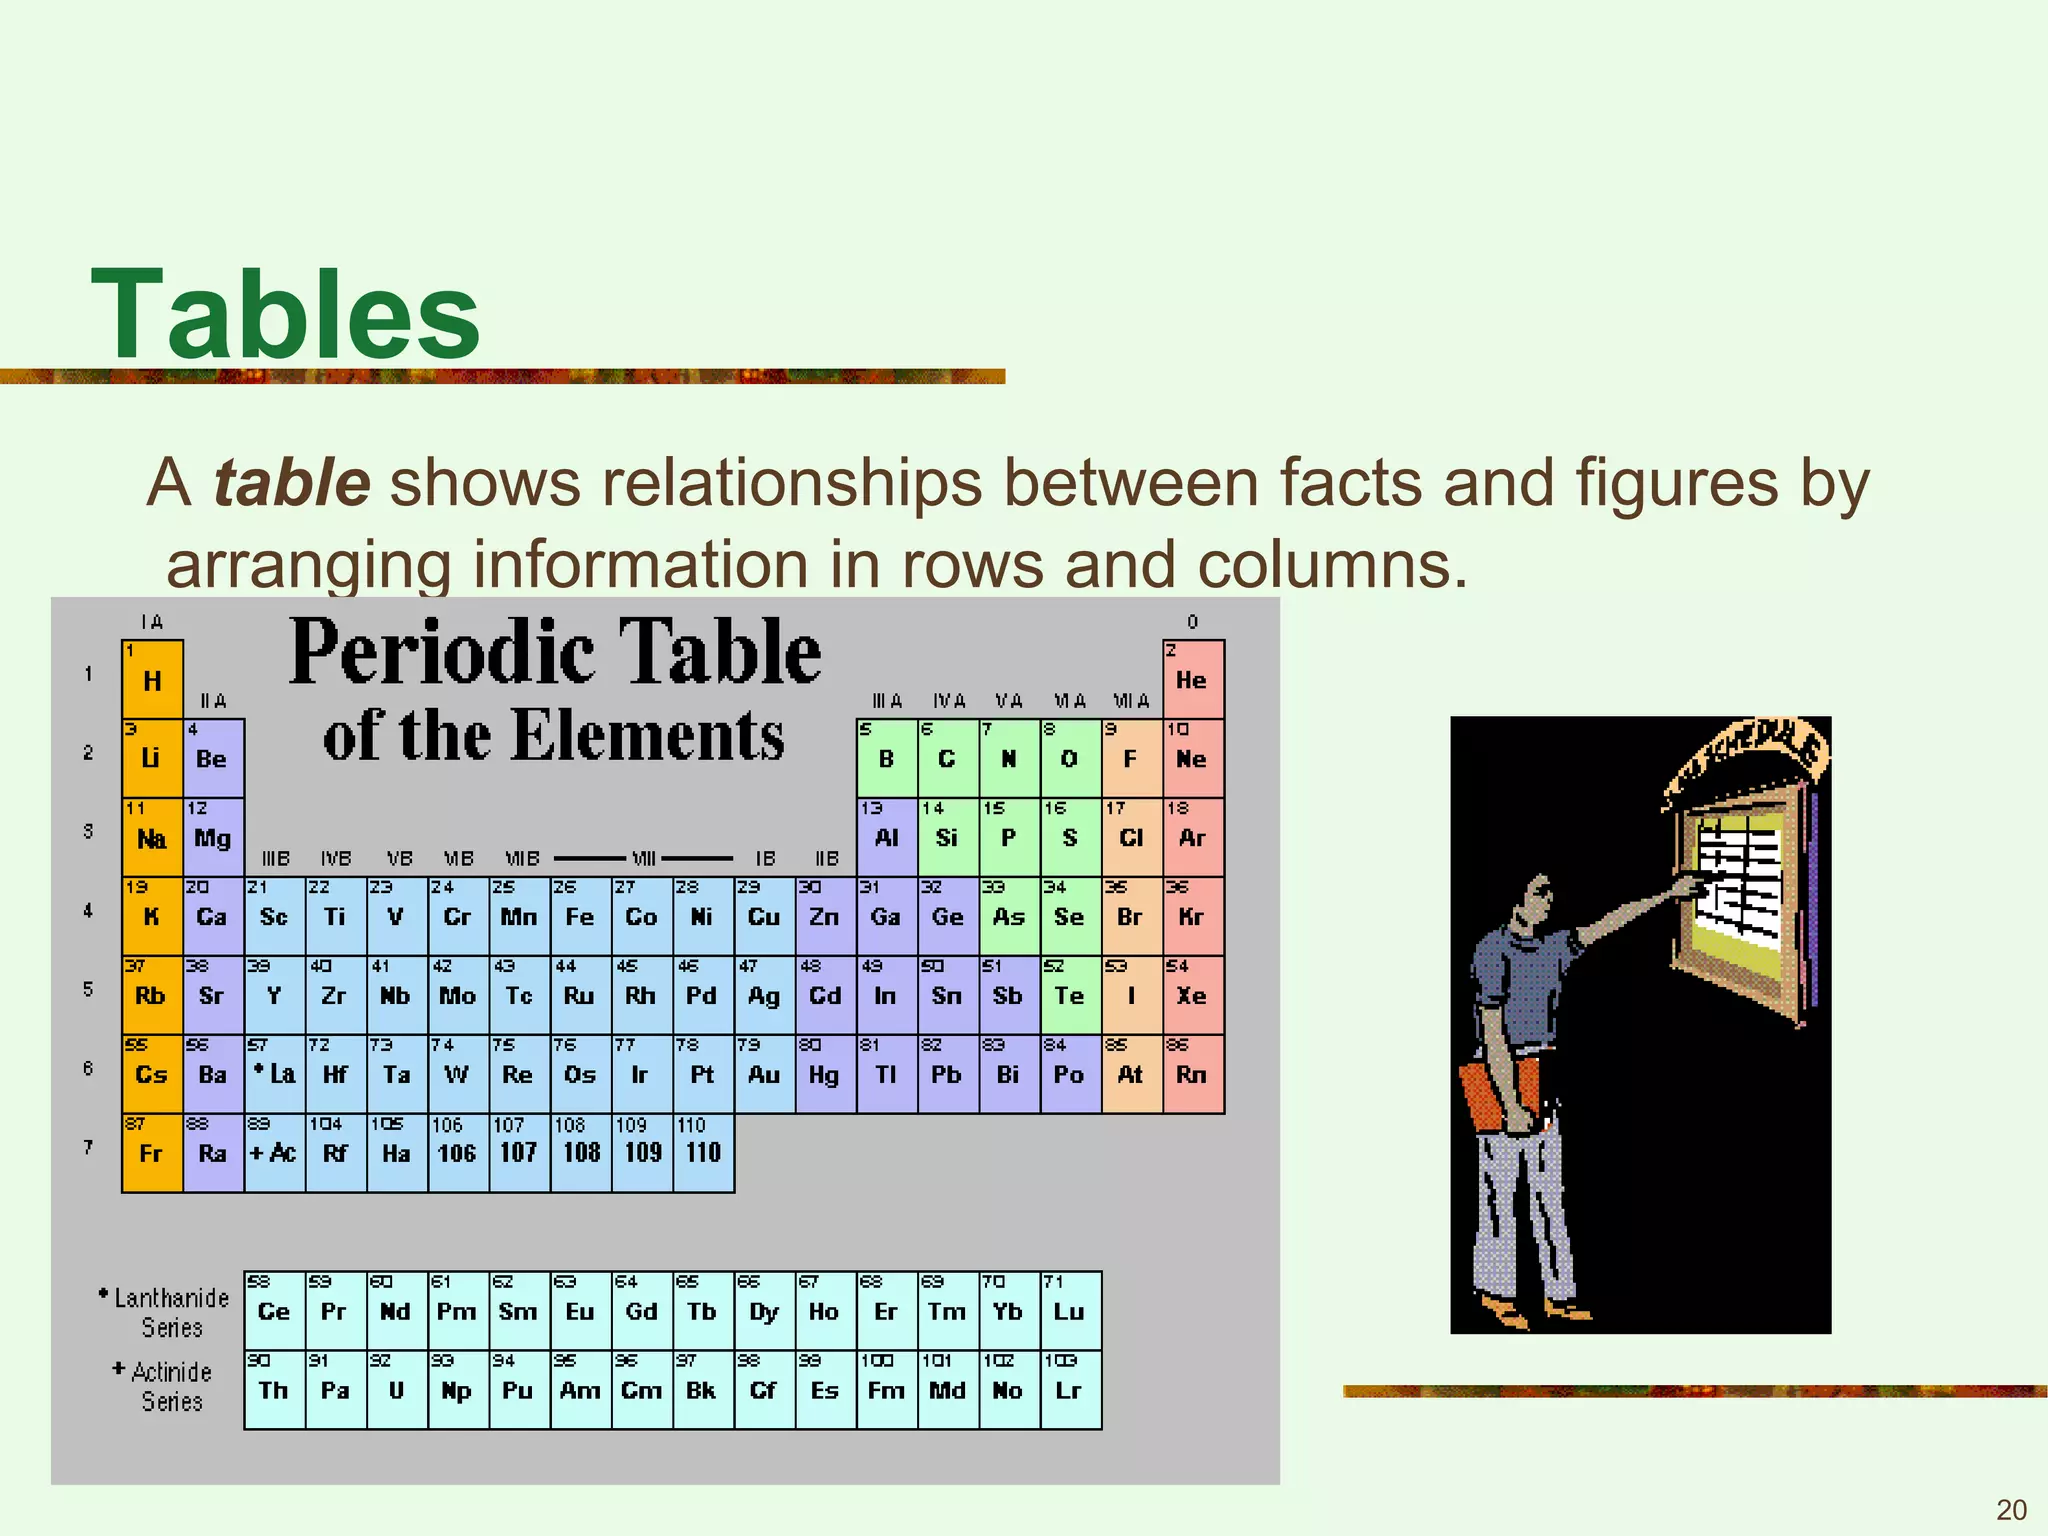
Tables organize relationships between facts and figures using rows and columns.
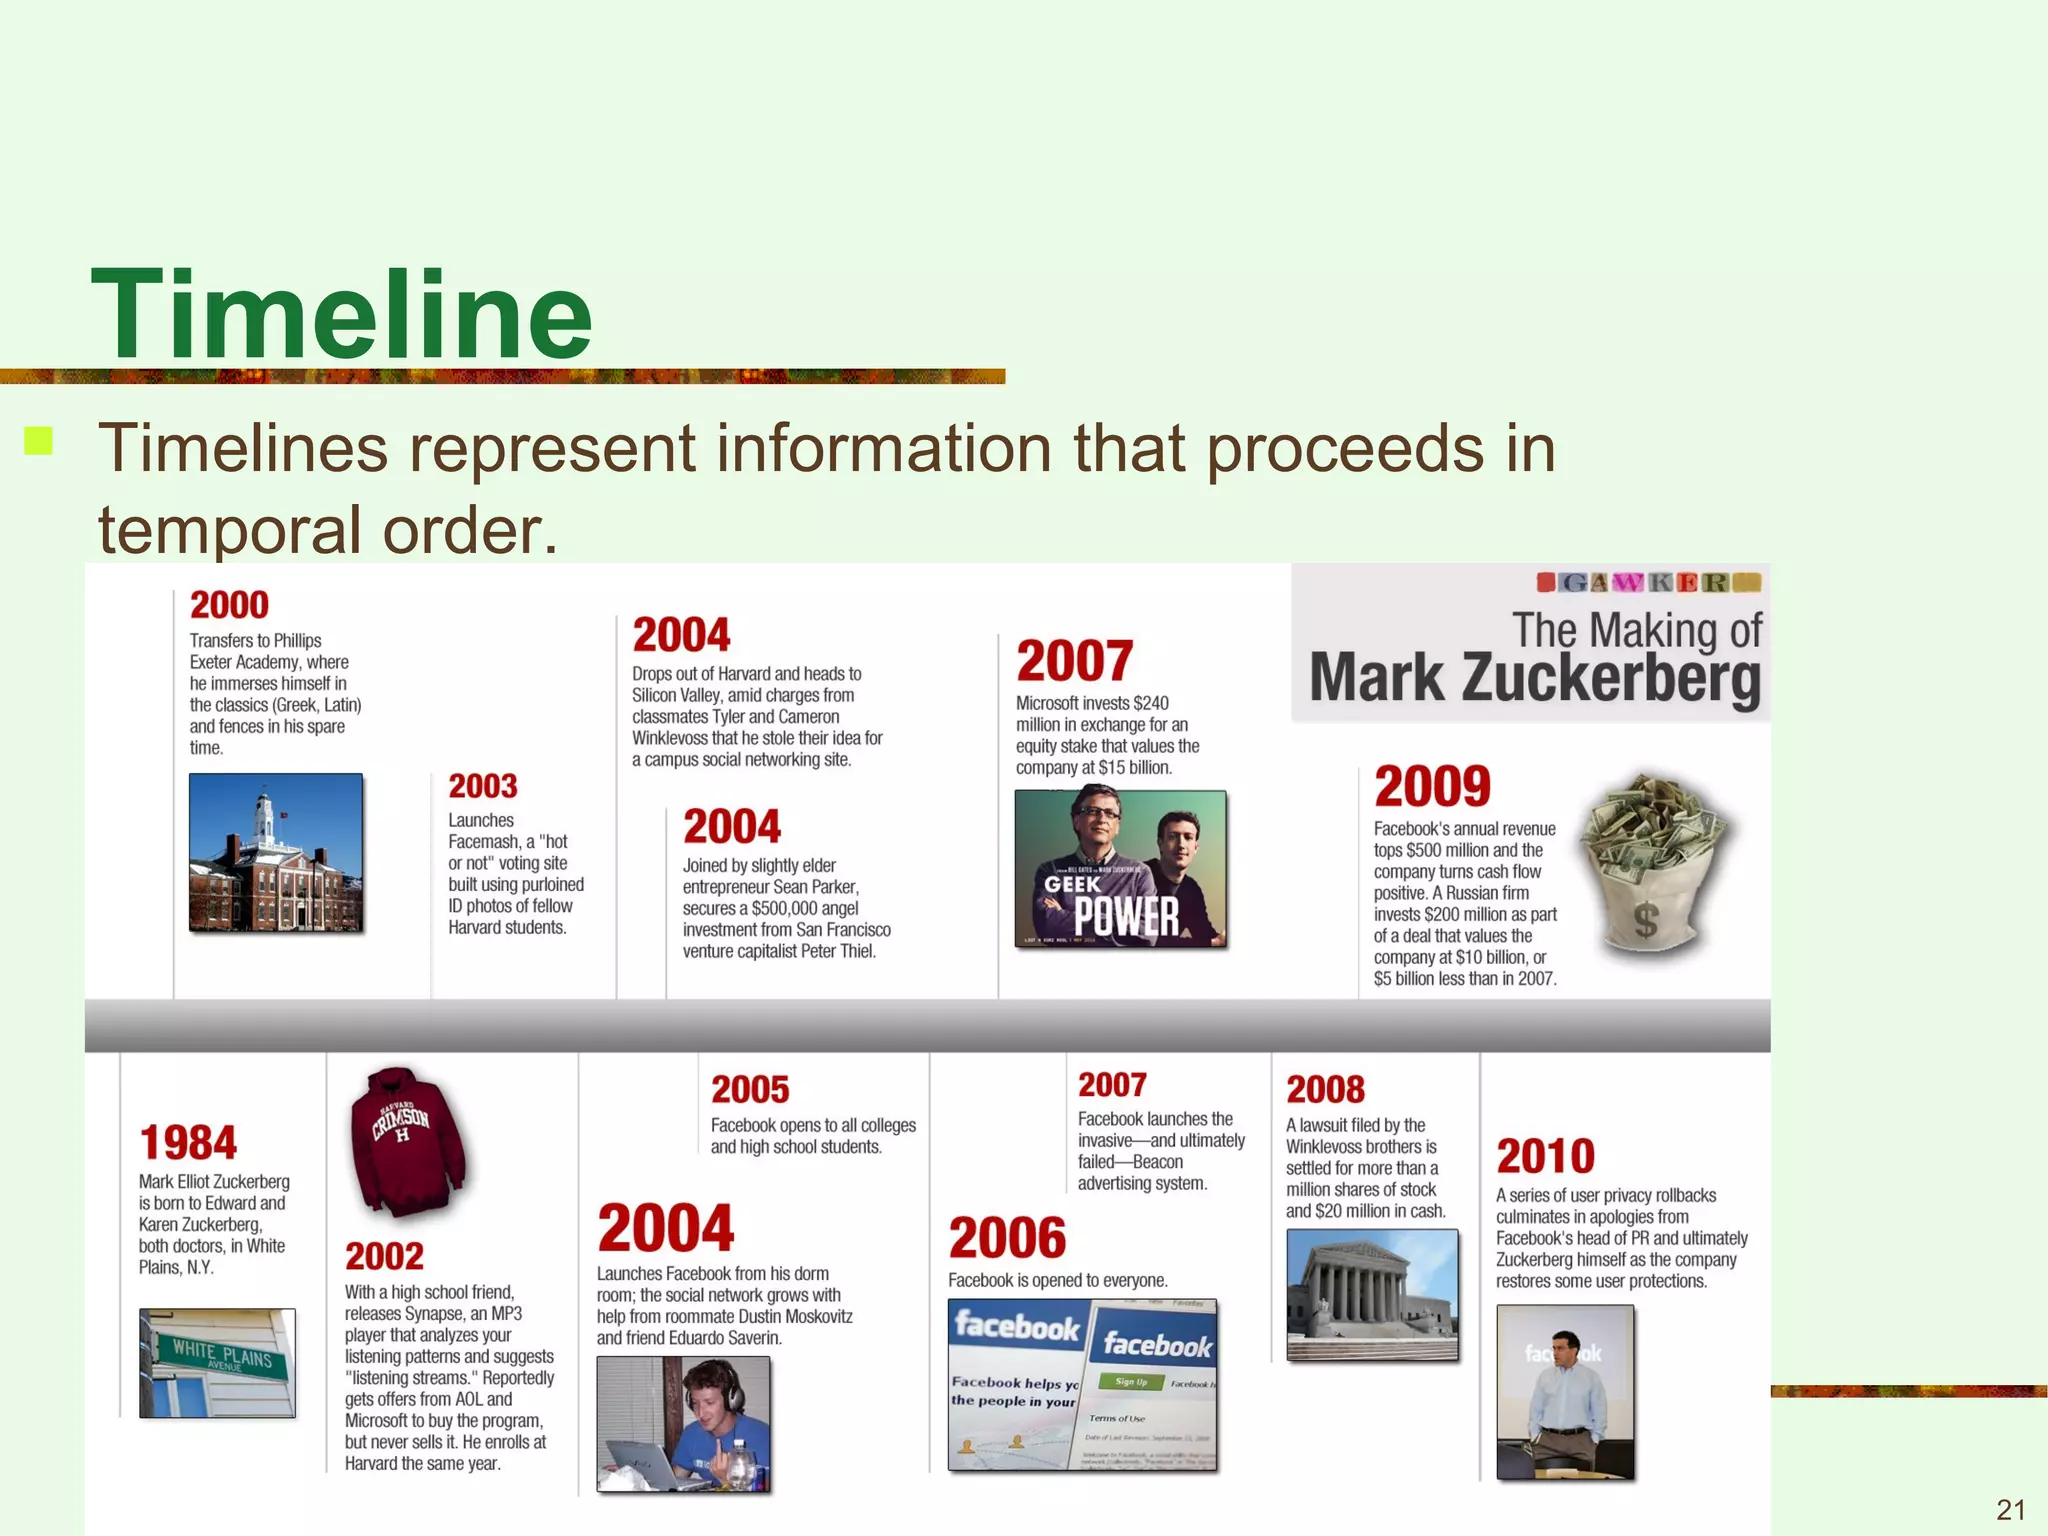
Timelines display events or information in chronological order.


![[READING AND WRITING SKILLS] Text as a Discourse - Introduction](https://cdn.slidesharecdn.com/ss_thumbnails/readingandwritingskills-effectivereadingstrategies-contextclues-161203130951-thumbnail.jpg?width=640&height=640&fit=bounds)


