The document discusses graphing rational functions of the form f(x) = a(x)/b(x), where a(x) and b(x) are polynomial functions. It provides examples of how the graphs appear depending on whether the degree of the numerator is even or odd. A 7-step process is outlined for sketching the graphs, which involves finding intercepts, roots, vertical asymptotes, horizontal asymptotes, and the sign of the function to sketch the graph. Two examples applying the 7-step method are shown.
January 19, 2010
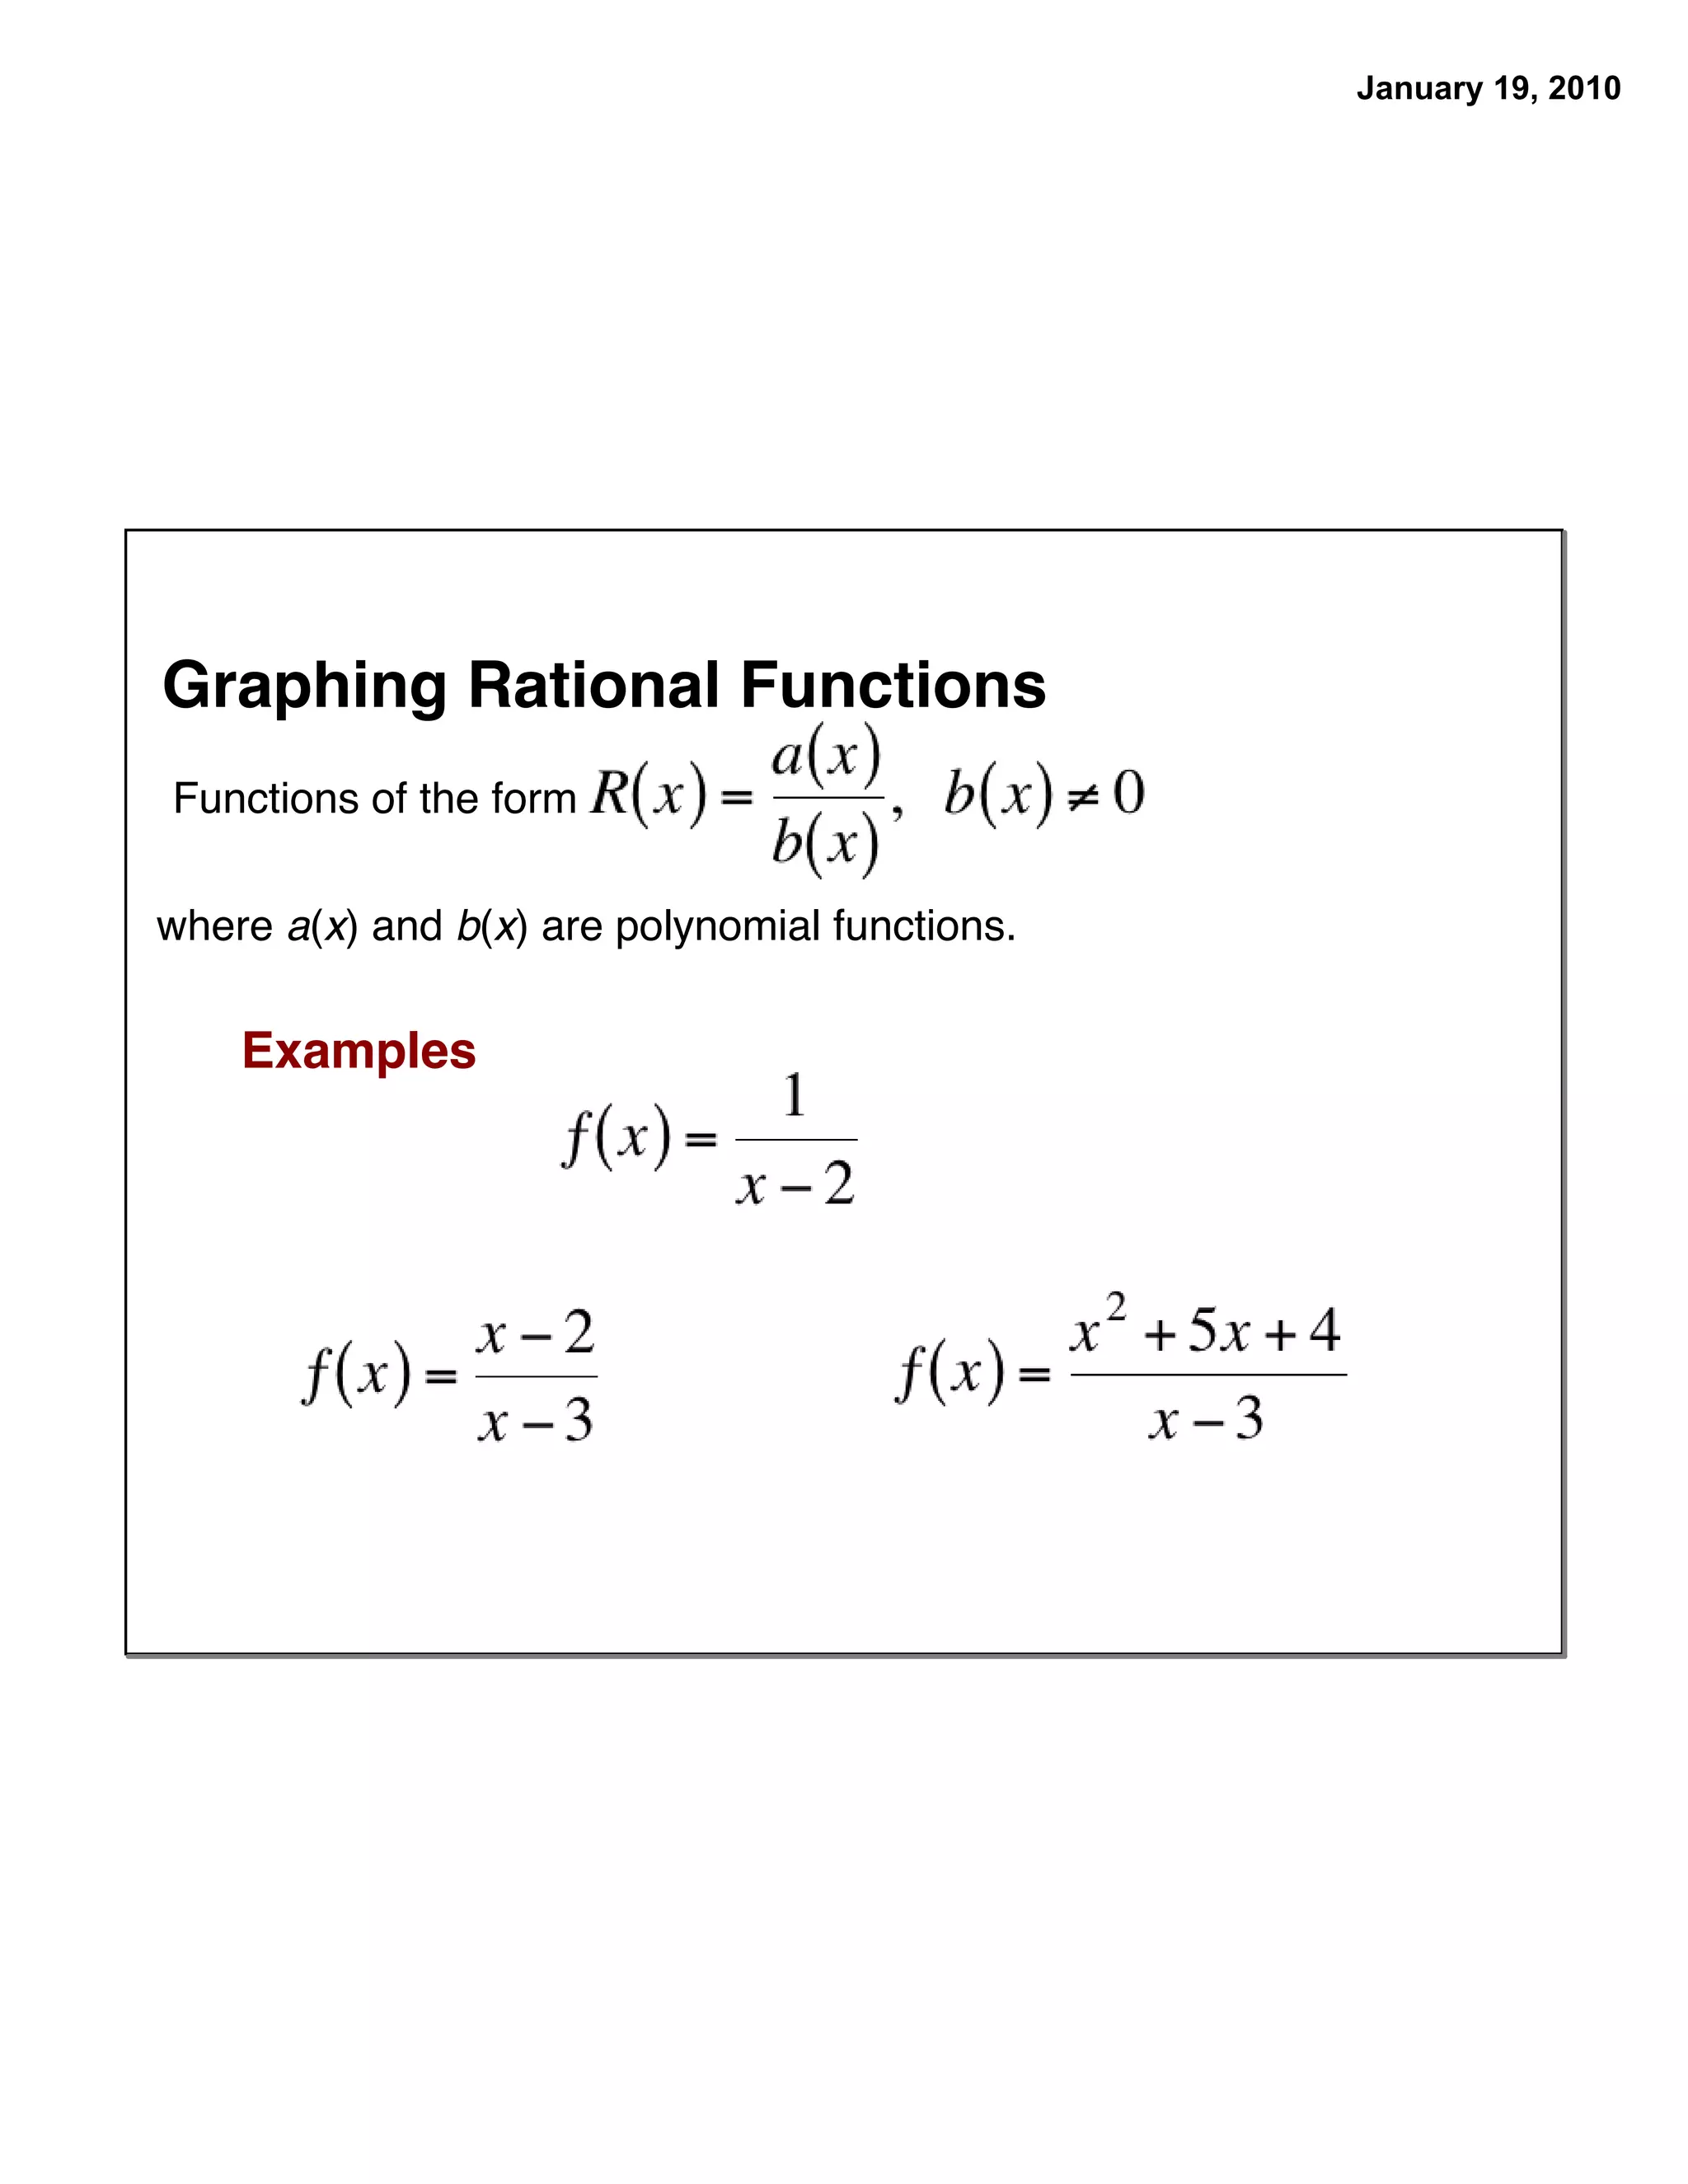
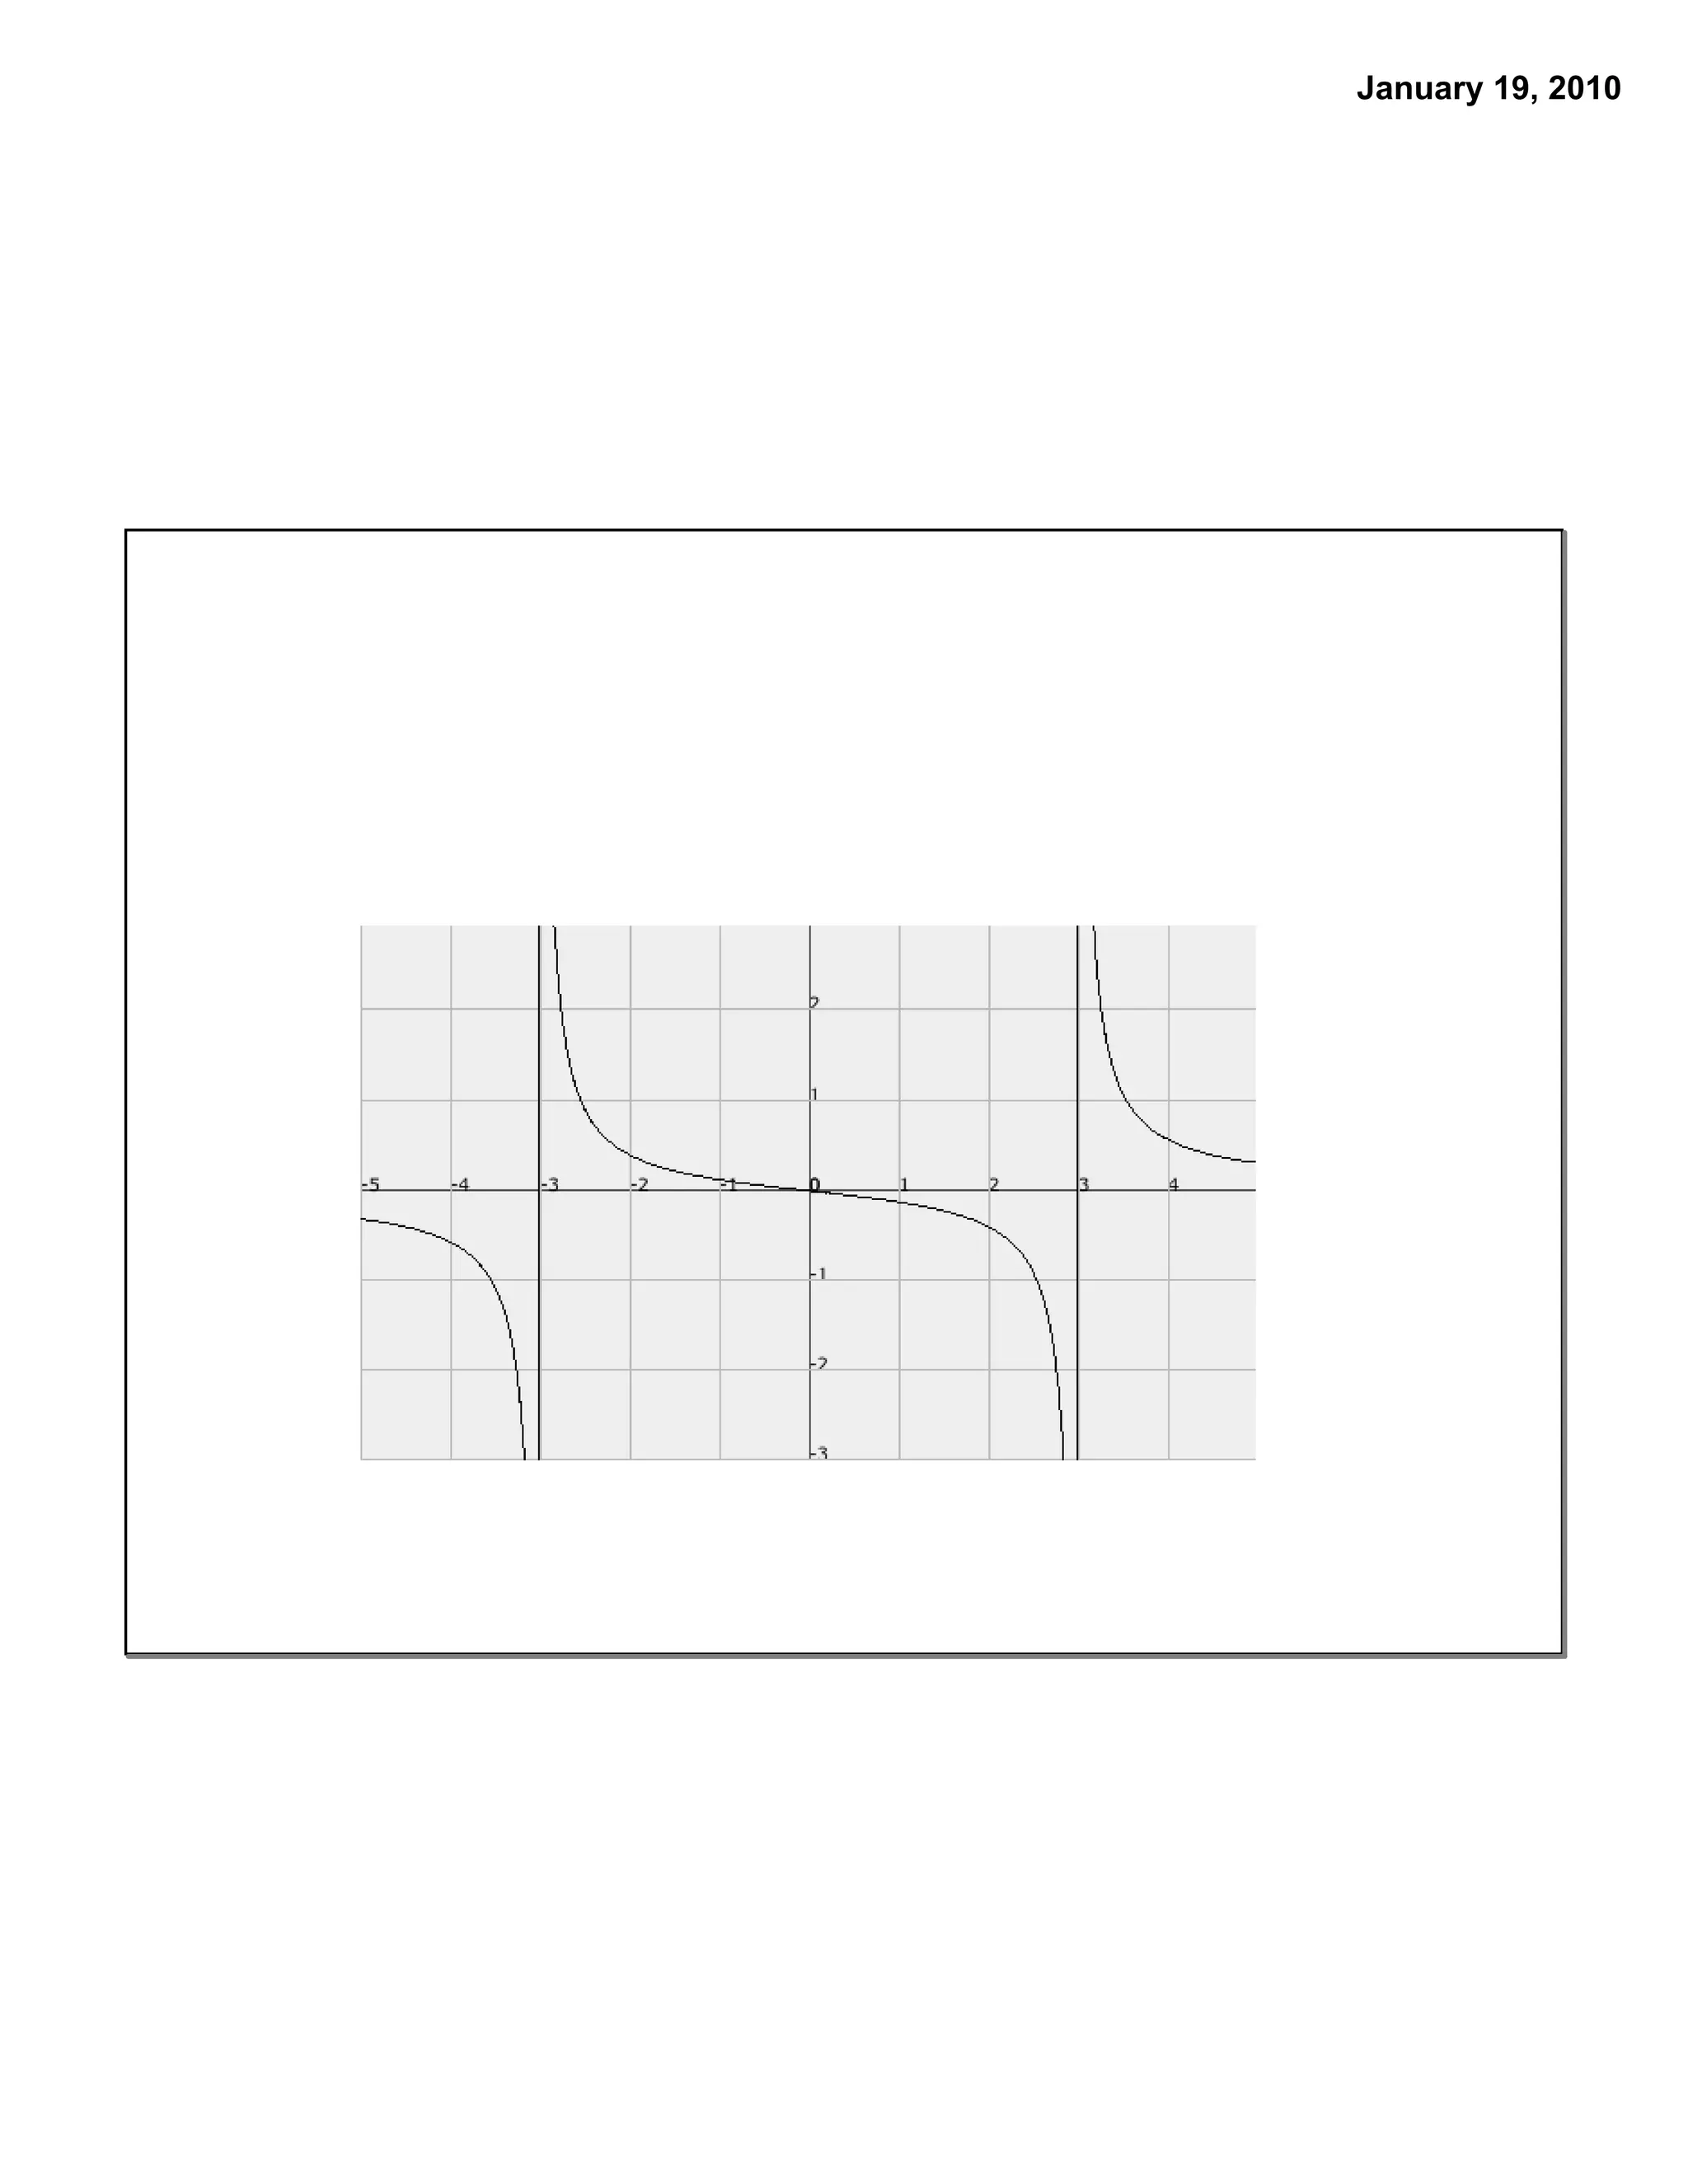
GraphingRational Functions
Functions of the form
where a(x) and b(x) are polynomial functions.
Examples
2.
January 19, 2010
GraphingRational Functions
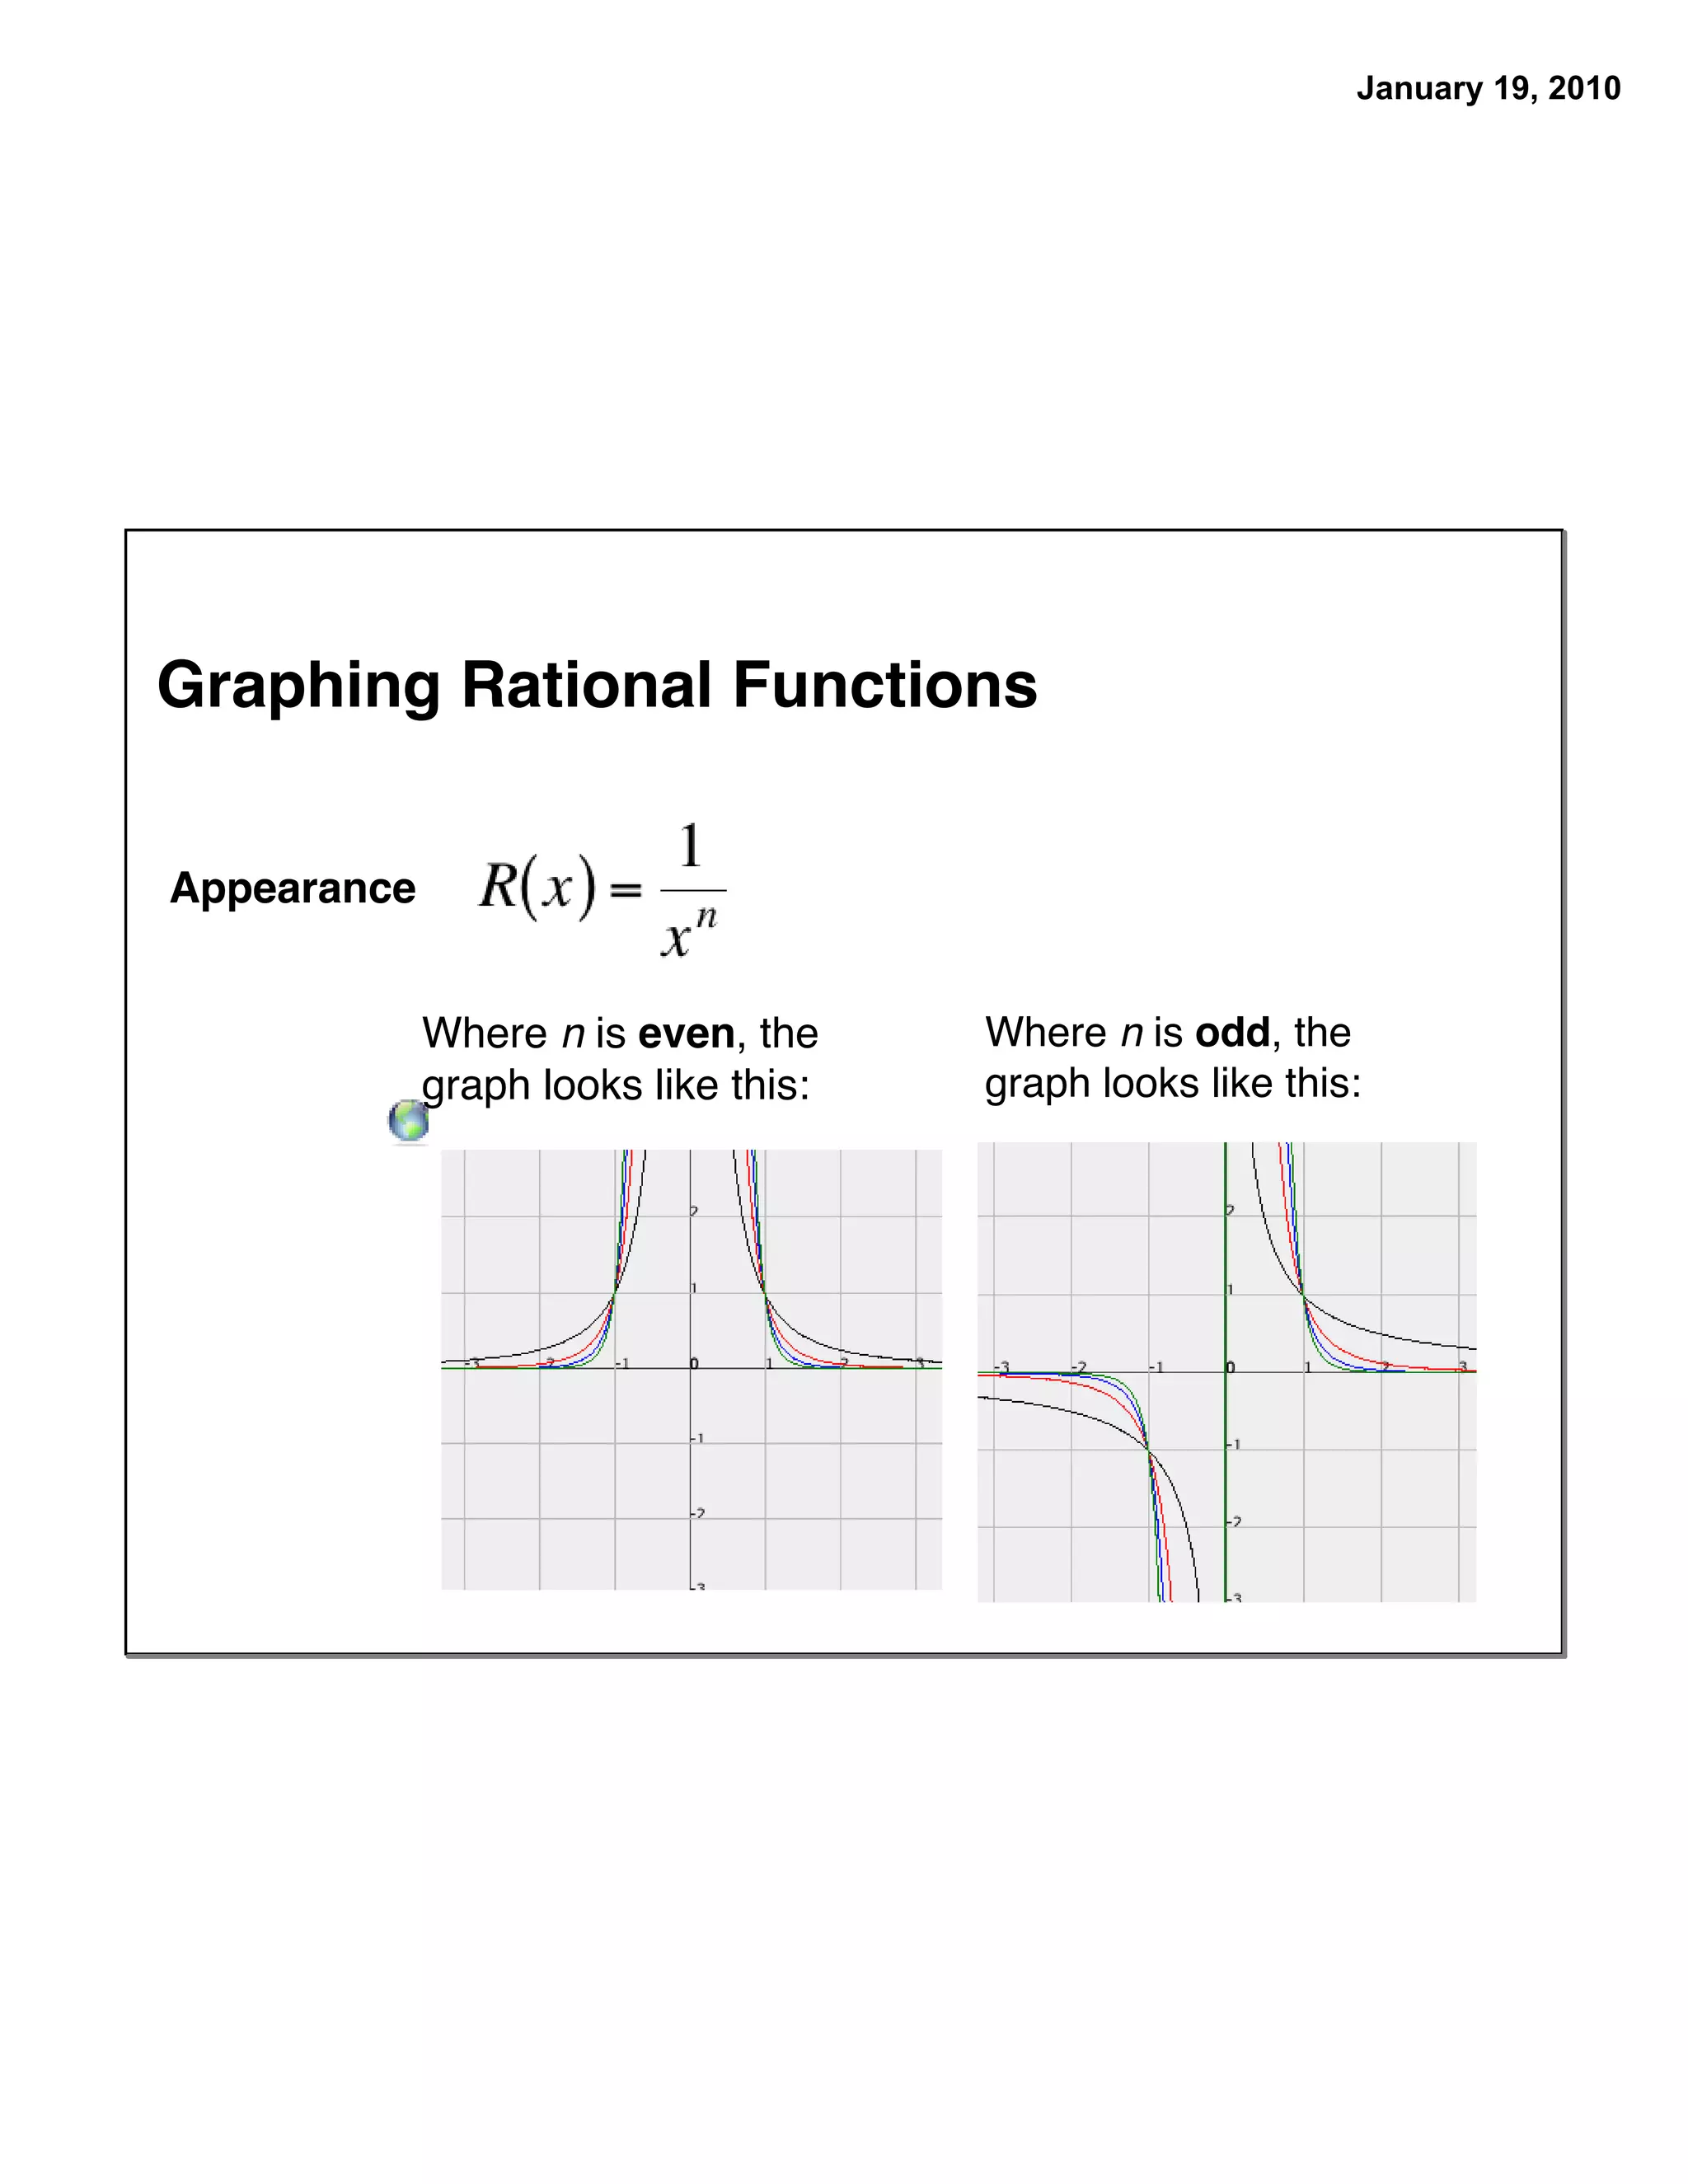
Appearance
Where n is even, the Where n is odd, the
graph looks like this: graph looks like this:
3.
January 19, 2010
GraphingRational Functions
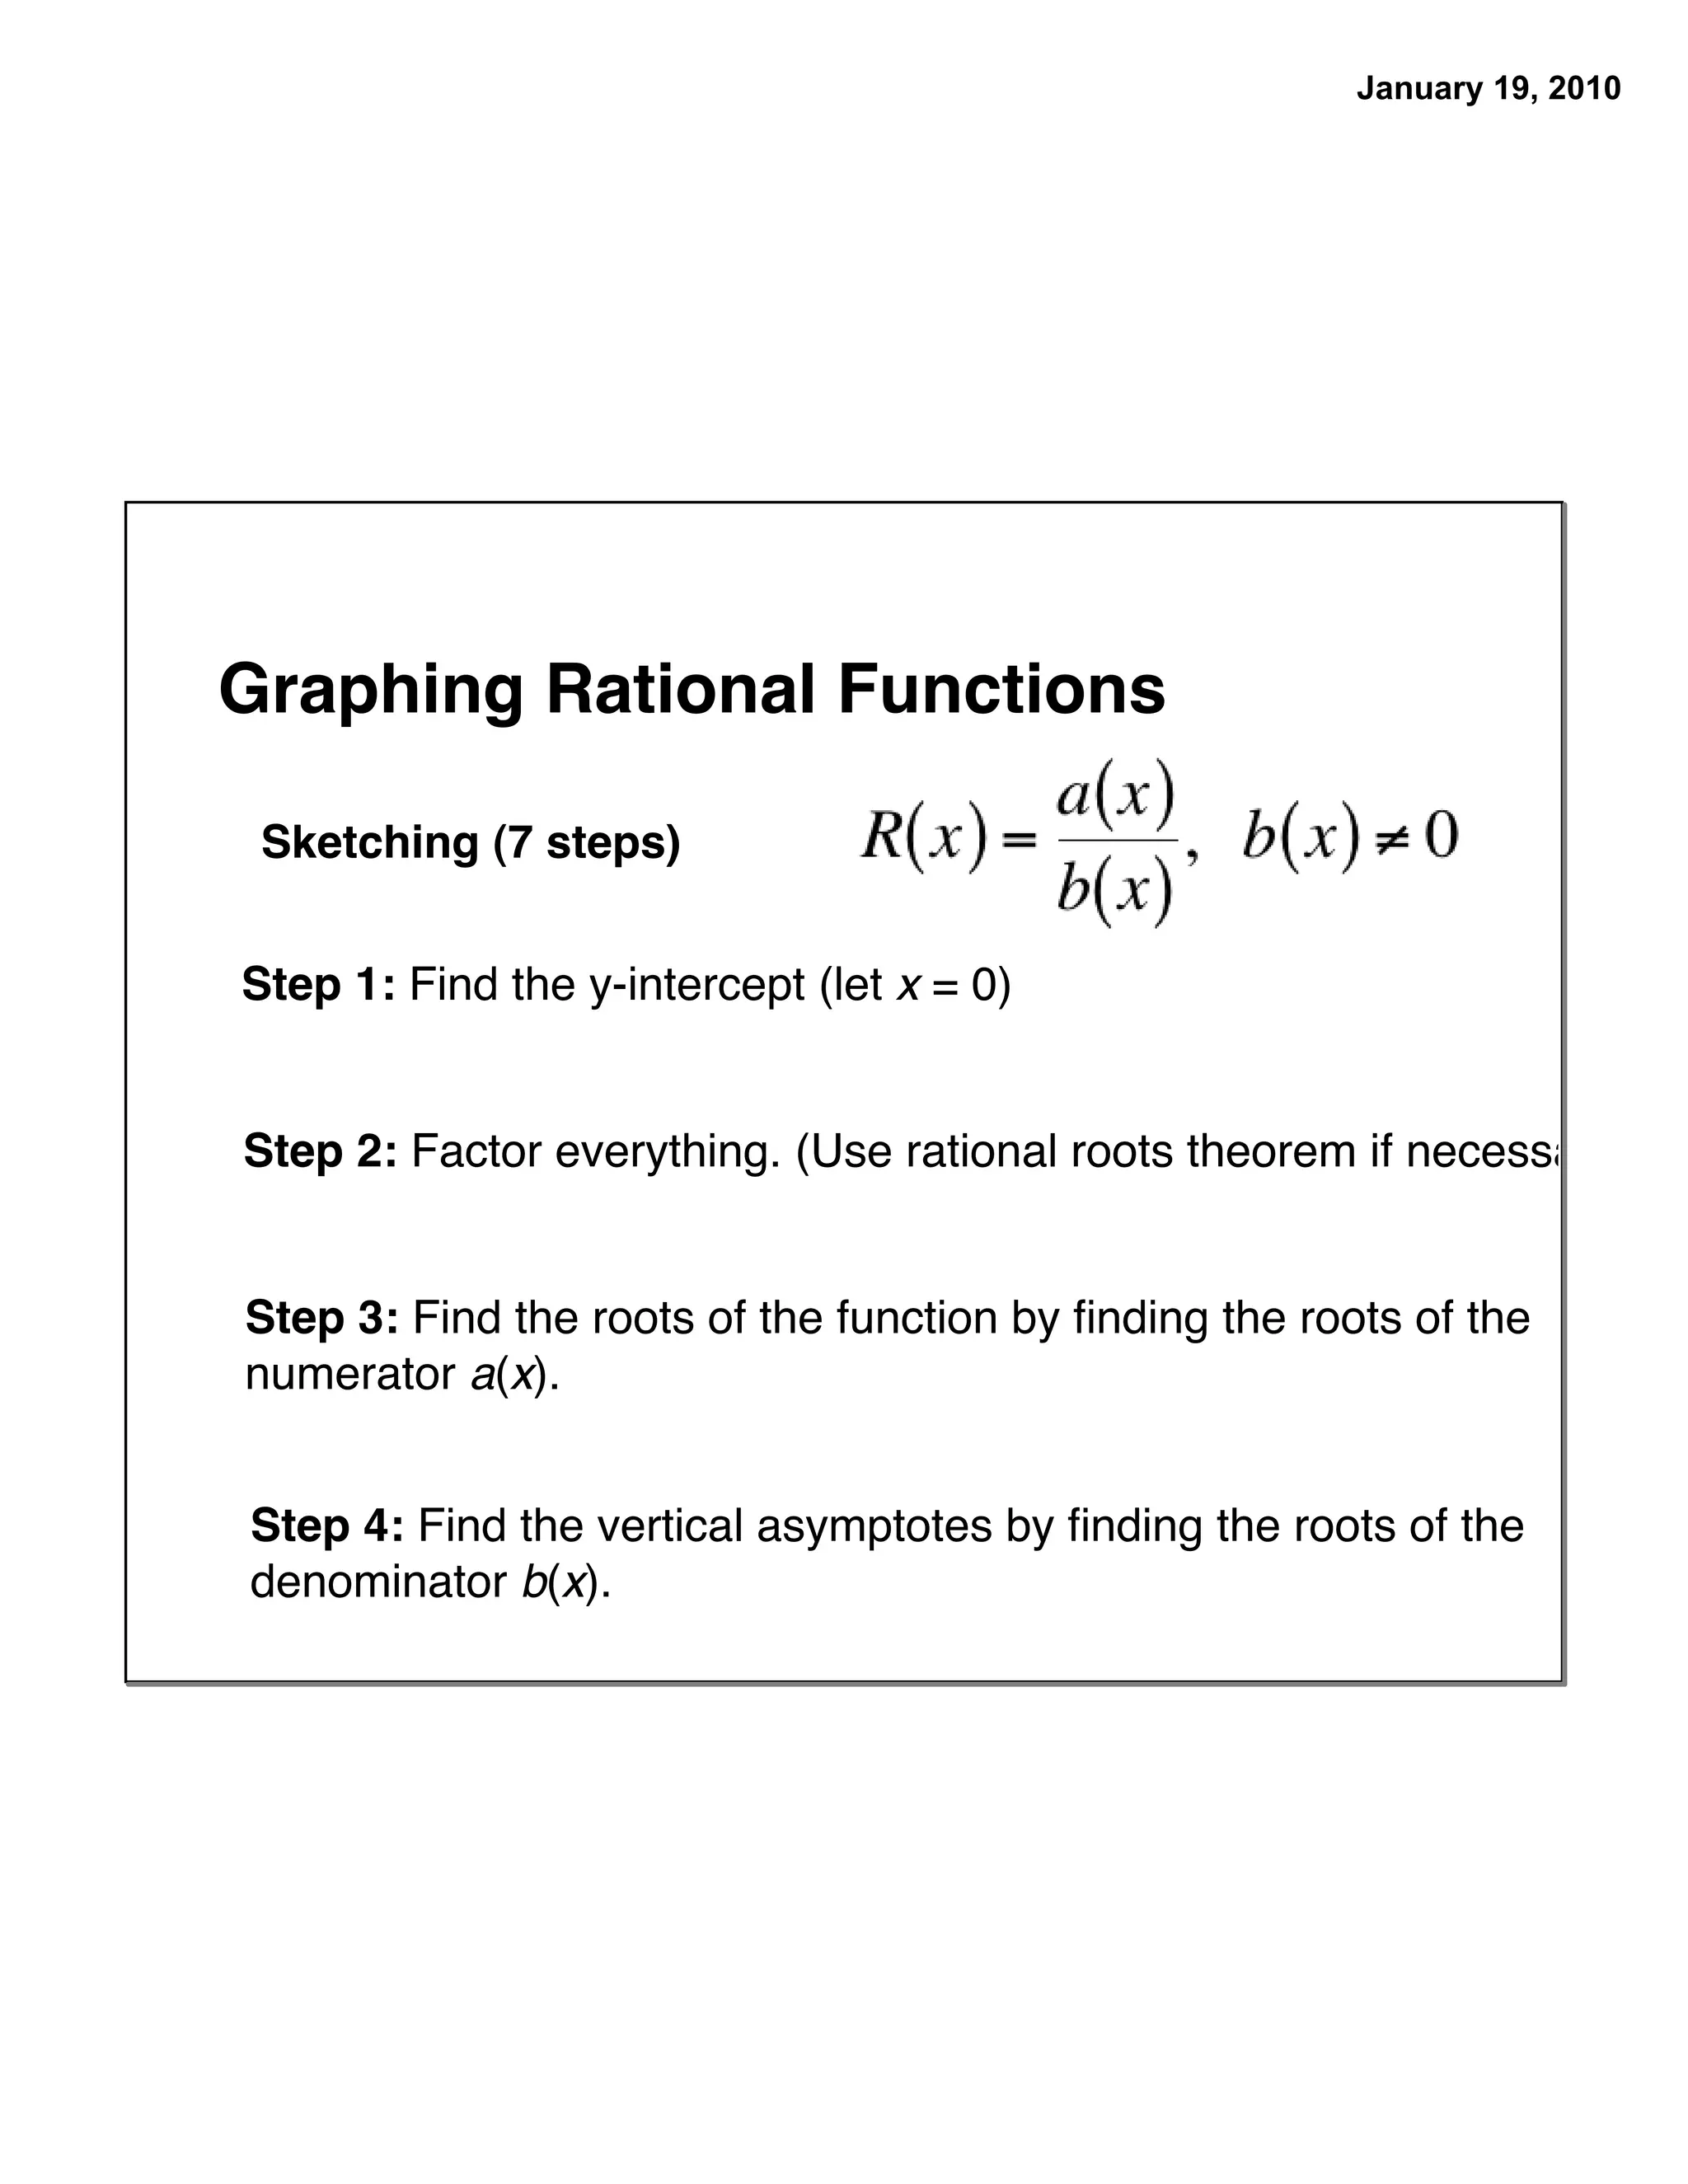
Sketching (7 steps)
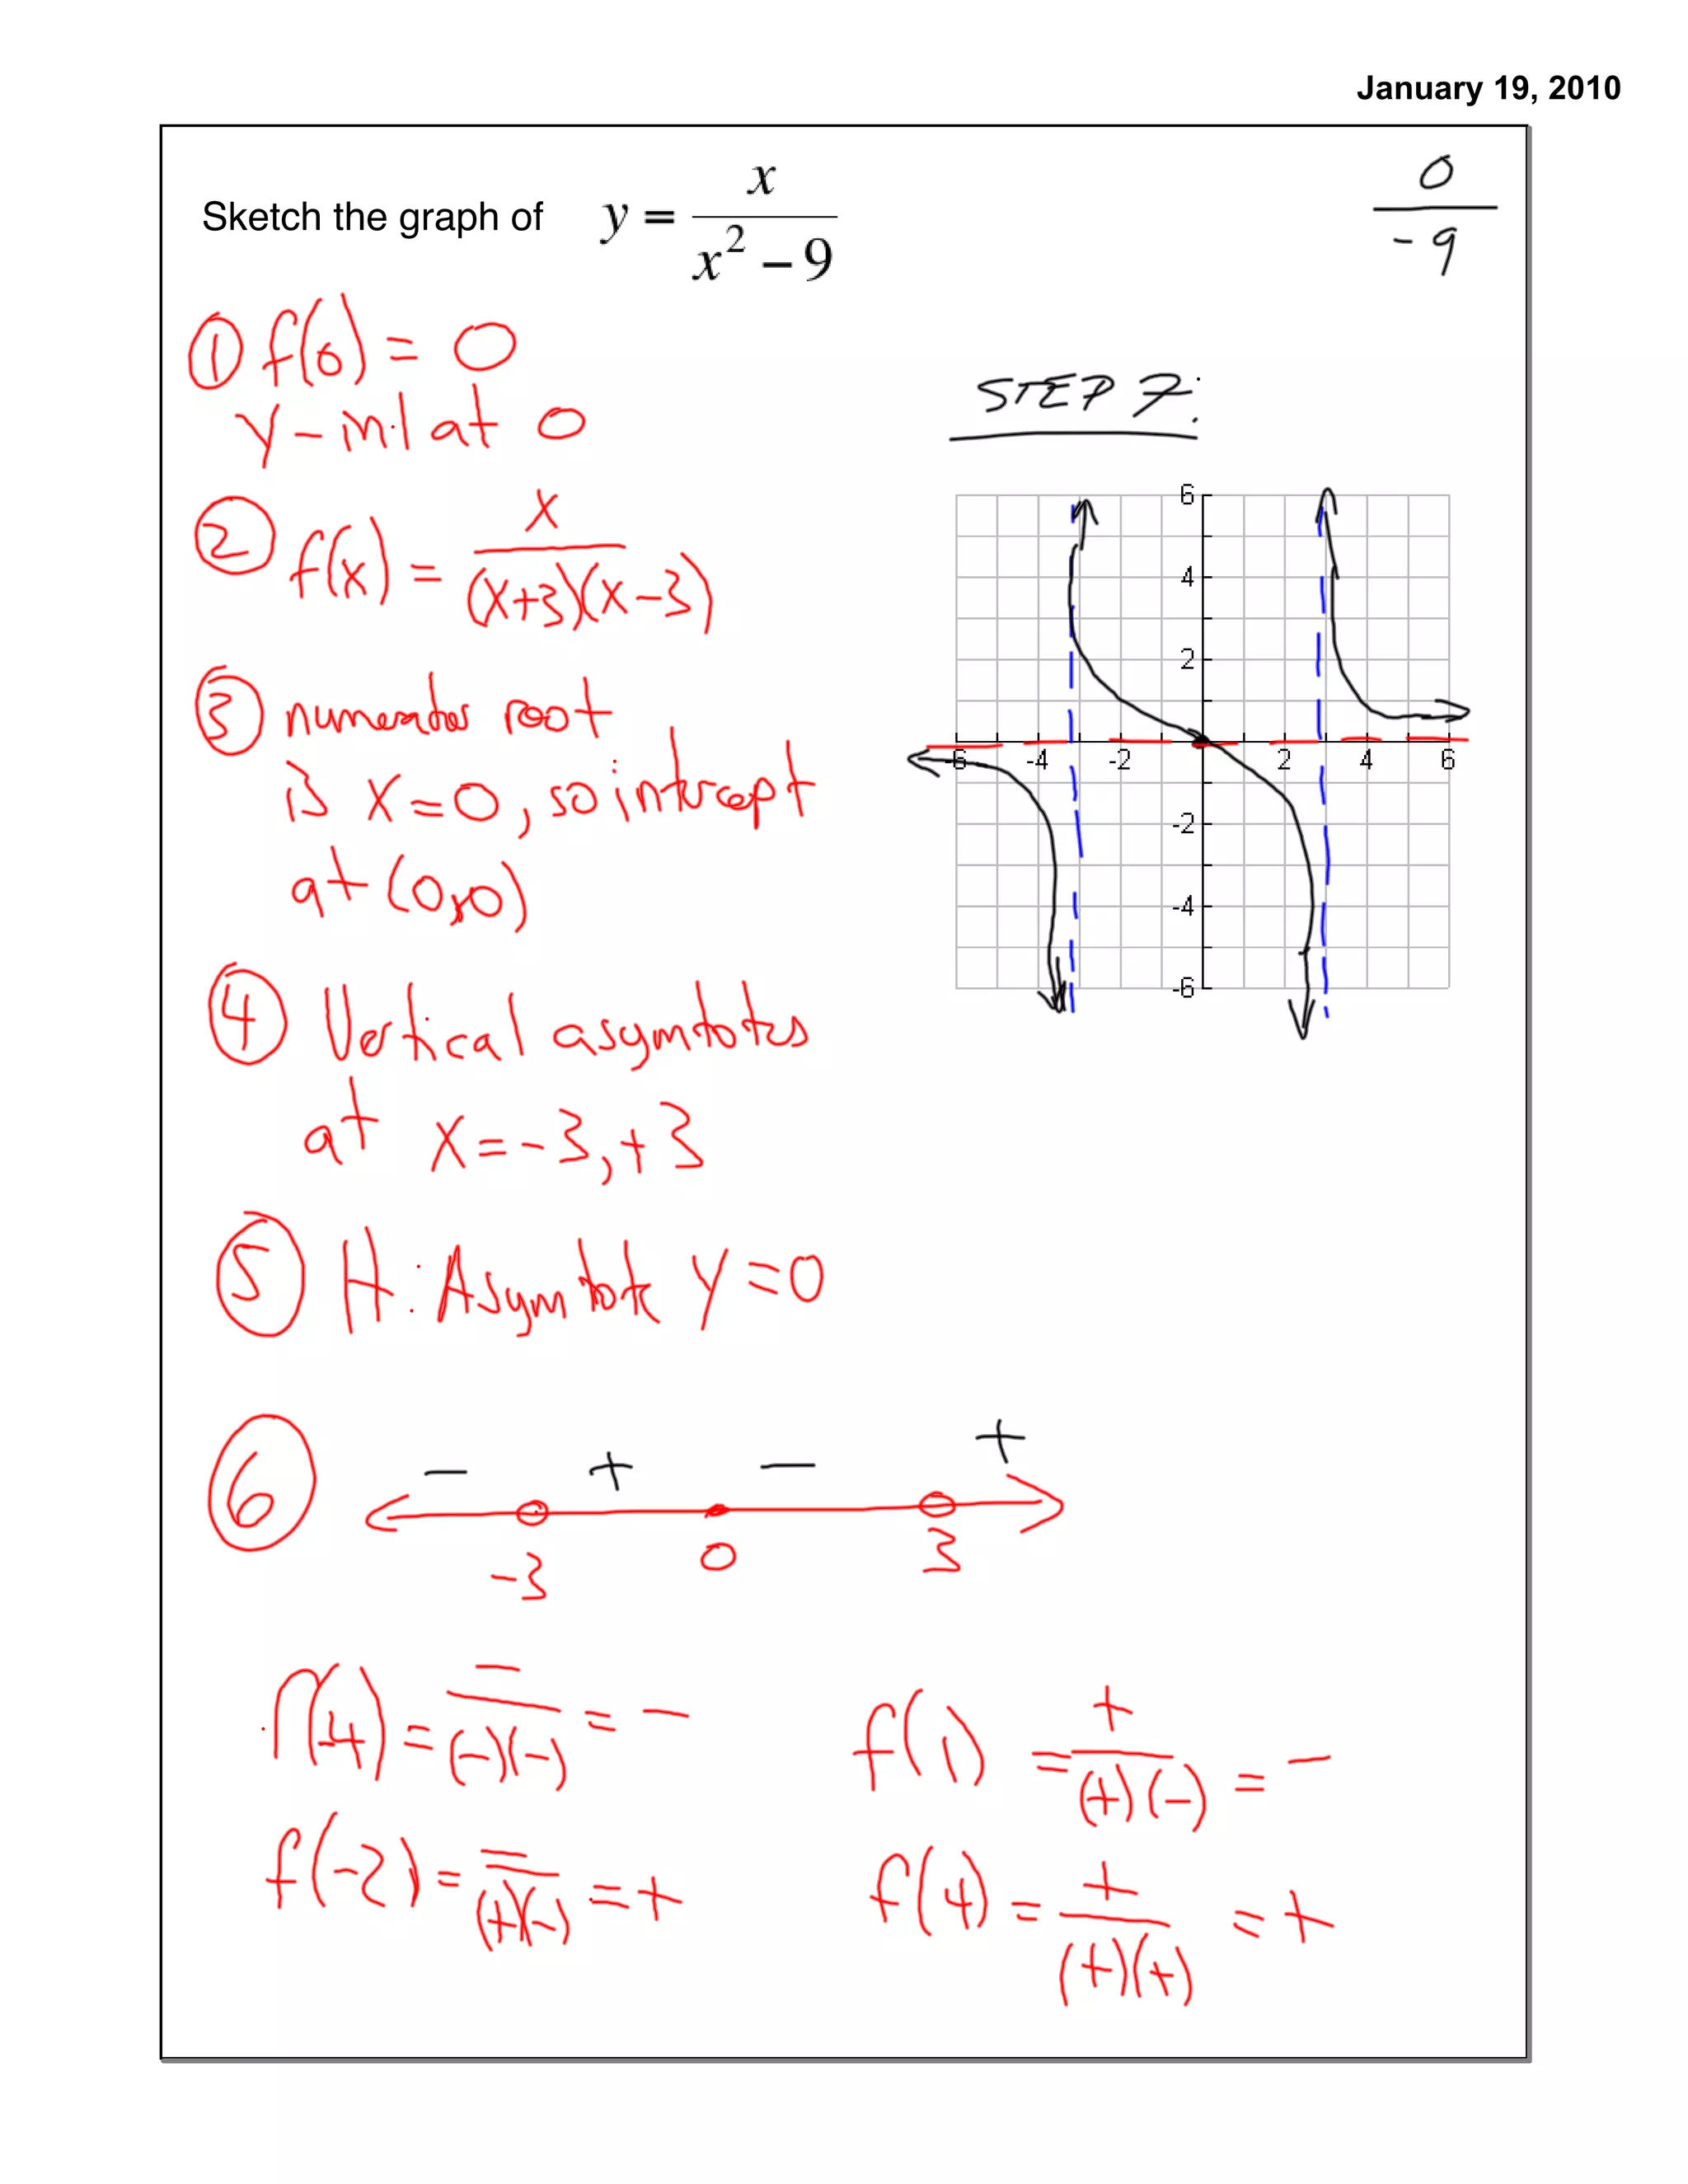
Step 1: Find the y-intercept (let x = 0)
Step 2: Factor everything. (Use rational roots theorem if necessary.)
Step 3: Find the roots of the function by finding the roots of the
numerator a(x).
Step 4: Find the vertical asymptotes by finding the roots of the
denominator b(x).
4.
January 19, 2010
GraphingRational Functions
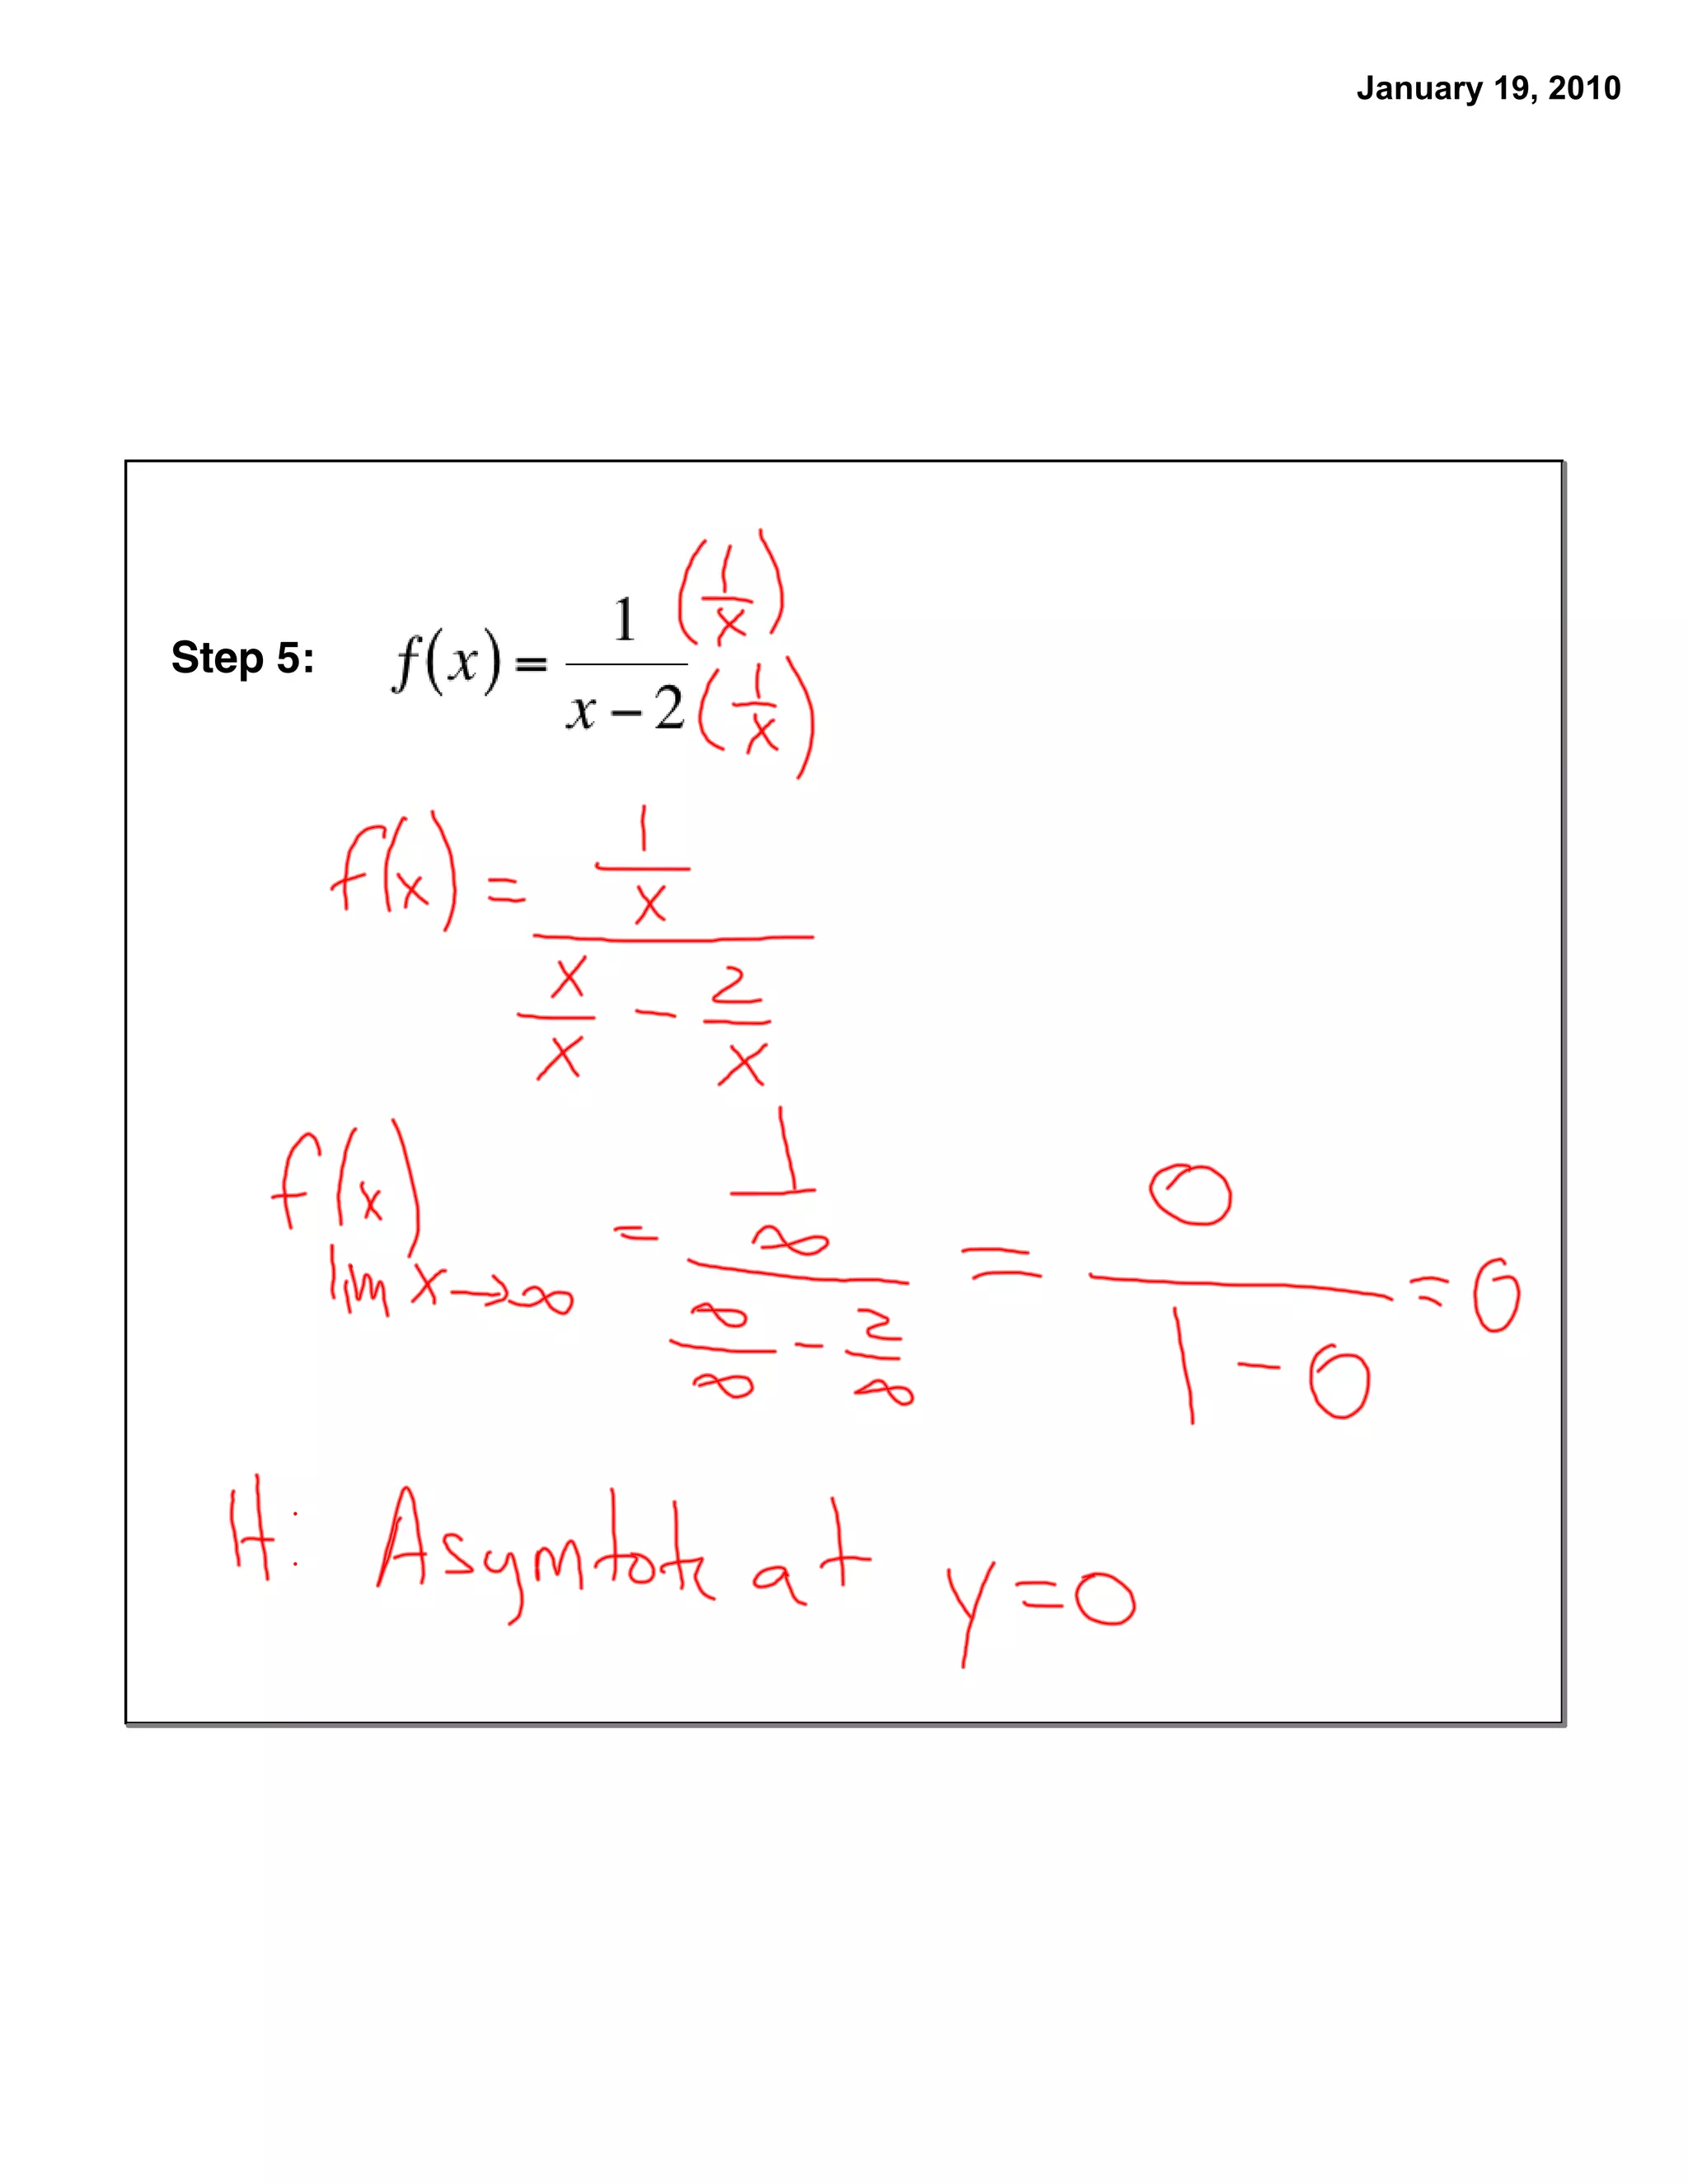
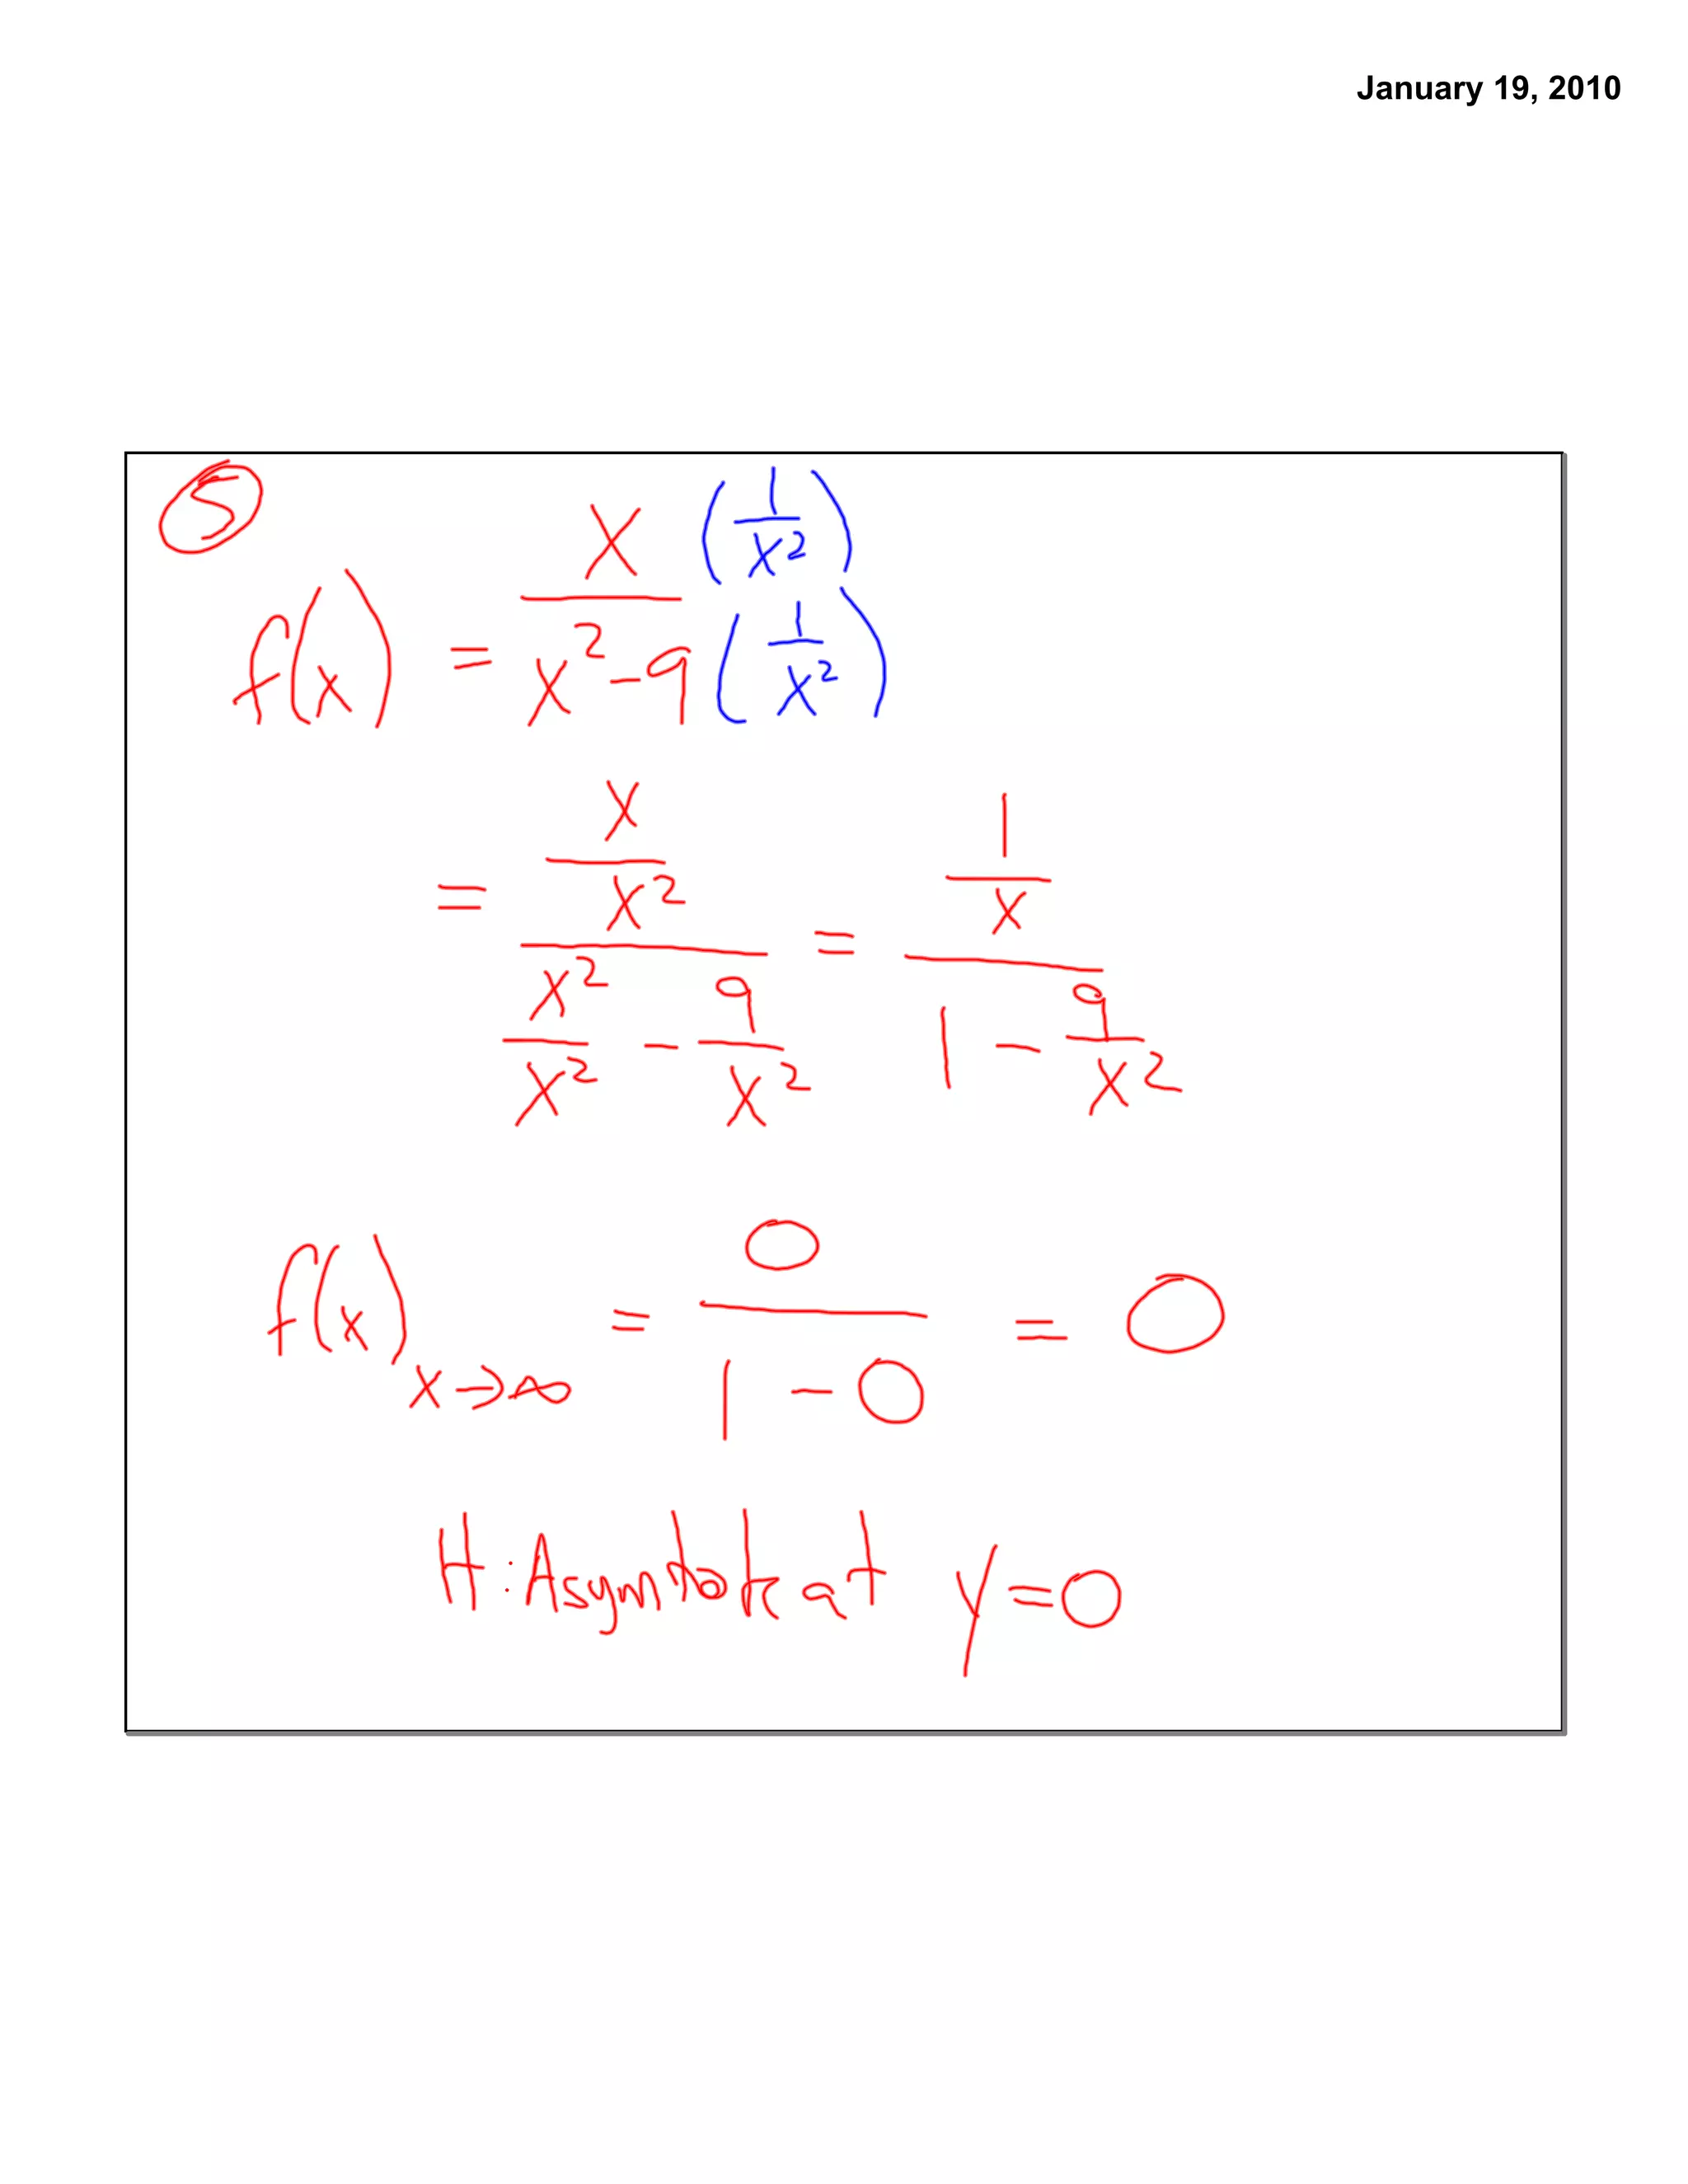
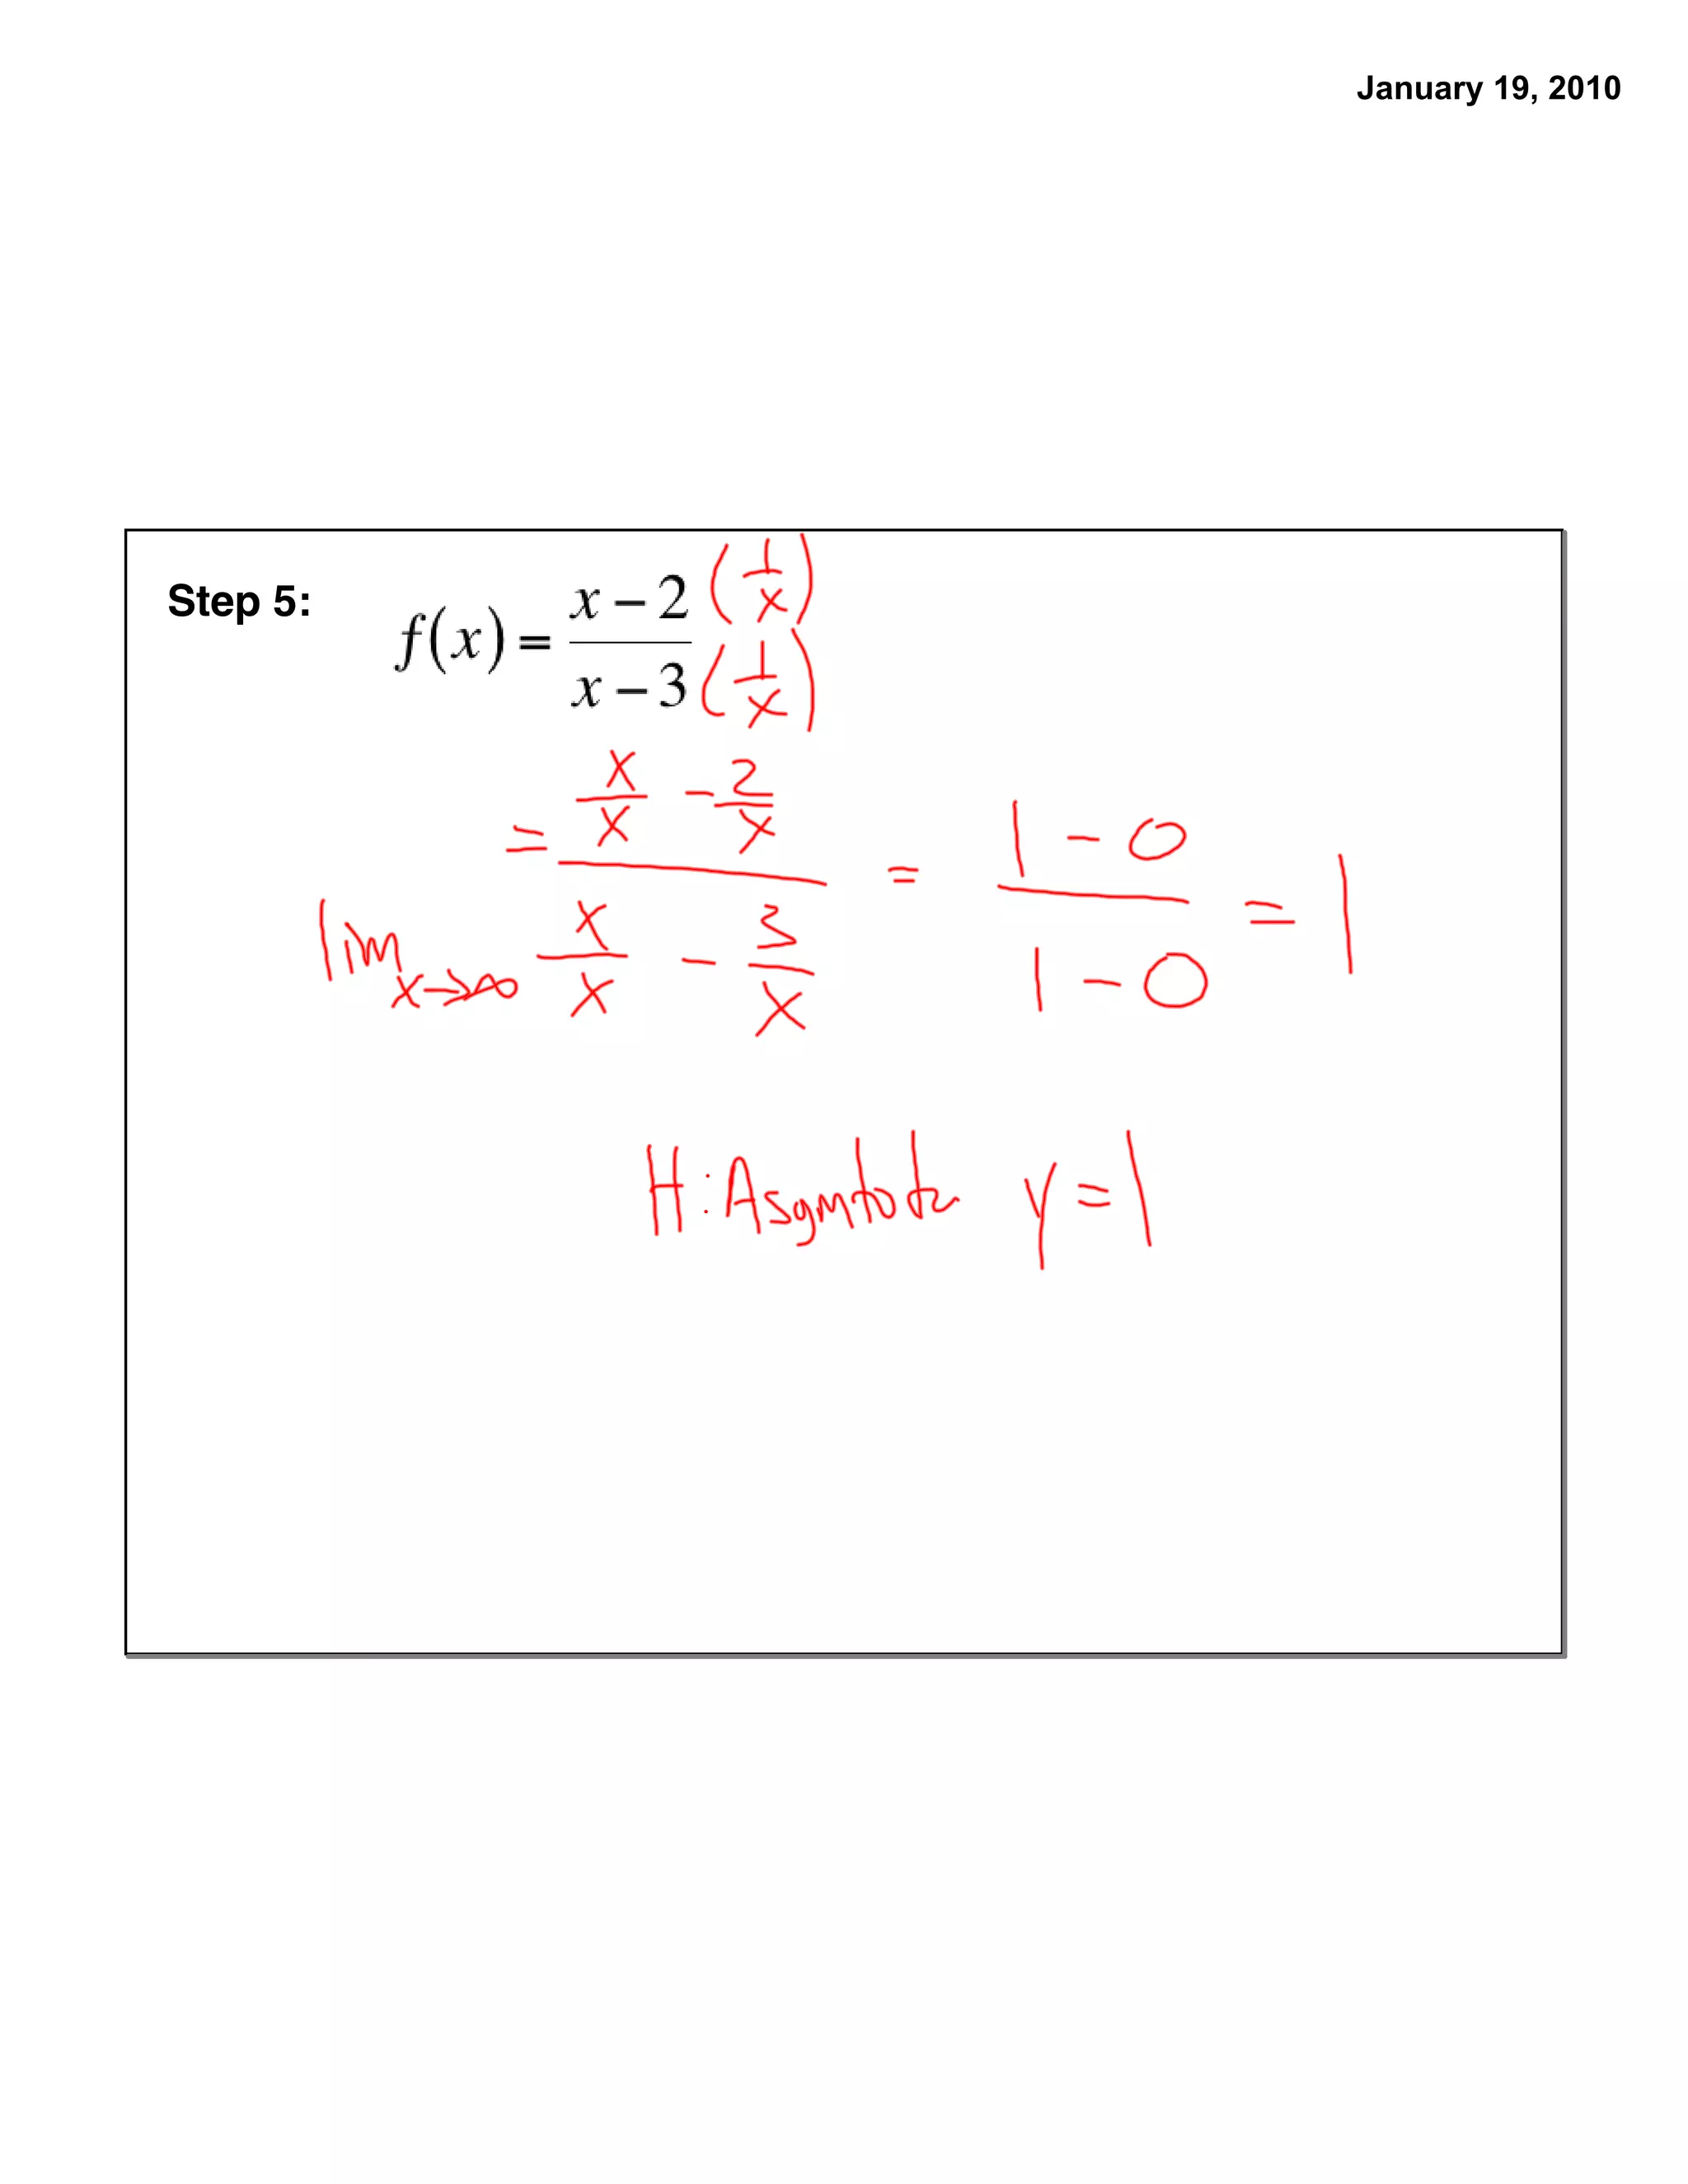
Step 5: Find the horizontal asymptotes by dividing each term in the
function by the highest power of x, and take the limit as x goes to infinity.
(Use the UNfactored form.)
You will find that, in general, there are three possible results:
i When [degree of numerator < degree of denominator]
the horizontal asymptote is y = 0.
ii When [degree of numerator = degree of denominator]
the H.A. is the ratio leading coefficient of a(x)
leading coefficient of b(x)
iii When [degree of numerator > degree of denominator] there is
no horizontal asymptote; however there may be a slant asymptote or
a hole in the graph.
5.
January 19, 2010
GraphingRational Functions
Sketching (7 steps)
Step 6: Determine the sign of the function over the intervals defined by
the roots and vertical asymptotes. (Use the factored form.)
Step 7: Sketch the graph.
6.
January 19, 2010
GraphingRational Functions
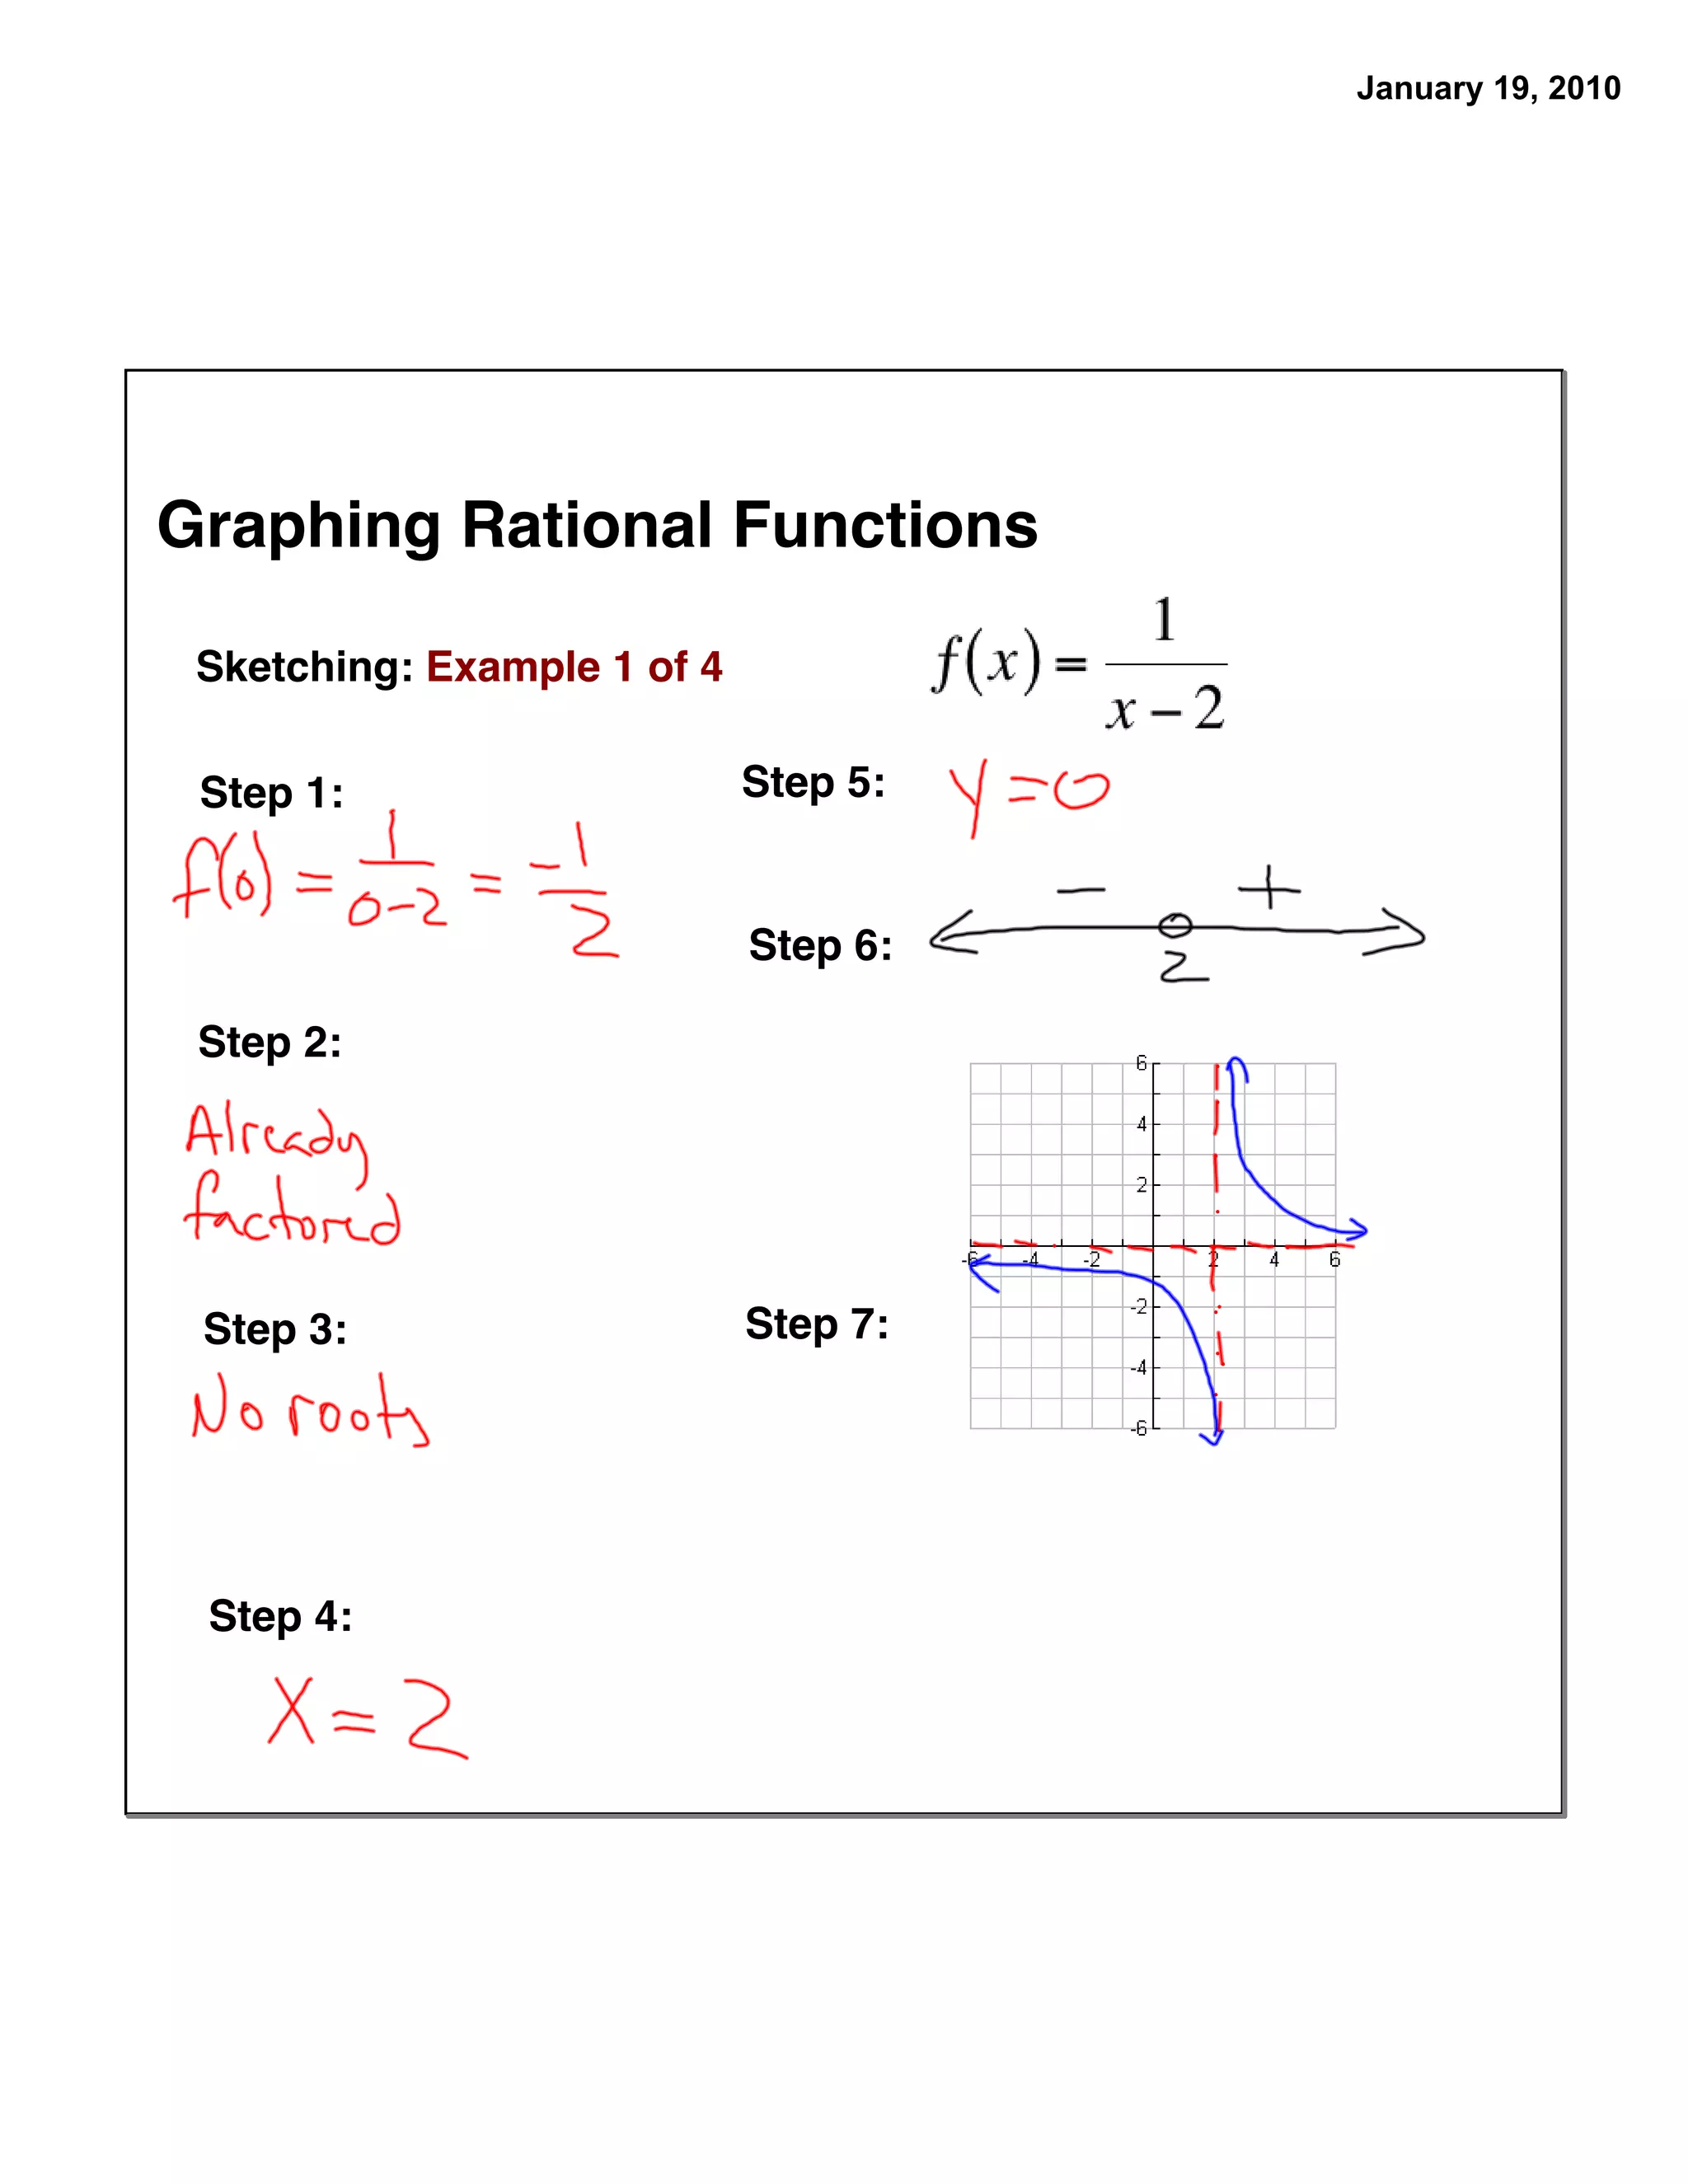
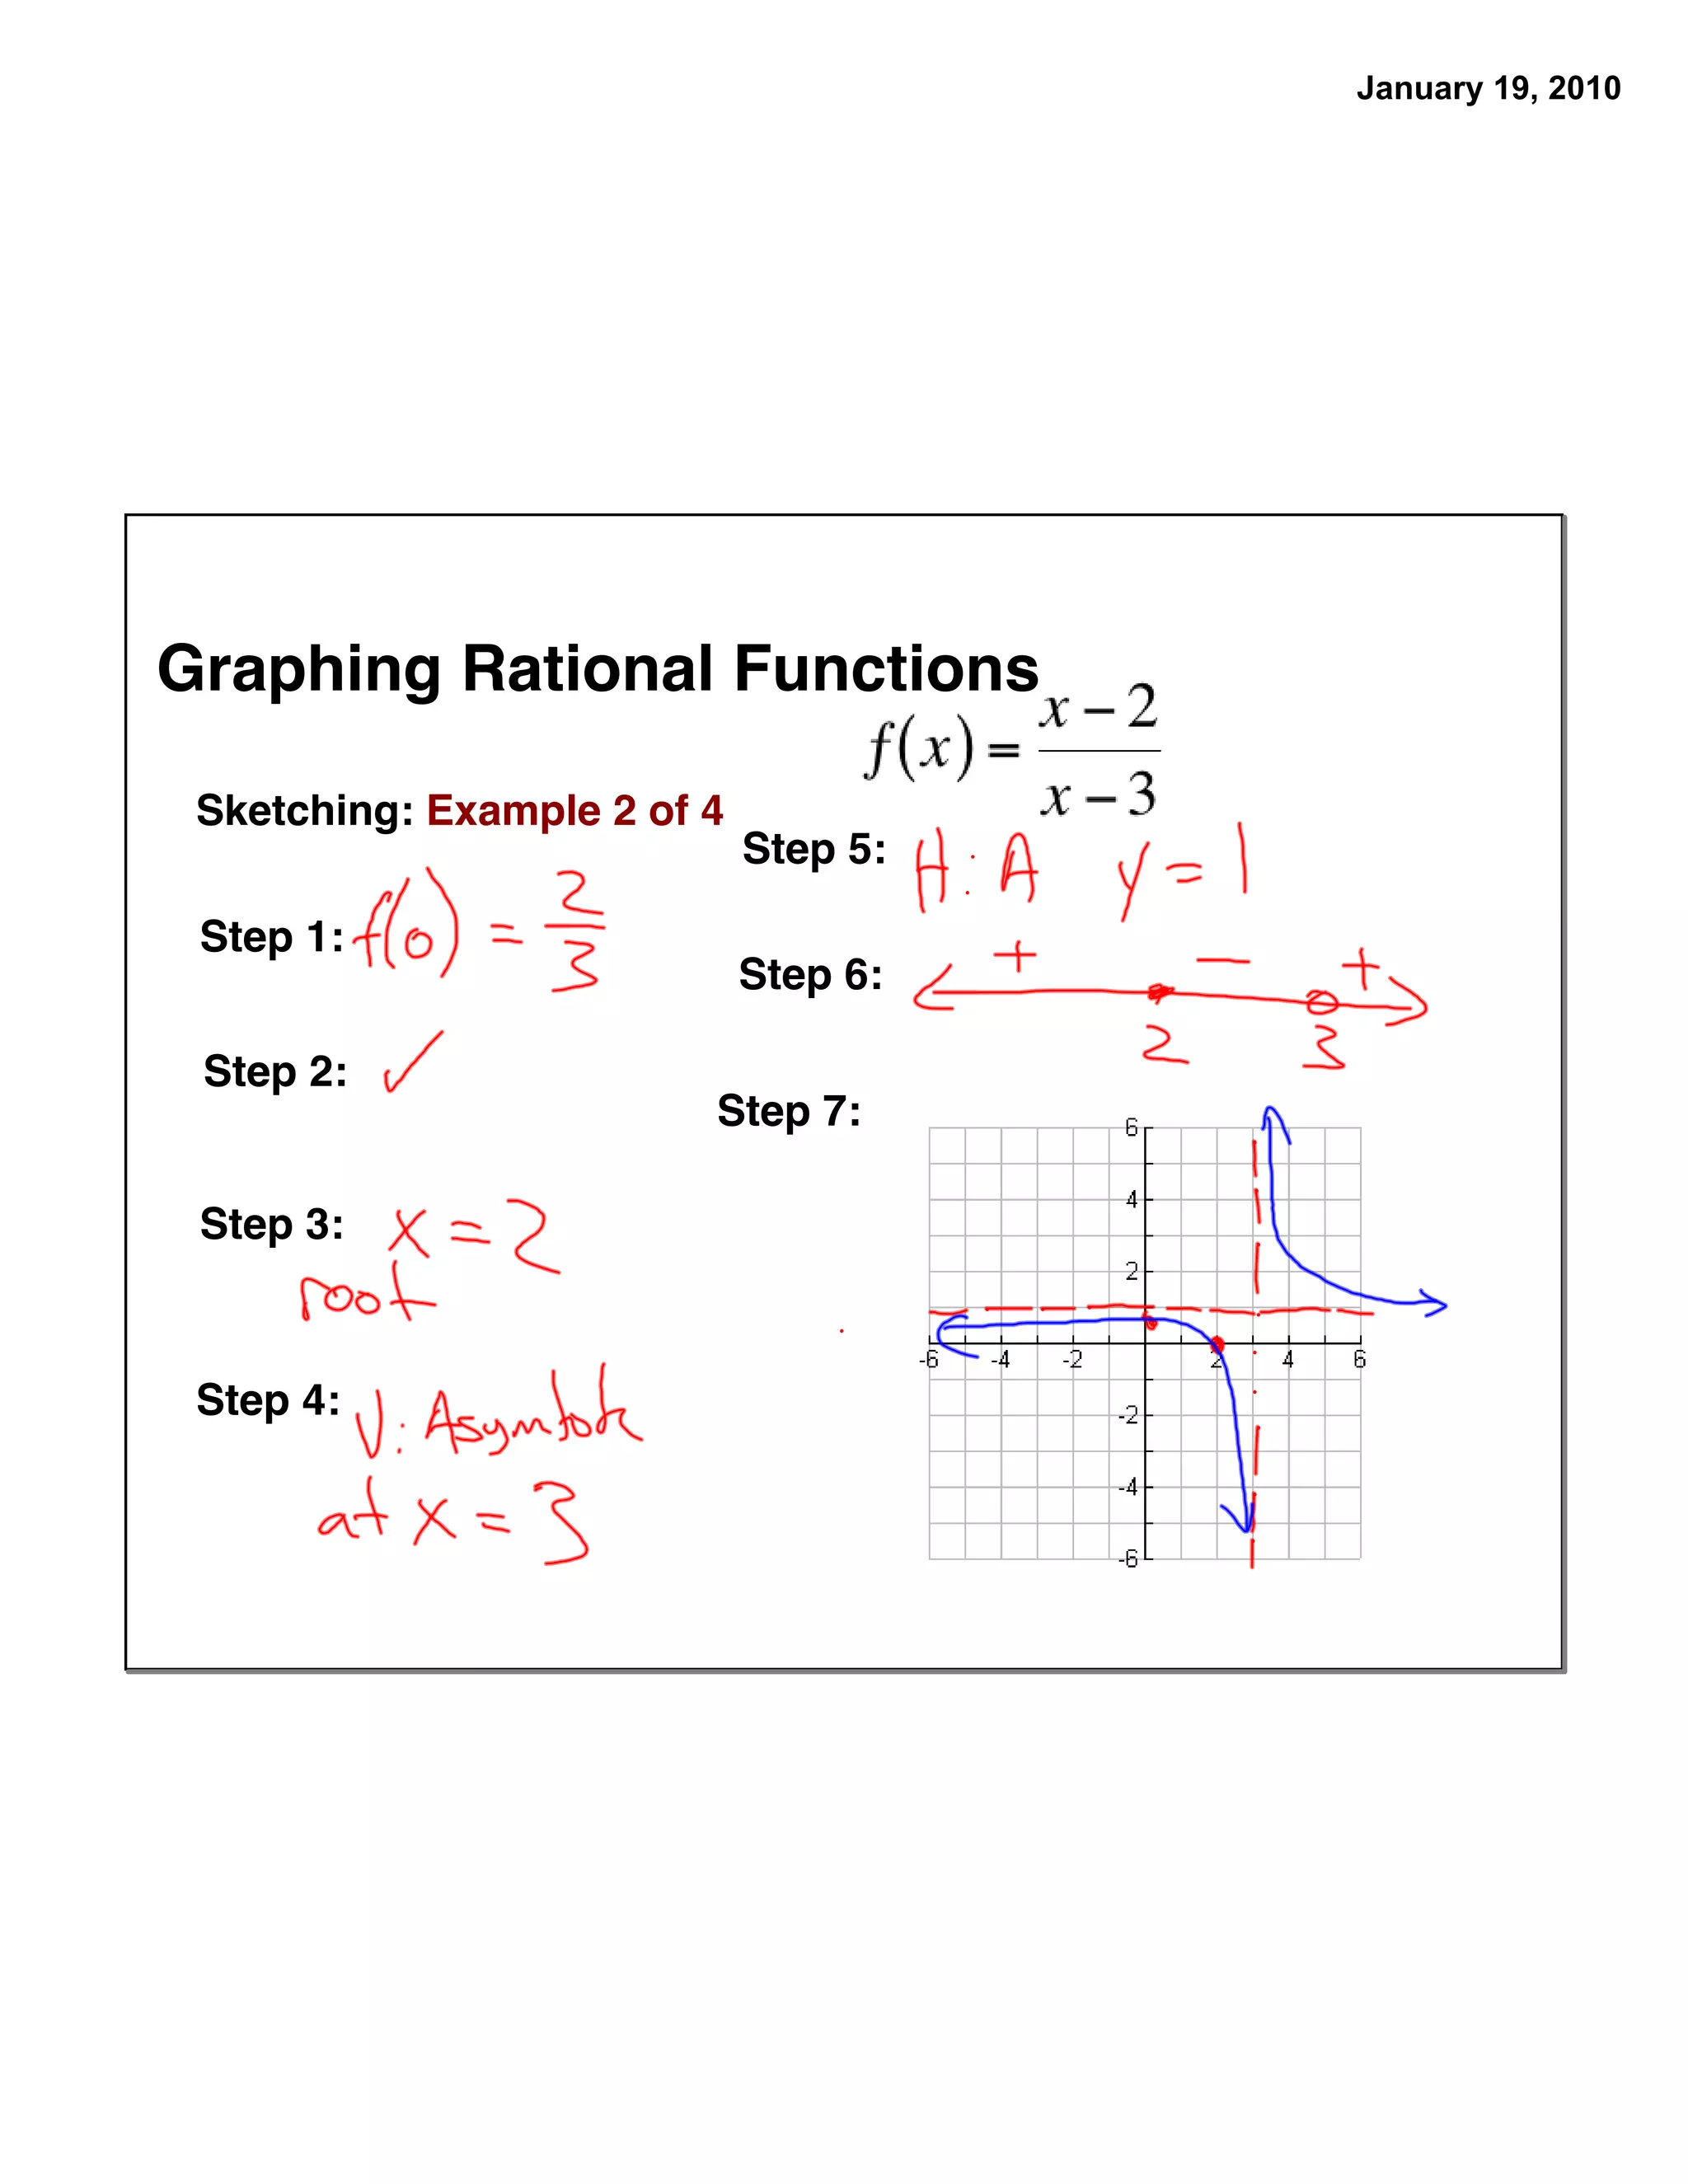
Sketching: Example 1 of 4
Step 1: Step 5:
Step 6:
Step 2:
Step 3: Step 7:
Step 4:
![January 19, 2010
Graphing Rational Functions
Step 5: Find the horizontal asymptotes by dividing each term in the
function by the highest power of x, and take the limit as x goes to infinity.
(Use the UNfactored form.)
You will find that, in general, there are three possible results:
i When [degree of numerator < degree of denominator]
the horizontal asymptote is y = 0.
ii When [degree of numerator = degree of denominator]
the H.A. is the ratio leading coefficient of a(x)
leading coefficient of b(x)
iii When [degree of numerator > degree of denominator] there is
no horizontal asymptote; however there may be a slant asymptote or
a hole in the graph.](https://image.slidesharecdn.com/graphingrationalfunctions-100120111630-phpapp02/75/Graphing-Rational-Functions-4-2048.jpg)


![770908401-PPT-W2Q1-Rational-Functions-1 pptx. [Autosaved].pptx](https://cdn.slidesharecdn.com/ss_thumbnails/770908401-ppt-w2q1-rational-functions-1pptx-251106135035-b499d3b0-thumbnail.jpg?width=640&height=640&fit=bounds)


