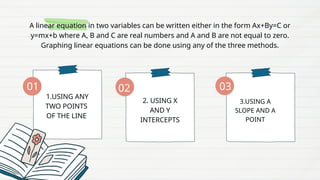
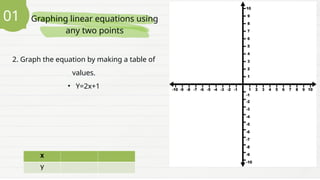
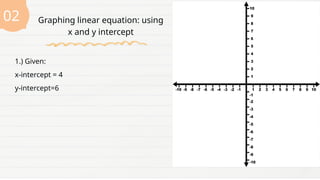
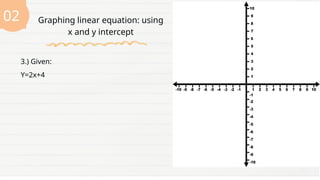
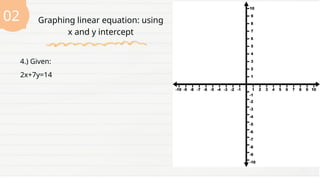
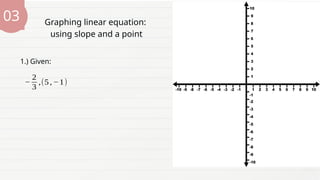
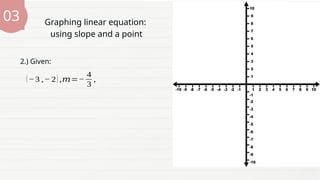
The document provides a lesson for Grade 8 students on graphing linear equations in two variables using three methods: two points, x and y intercepts, and slope with a point. It includes examples and exercises for each method, illustrating how to graph equations and interpret their intercepts. The lesson aims to equip students with the skills to apply these methods to real-life problems.


![Introduction_to_Linear_Equation[1].pdf Algebra 1](https://cdn.slidesharecdn.com/ss_thumbnails/introductiontolinearequation1-241214102404-e9b93535-thumbnail.jpg?width=640&height=640&fit=bounds)


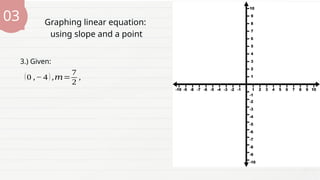
![LESSON PROPER_01 - Linear equations in two variables [Autosaved].pptx](https://cdn.slidesharecdn.com/ss_thumbnails/lessonproper01-linearequationsintwovariablesautosaved-250111120457-2ac44e4b-thumbnail.jpg?width=640&height=640&fit=bounds)


