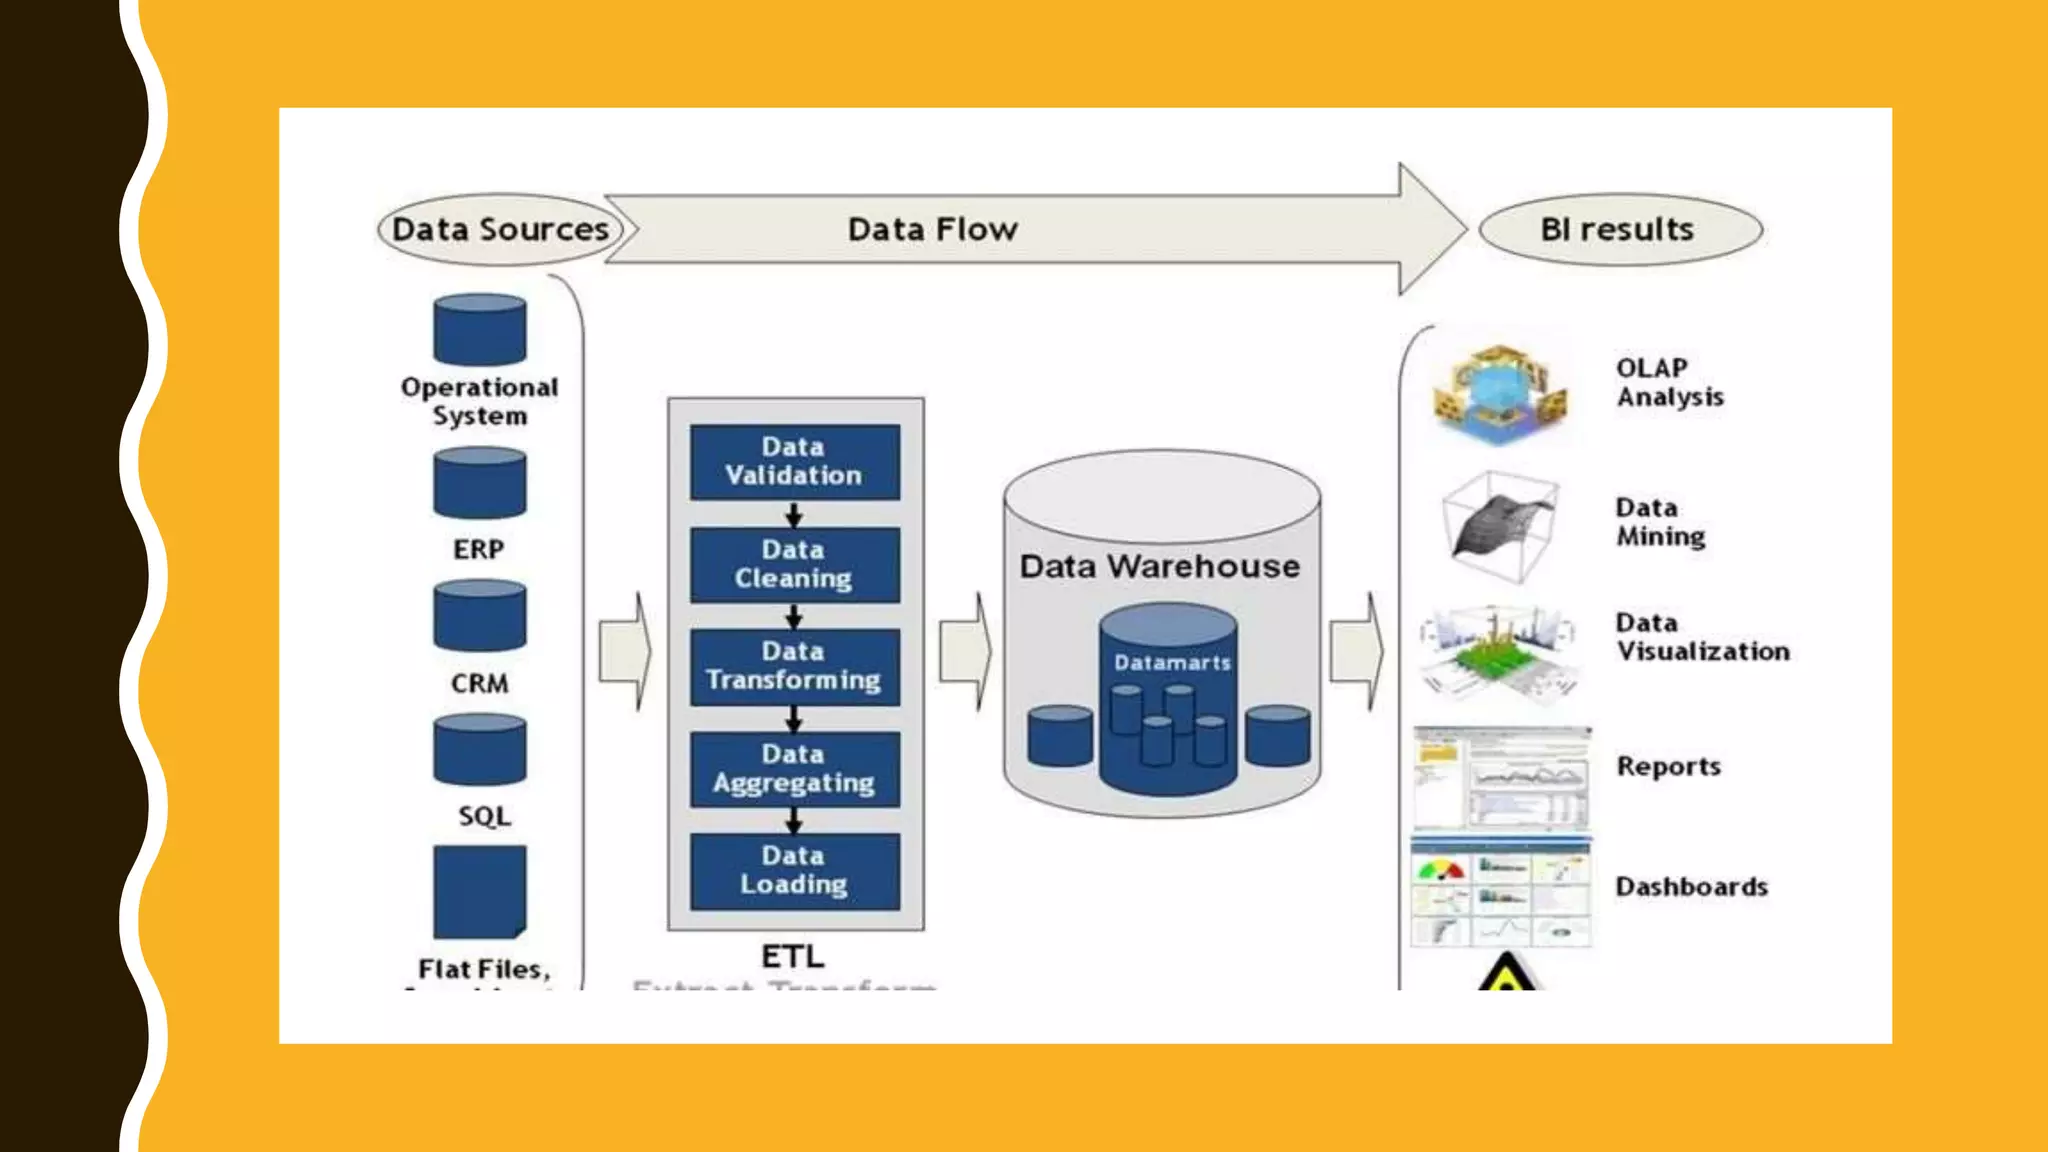
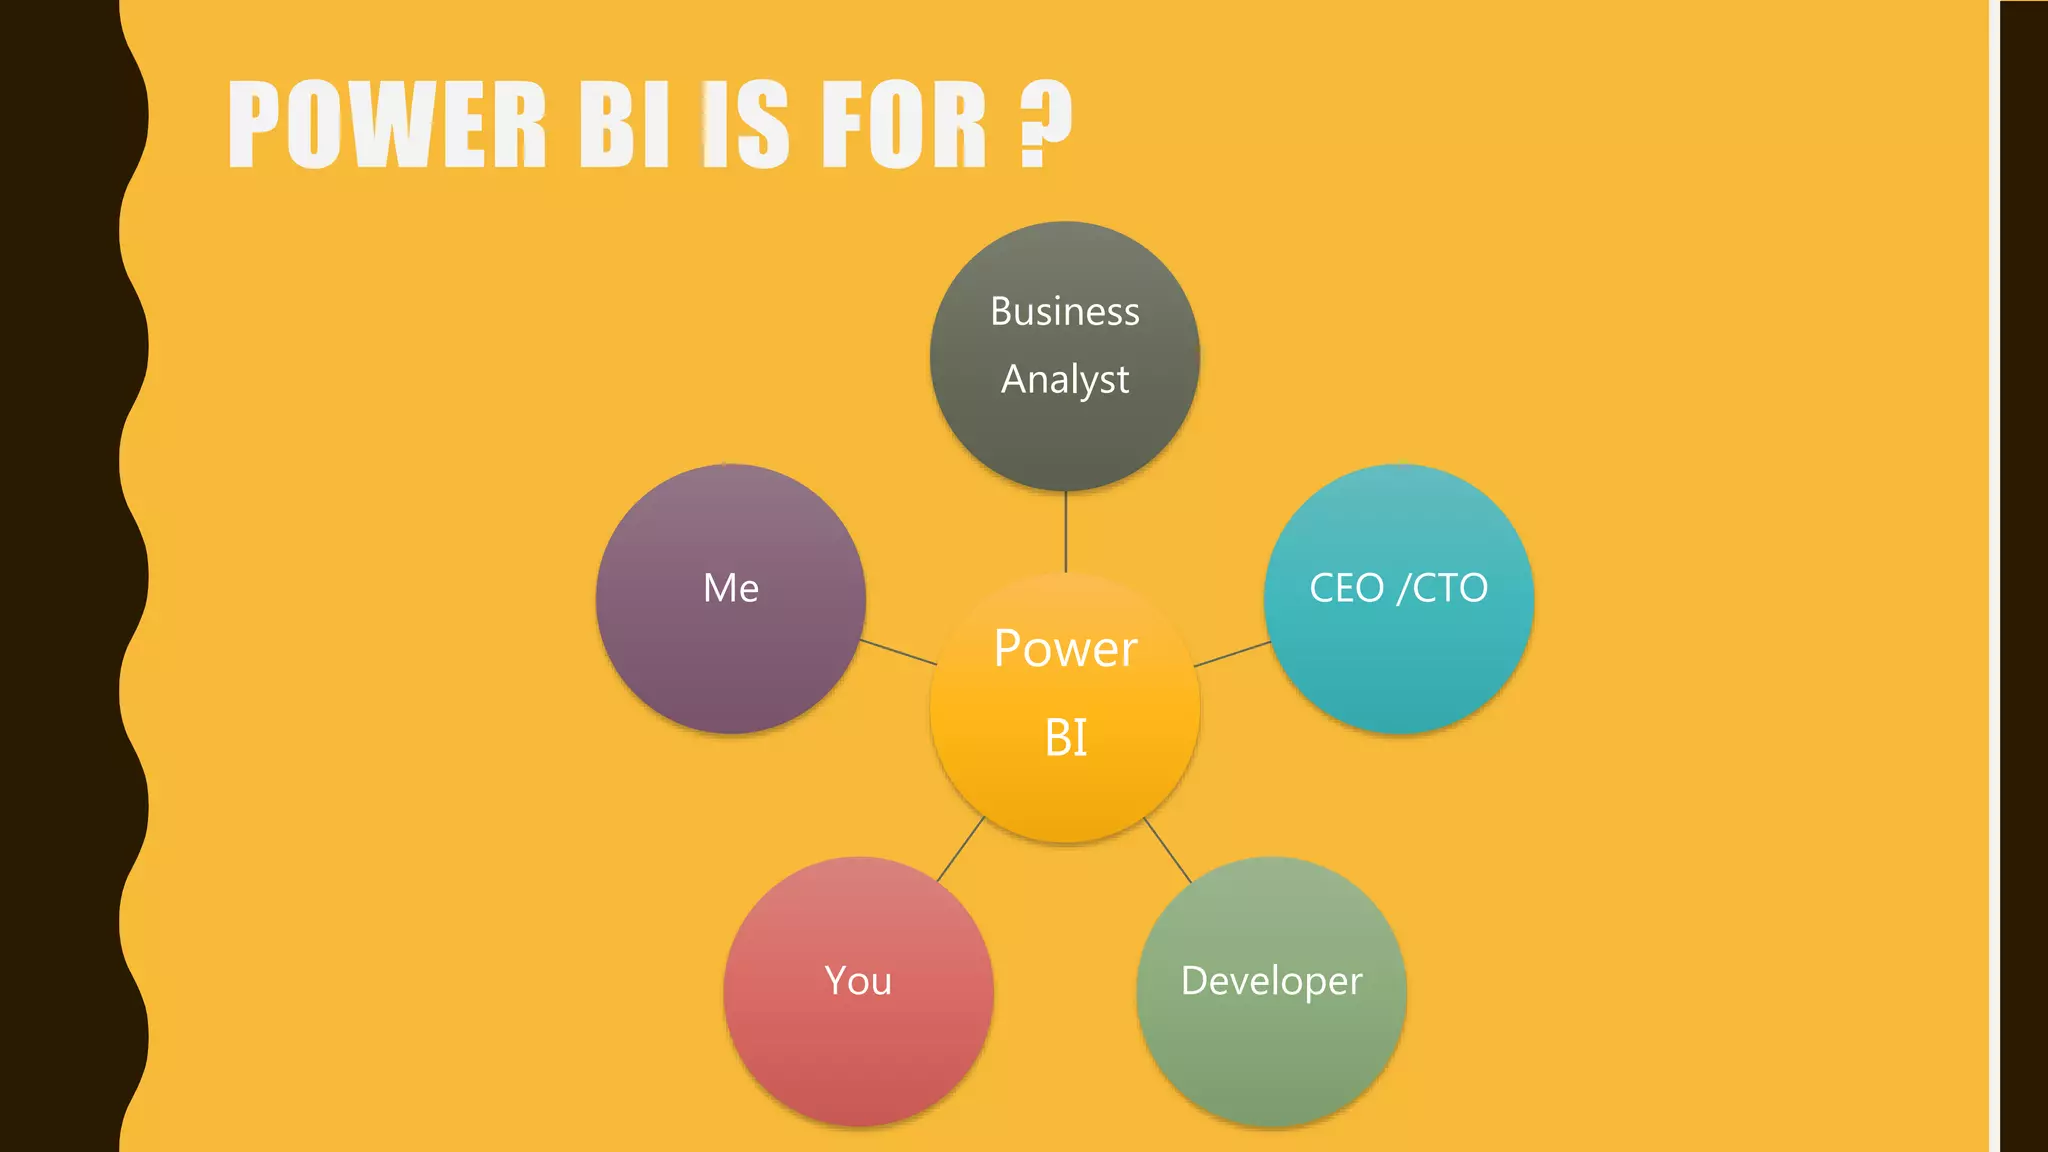
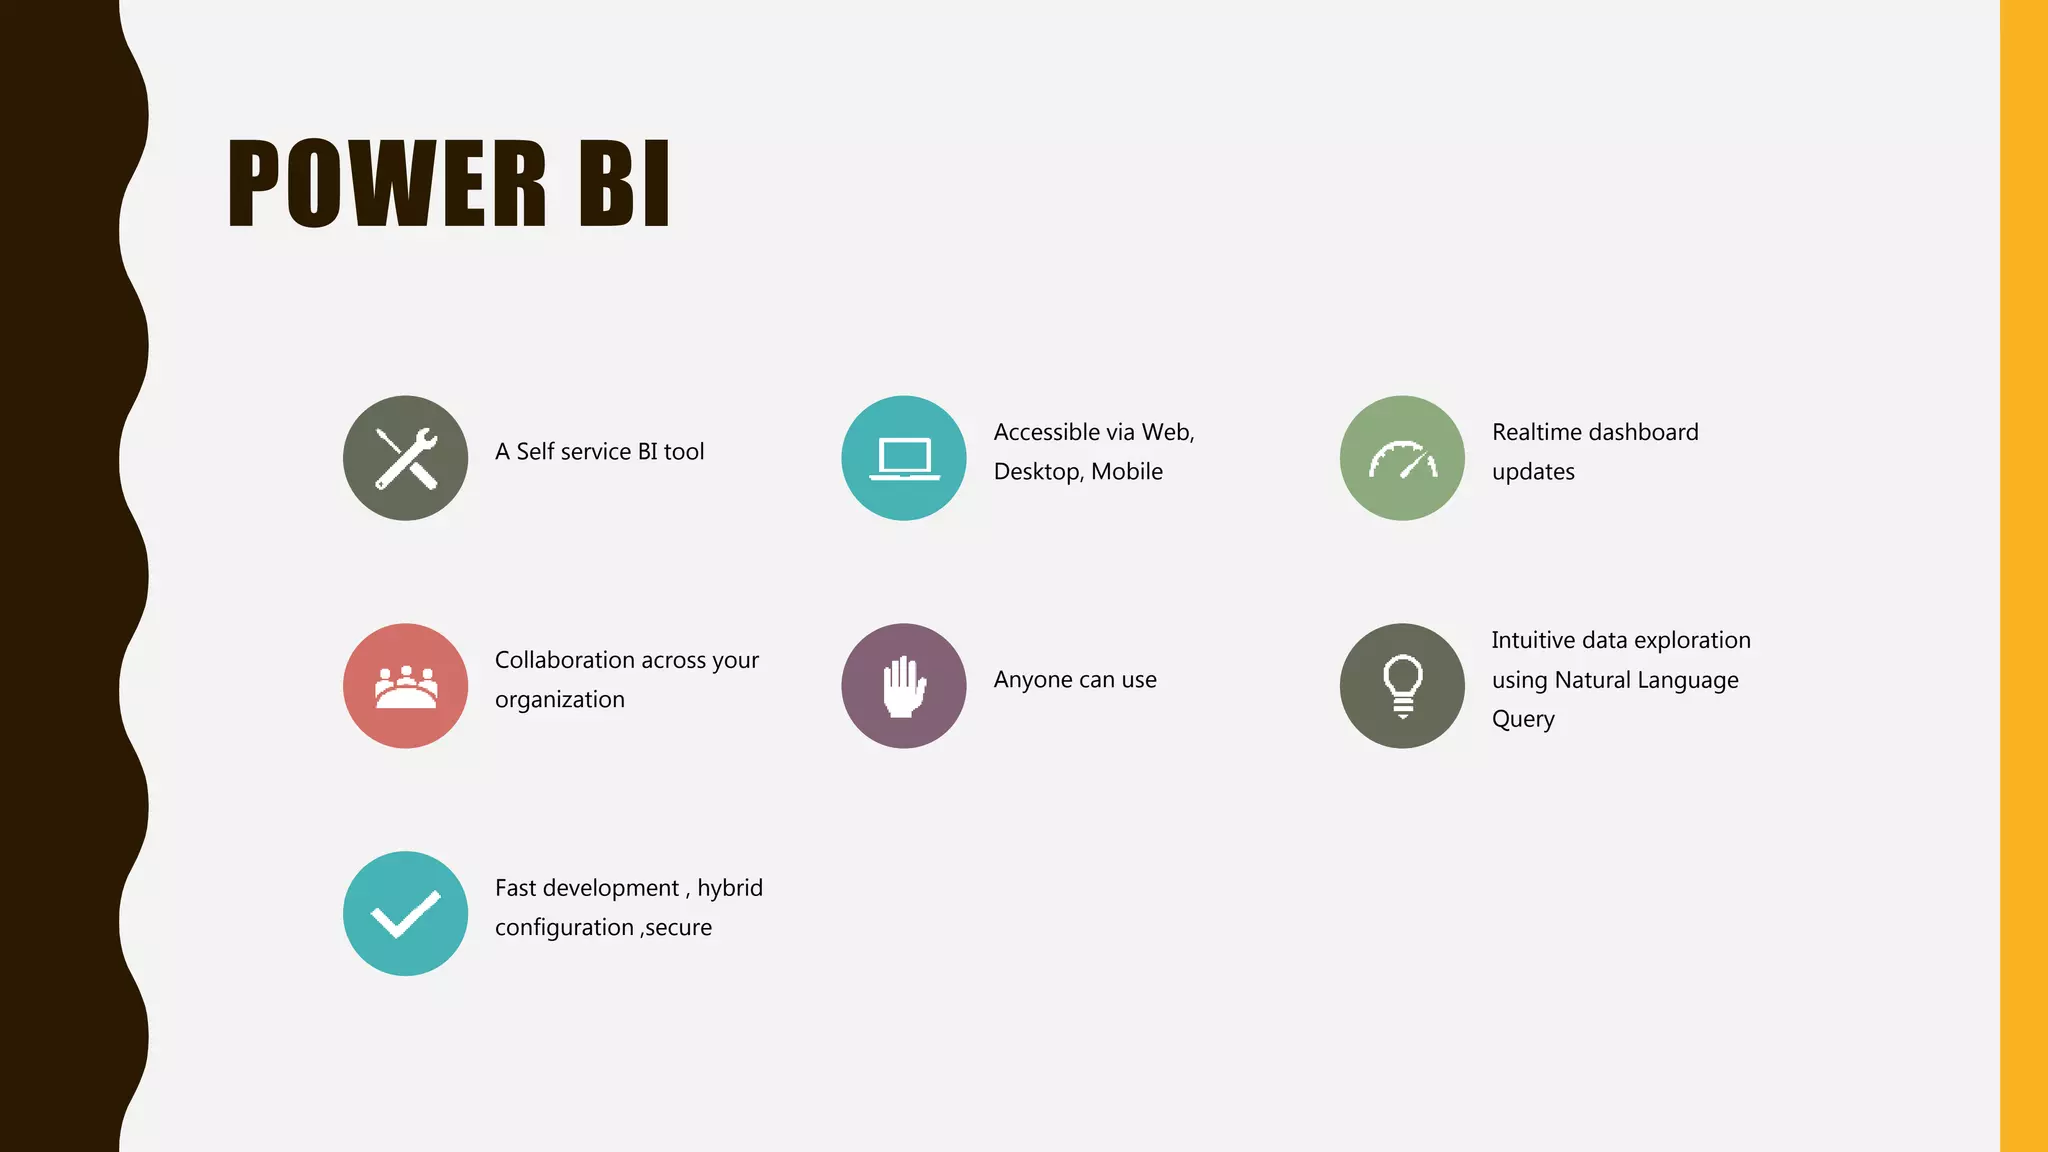
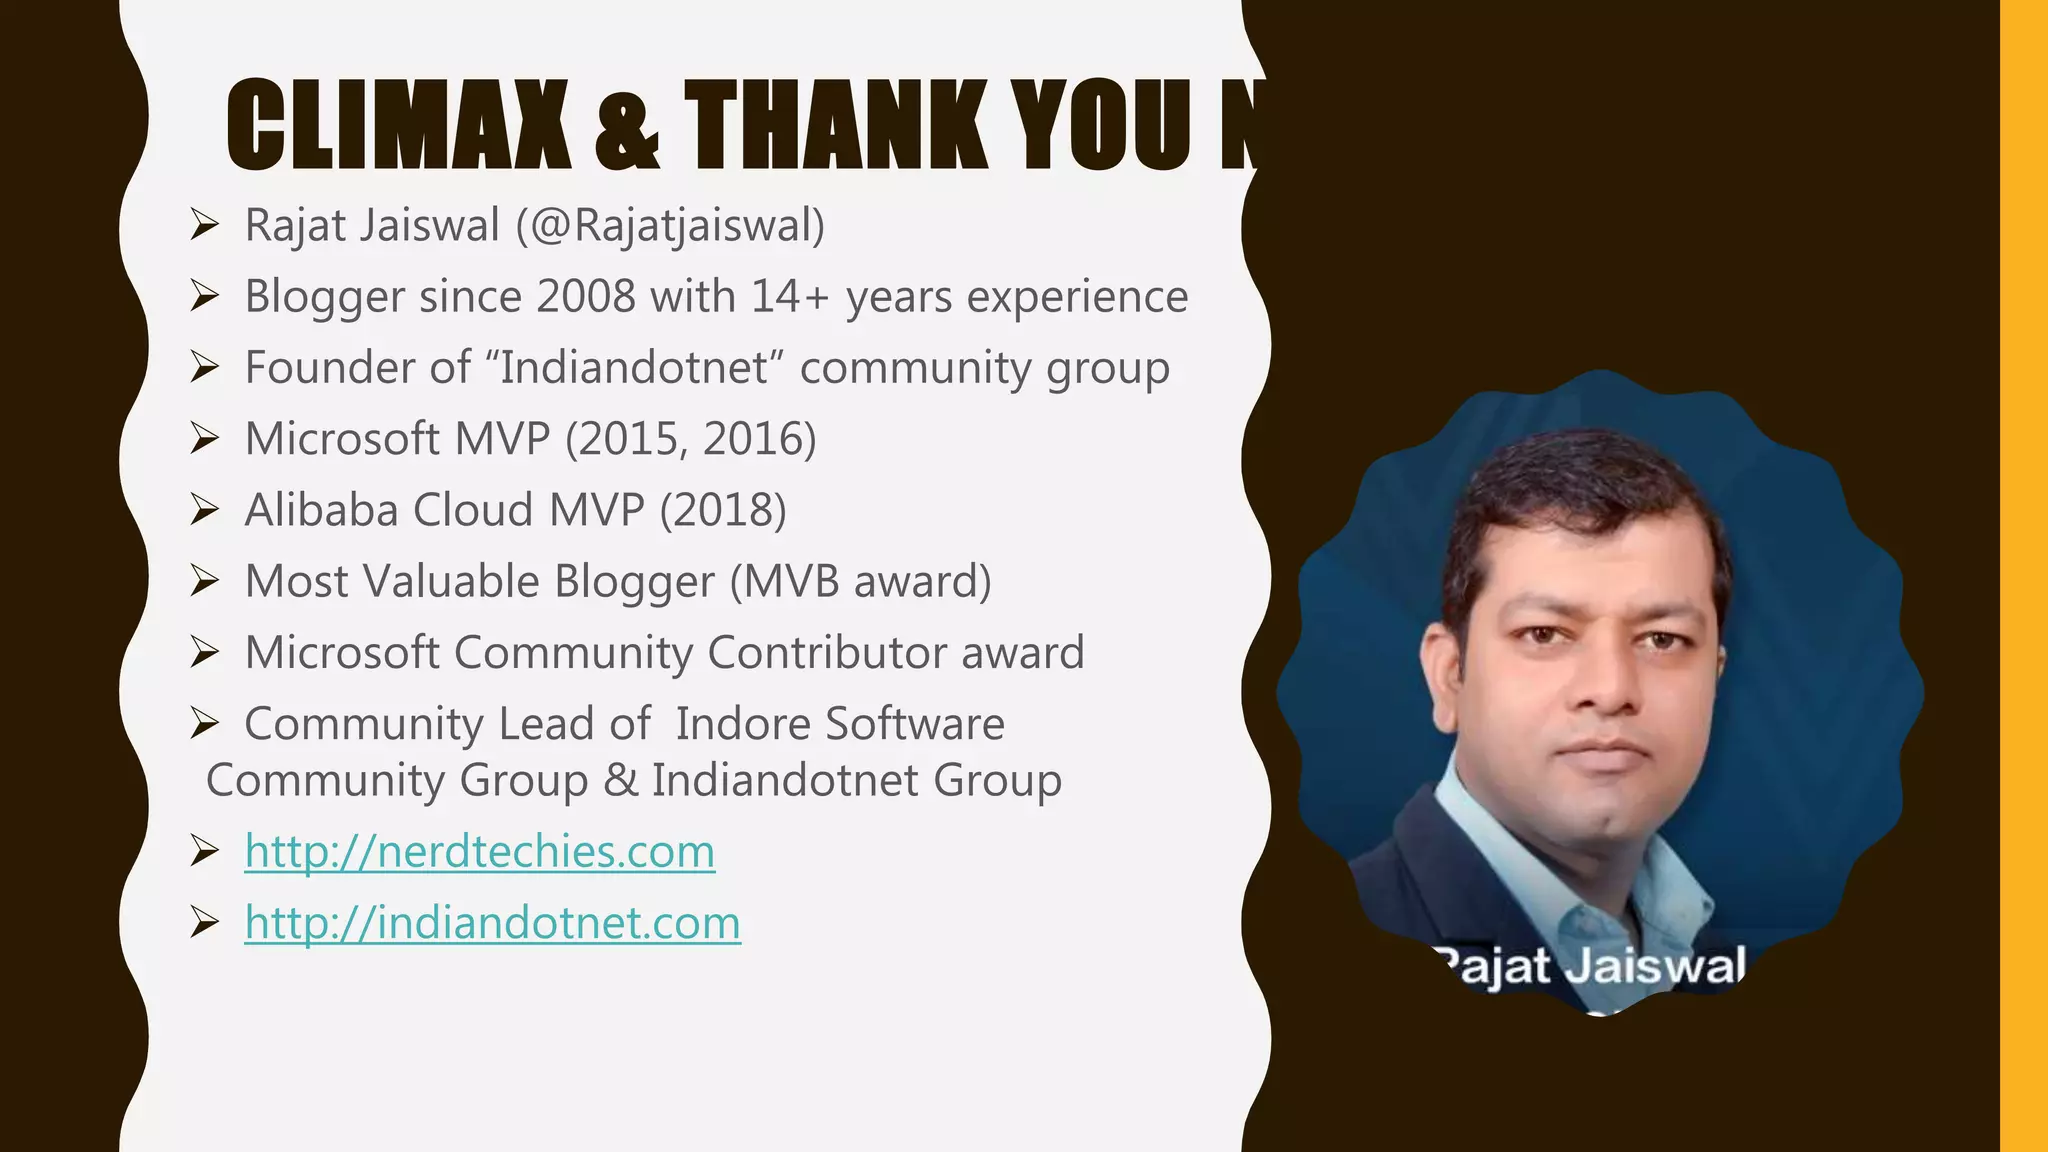
ZERO TO
HERO IN
POWER BI
A F R E E L E A R N I N G S E S S I O N B Y I N D I A N D O T N E T & I N D O R E
S O F T W A R E C O M M U N I T Y G R O U P
W H Y TO J O I N
CO M M U N I T Y
Free Learning
Increase your technical
knowledge
Increase your technical circle
Grab Job opportunities
Grab attending certificate
Showcase your knowledge
Indore Software Developer
Community
Indiandotnet Community
AGENDA
• 10,000 Feet view of BI ( Under stand Business
Intelligence)
• Components of Power BI
• Examples , Examples, Examples
• Learning Material
• Your Film Director
WOULD YOU LIKE TO SEE THE DATA LIKE
BELOW?
IS IT A BETTER WAY TO SEE ?
WHAT ABOUT THIS?
BUSINESS INTELLIGENCE
Actionable
High-
Value
AccurateTimely
Business Intelligence = Technologies + Analysis + Presentation + Helping Decision Making
STARTING WITH
POWER BI
O U R F I L M S TA R T F R O M H E R E
POWER BI IS FOR ?
Power
BI
Business
Analyst
CEO /CTO
DeveloperYou
Me
POWER BI
A Self service BI tool
Accessible via Web,
Desktop, Mobile
Realtime dashboard
updates
Collaboration across your
organization
Anyone can use
Intuitive data exploration
using Natural Language
Query
Fast development , hybrid
configuration ,secure
POWER BI PARTS
Power BI
Power BI
Desktop
Power Bi
Services
Getway
Power BI
Mobile
Power BI
Embeded
Power BI
database
POWER BI DESKTOP
Power BI Desktop puts visual analytics at your fingertips with intuitive report
authoring. Drag-and-drop to place content exactly where you want it on the flexible
and fluid canvas. Quickly discover patterns as you explore a single unified view of
linked, interactive visualizations.
SIMPLE REPORT
EXAMPLE
VISUAL
INTERACTION
EXAMPLE
SORTING
EXAMPLE
MORE
EXAMPLES
OTHER RESOURCES
• https://powerbi.microsoft.com/en-us/what-is-power-bi/
• https://appsource.microsoft.com/en-us/marketplace/apps?product=power-bi-visuals
• https://community.powerbi.com/
• https://community.powerbi.com/t5/Forums/ct-p/Forums
• http://D3.js
• https://community.powerbi.com/t5/Data-Stories-Gallery/bd-p/DataStoriesGallery
CLIMAX & THANK YOU NOTE
 Rajat Jaiswal (@Rajatjaiswal)
 Blogger since 2008 with 14+ years experience
 Founder of “Indiandotnet” community group
 Microsoft MVP (2015, 2016)
 Alibaba Cloud MVP (2018)
 Most Valuable Blogger (MVB award)
 Microsoft Community Contributor award
 Community Lead of Indore Software
Community Group & Indiandotnet Group
 http://nerdtechies.com
 http://indiandotnet.com
Power BI Zero to Hero by Rajat Jaiswal

Power BI Zero to Hero by Rajat Jaiswal

  • 1.
    ZERO TO HERO IN POWERBI A F R E E L E A R N I N G S E S S I O N B Y I N D I A N D O T N E T & I N D O R E S O F T W A R E C O M M U N I T Y G R O U P
  • 2.
    W H YTO J O I N CO M M U N I T Y Free Learning Increase your technical knowledge Increase your technical circle Grab Job opportunities Grab attending certificate Showcase your knowledge Indore Software Developer Community Indiandotnet Community
  • 3.
    AGENDA • 10,000 Feetview of BI ( Under stand Business Intelligence) • Components of Power BI • Examples , Examples, Examples • Learning Material • Your Film Director
  • 4.
    WOULD YOU LIKETO SEE THE DATA LIKE BELOW?
  • 5.
    IS IT ABETTER WAY TO SEE ?
  • 6.
  • 7.
    BUSINESS INTELLIGENCE Actionable High- Value AccurateTimely Business Intelligence= Technologies + Analysis + Presentation + Helping Decision Making
  • 10.
    STARTING WITH POWER BI OU R F I L M S TA R T F R O M H E R E
  • 11.
    POWER BI ISFOR ? Power BI Business Analyst CEO /CTO DeveloperYou Me
  • 12.
    POWER BI A Selfservice BI tool Accessible via Web, Desktop, Mobile Realtime dashboard updates Collaboration across your organization Anyone can use Intuitive data exploration using Natural Language Query Fast development , hybrid configuration ,secure
  • 13.
    POWER BI PARTS PowerBI Power BI Desktop Power Bi Services Getway Power BI Mobile Power BI Embeded Power BI database
  • 14.
    POWER BI DESKTOP PowerBI Desktop puts visual analytics at your fingertips with intuitive report authoring. Drag-and-drop to place content exactly where you want it on the flexible and fluid canvas. Quickly discover patterns as you explore a single unified view of linked, interactive visualizations.
  • 15.
  • 16.
  • 17.
  • 18.
  • 19.
    OTHER RESOURCES • https://powerbi.microsoft.com/en-us/what-is-power-bi/ •https://appsource.microsoft.com/en-us/marketplace/apps?product=power-bi-visuals • https://community.powerbi.com/ • https://community.powerbi.com/t5/Forums/ct-p/Forums • http://D3.js • https://community.powerbi.com/t5/Data-Stories-Gallery/bd-p/DataStoriesGallery
  • 20.
    CLIMAX & THANKYOU NOTE  Rajat Jaiswal (@Rajatjaiswal)  Blogger since 2008 with 14+ years experience  Founder of “Indiandotnet” community group  Microsoft MVP (2015, 2016)  Alibaba Cloud MVP (2018)  Most Valuable Blogger (MVB award)  Microsoft Community Contributor award  Community Lead of Indore Software Community Group & Indiandotnet Group  http://nerdtechies.com  http://indiandotnet.com

Editor's Notes

  • #8 The term Business Intelligence (BI) refers to technologies, applications and practices for the collection, integration, analysis, and presentation of business information. The purpose of Business Intelligence is to support better business decision making. Insight” does a good job of encompassing the deliverables that flow from a good BI project. This insight plus your organizations industry and business experience will help you make more informed decisions.
  • #9 Heterogeneous sources flat file, excel, SQL server ,Oracle etc SSIS ABInitio Informatica All dataware house are databases All database may not be dataware houses
  • #11 https://community.powerbi.com/t5/Data-Stories-Gallery/Bookmarks-Contest-2016-US-Elections/m-p/329547 https://community.powerbi.com/t5/Data-Stories-Gallery/PUBG-Power-BI-Tool/m-p/349425?advanced=false&collapse_discussion=true&filter=location&location=forum-board:DataStoriesGallery&q=bahubali&search_type=thread https://community.powerbi.com/t5/Data-Stories-Gallery/Happy-Holidays/m-p/329358
  • #12 A myth is who can use the application.
  • #13 Talking points: Power BI is a cloud-based analytics service that provides faster time to insight. It is used for visualizing, exploring and extracting insights from data. It brings together data from diverse sources to deliver rich, comprehensive views of business operations. What that means is, with Power BI, you can see all of your data through a single pane of glass, and create an analytics environment in minutes to monitor data and share reports. Live dashboards and reports show visualizations and KPIs from data that reside both on-premises and in the cloud, providing a consolidated view across your business regardless of where your data lives. There are several capabilities that are unique to Power BI – these include: Pre-built dashboards and reports for popular SaaS solutions such as Marketo, Salesforce, GitHub, ZenDesk, Dynamics CRM, and many others Dashboards and visualizations that support real-time updates Secure, live connection to on-premises data sources to drive insight across the entire range of organizational information (Analysis Services, Azure SQL Database, SQL Database Auditing, Azure SQL Data Warehouse) Automated scheduled refresh to keep your Power BI data in sync with on premises data sources Native mobile applications for keeping users connected on the go Easy integration with other Microsoft offerings, from Excel to Azure services Intuitive data exploration, which enables users to ask questions of their data in plain English To summarize, Power BI is a SaaS offering that enables anyone to easily connect to their data, create live operational dashboards and explore data via interactive visualizations
  • #14 Power BI desktop – A desktop based free version for connecting t, transforming and visualizing Power BI service – A web based service for collaboration , sharing , creation of desktop Power BI mobile – Native application for IOS, Android and windows for viewing report and dashboard On Premises gateways – An agent installed with corporate network to allow secure access o organizational data source . Power BI Report server – An alternative to Power BI Service for Deploying Power BI Report on Premises data centre Power BI Embedded – Api For embedding visual into Custom application
  • #15 Use different data source till now 60+ data sources available Different graphs /Charts / KPI available Monthly update Huge collection of Free downloadable tool Effortless publishing Standalone design/development/rendering app with deployment to Power BI Service Currently integrates: Power Query Power Pivot Power View * Not all features of each yet, but updates each month, closing the gap New Power BI Desktop file extension .pbix
  • #19 Calculate column Measuremnt Date